Statistik Asas
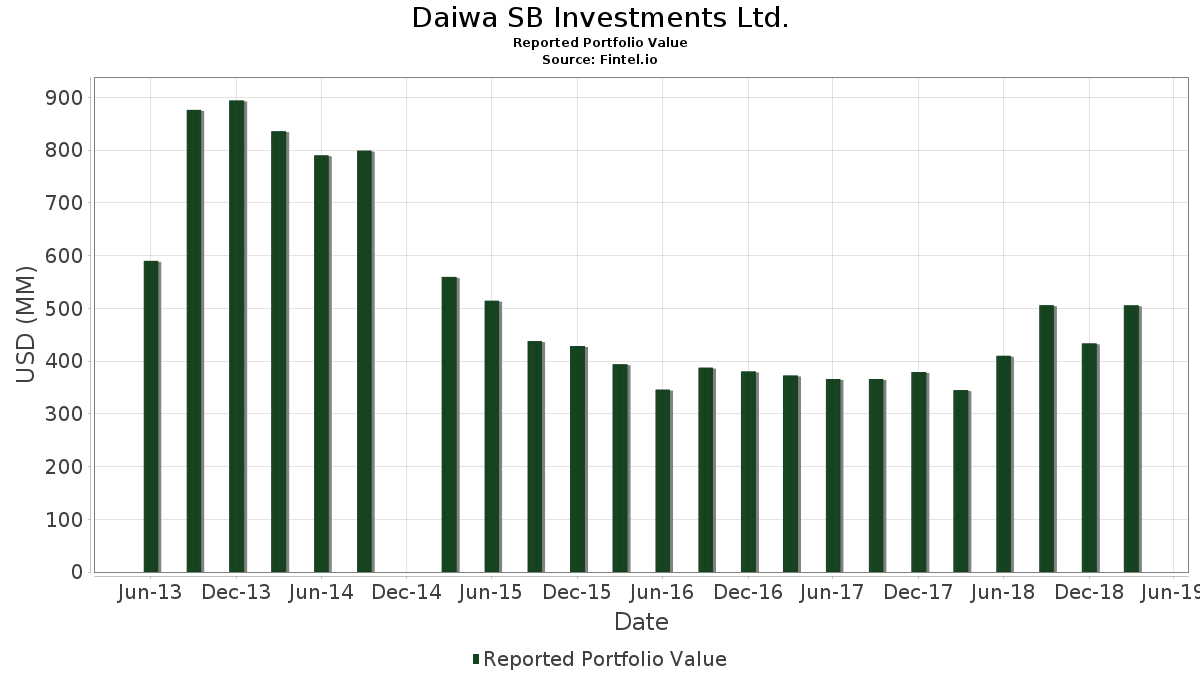
| Nilai Portfolio | $ 505,521,000 |
| Kedudukan Semasa | 221 |
Pegangan Terkini, Prestasi, AUM (dari 13F, 13D)
Daiwa SB Investments Ltd. telah mendedahkan 221 jumlah pegangan dalam pemfailan SEC terkini mereka. Nilai portfolio terkini dikira sebagai $ 505,521,000 USD. Aset Sebenar Di Bawah Pengurusan (AUM) ialah nilai ini ditambah dengan tunai (yang tidak didedahkan). Pegangan teratas Daiwa SB Investments Ltd. ialah iShares, Inc. - iShares MSCI Emerging Markets ETF (US:EEM) , Avangrid, Inc. (US:AGR) , NextEra Energy, Inc. (US:NEE) , Zoetis Inc. (US:ZTS) , and Johnson & Johnson (US:JNJ) . Kedudukan baharu Daiwa SB Investments Ltd. termasuk Centene Corporation (US:CNC) , Fox Corporation (US:FOX) , iShares, Inc. - iShares MSCI Japan ETF (US:EWJ) , Coca-Cola Europacific Partners PLC (GB:CCEP) , and SPDR Index Shares Funds - SPDR Dow Jones Global Real Estate ETF (US:RWO) .
Kenaikan Teratas Suku Tahun Ini
Kami menggunakan perubahan dalam peruntukan portfolio kerana ini adalah metrik yang paling bermakna. Perubahan boleh disebabkan oleh perdagangan atau perubahan dalam harga saham.
| Sekuriti | Saham (MM) |
Nilai (MM$) |
Portfolio % | ΔPortfolio % |
|---|---|---|---|---|
| 0.70 | 29.86 | 5.9078 | 5.9078 | |
| 0.23 | 10.52 | 2.0808 | 2.0808 | |
| 0.26 | 7.76 | 1.5349 | 1.5349 | |
| 0.07 | 5.58 | 1.1034 | 1.1034 | |
| 0.08 | 11.38 | 2.2509 | 0.9257 | |
| 0.17 | 4.32 | 0.8552 | 0.8552 | |
| 0.08 | 3.84 | 0.7588 | 0.7588 | |
| 0.14 | 3.24 | 0.6409 | 0.6409 | |
| 0.35 | 17.45 | 3.4517 | 0.6309 | |
| 0.03 | 2.37 | 0.4686 | 0.4686 |
Penurunan Teratas Suku Tahun Ini
Kami menggunakan perubahan dalam peruntukan portfolio kerana ini adalah metrik yang paling bermakna. Perubahan boleh disebabkan oleh perdagangan atau perubahan dalam harga saham.
| Sekuriti | Saham (MM) |
Nilai (MM$) |
Portfolio % | ΔPortfolio % |
|---|---|---|---|---|
| 0.15 | 9.71 | 1.9202 | -0.8798 | |
| 0.17 | 3.70 | 0.7325 | -0.7965 | |
| 0.03 | 8.14 | 1.6102 | -0.3481 | |
| 0.02 | 2.62 | 0.5181 | -0.3193 | |
| 0.10 | 10.12 | 2.0013 | -0.2986 | |
| 0.89 | 13.31 | 2.6339 | -0.2912 | |
| 0.10 | 14.39 | 2.8472 | -0.2889 | |
| 0.08 | 4.87 | 0.9638 | -0.2505 | |
| 0.00 | 0.00 | -0.2301 | ||
| 0.00 | 0.00 | -0.2100 |
13F dan Pemfailan Dana
Borang ini telah difailkan pada 2019-04-18 untuk tempoh pelaporan 2019-03-31. Klik ikon pautan untuk melihat sejarah transaksi penuh.
Tingkatkan untuk membuka data premium dan eksport ke Excel ![]() .
.
| Sekuriti | Jenis | Purata Harga Saham | Saham (MM) |
ΔSaham (%) |
ΔSaham (%) |
Nilai ($MM) |
Portfolio (%) |
ΔPortfolio (%) |
|
|---|---|---|---|---|---|---|---|---|---|
| EEM / iShares, Inc. - iShares MSCI Emerging Markets ETF | 0.70 | 29.86 | 5.9078 | 5.9078 | |||||
| AGR / Avangrid, Inc. | 0.35 | 42.03 | 17.45 | 42.77 | 3.4517 | 0.6309 | |||
| NEE / NextEra Energy, Inc. | 0.08 | -1.34 | 15.69 | 9.73 | 3.1041 | -0.1963 | |||
| ZTS / Zoetis Inc. | 0.14 | -3.28 | 14.45 | 13.83 | 2.8580 | -0.0715 | |||
| JNJ / Johnson & Johnson | 0.10 | -2.21 | 14.39 | 5.92 | 2.8472 | -0.2889 | |||
| MSFT / Microsoft Corporation | 0.12 | -3.82 | 14.18 | 11.69 | 2.8052 | -0.1252 | |||
| XYL / Xylem Inc. | 0.18 | -0.30 | 13.87 | 18.10 | 2.7435 | 0.0333 | |||
| FSLR / First Solar, Inc. | 0.26 | -0.95 | 13.65 | 23.29 | 2.7000 | 0.1448 | |||
| LAUR / Laureate Education, Inc. | 0.89 | 6.95 | 13.31 | 5.06 | 2.6339 | -0.2912 | |||
| AWK / American Water Works Company, Inc. | 0.12 | 0.00 | 12.81 | 14.86 | 2.5348 | -0.0400 | |||
| BLKB / Blackbaud, Inc. | 0.15 | 9.45 | 12.34 | 38.74 | 2.4412 | 0.3883 | |||
| JCI / Johnson Controls International plc | 0.32 | -13.59 | 11.91 | 7.65 | 2.3564 | -0.1974 | |||
| PEGI / Pattern Energy Group Inc. | 0.54 | 3.82 | 11.85 | 22.66 | 2.3439 | 0.1144 | |||
| BXP / Boston Properties, Inc. | 0.08 | 66.60 | 11.38 | 98.17 | 2.2509 | 0.9257 | |||
| NUAN / Nuance Communications Inc | 0.67 | 9.23 | 11.36 | 39.79 | 2.2470 | 0.3715 | |||
| HD / The Home Depot, Inc. | 0.06 | 0.76 | 10.88 | 12.53 | 2.1514 | -0.0792 | |||
| SQ / Block, Inc. | 0.14 | 6.14 | 10.74 | 41.77 | 2.1249 | 0.3762 | |||
| ITRI / Itron, Inc. | 0.23 | 7.79 | 10.52 | 6.34 | 2.0808 | 2.0808 | |||
| JPM / JPMorgan Chase & Co. | 0.10 | -2.10 | 10.12 | 1.53 | 2.0013 | -0.2986 | |||
| TXN / Texas Instruments Incorporated | 0.10 | 0.00 | 10.10 | 12.25 | 1.9975 | -0.0787 | |||
| CVA / Covanta Holding Corporation | 0.58 | -4.96 | 10.05 | 22.58 | 1.9877 | 0.0958 | |||
| MCD / McDonald's Corporation | 0.05 | -1.24 | 9.71 | 5.62 | 1.9208 | -0.2009 | |||
| COP / ConocoPhillips | 0.15 | -25.25 | 9.71 | -19.99 | 1.9202 | -0.8798 | |||
| INST / Instructure Holdings, Inc. | 0.20 | 8.71 | 9.25 | 36.55 | 1.8300 | 0.2663 | |||
| CSCO / Cisco Systems, Inc. | 0.16 | -2.17 | 8.73 | 21.90 | 1.7275 | 0.0741 | |||
| BABA / Alibaba Group Holding Limited - Depositary Receipt (Common Stock) | 0.05 | -3.90 | 8.55 | 27.93 | 1.6909 | 0.1487 | |||
| RTN / Raytheon Co. | 0.05 | -9.94 | 8.40 | 6.94 | 1.6618 | -0.1513 | |||
| ADI / Analog Devices, Inc. | 0.08 | -2.41 | 8.26 | 19.70 | 1.6347 | 0.0413 | |||
| TSLA / Tesla, Inc. | 0.03 | 52.07 | 8.17 | 27.88 | 1.6169 | 0.1417 | |||
| UNH / UnitedHealth Group Incorporated | 0.03 | -3.35 | 8.14 | -4.07 | 1.6102 | -0.3481 | |||
| PAGS / PagSeguro Digital Ltd. | 0.26 | -32.73 | 7.76 | 7.21 | 1.5349 | 1.5349 | |||
| NTRS / Northern Trust Corporation | 0.09 | -0.86 | 7.70 | 7.22 | 1.5238 | -0.1343 | |||
| CVX / Chevron Corporation | 0.06 | 0.00 | 6.95 | 13.23 | 1.3750 | -0.0418 | |||
| T / AT&T Inc. | 0.22 | 0.00 | 6.87 | 9.89 | 1.3586 | -0.0839 | |||
| WTS / Watts Water Technologies, Inc. | 0.07 | -12.97 | 5.58 | 9.01 | 1.1034 | 1.1034 | |||
| INTC / Intel Corporation | 0.09 | -3.34 | 4.95 | 10.59 | 0.9788 | -0.0538 | |||
| WBA / Walgreens Boots Alliance, Inc. | 0.08 | 0.00 | 4.87 | -7.39 | 0.9638 | -0.2505 | |||
| MO / Altria Group, Inc. | 0.08 | 0.00 | 4.67 | 16.30 | 0.9246 | -0.0030 | |||
| WMS / Advanced Drainage Systems, Inc. | 0.17 | -20.97 | 4.32 | -16.03 | 0.8552 | 0.8552 | |||
| RPD / Rapid7, Inc. | 0.08 | -40.00 | 3.84 | -2.57 | 0.7588 | 0.7588 | |||
| SFM / Sprouts Farmers Market, Inc. | 0.17 | -39.00 | 3.70 | -44.11 | 0.7325 | -0.7965 | |||
| CCL / Carnival Corporation & plc | 0.07 | 0.00 | 3.70 | 2.89 | 0.7319 | -0.0980 | |||
| NVTA / Invitae Corporation | 0.14 | -56.69 | 3.24 | -8.29 | 0.6409 | 0.6409 | |||
| SPY / SPDR S&P 500 ETF | 0.01 | 27.42 | 2.97 | 43.99 | 0.5873 | 0.1114 | |||
| AAPL / Apple Inc. | 0.02 | -11.72 | 2.96 | 6.28 | 0.5857 | -0.0573 | |||
| UI / Ubiquiti Inc. | 0.02 | -52.07 | 2.62 | -27.81 | 0.5181 | -0.3193 | |||
| EDU / New Oriental Education & Technology Group Inc. - Depositary Receipt (Common Stock) | 0.03 | -0.38 | 2.37 | 63.72 | 0.4686 | 0.4686 | |||
| AMZN / Amazon.com, Inc. | 0.00 | -16.45 | 2.26 | -0.92 | 0.4475 | -0.0794 | |||
| V / Visa Inc. | 0.01 | -5.67 | 2.10 | 11.68 | 0.4162 | -0.0186 | |||
| NTES / NetEase, Inc. - Depositary Receipt (Common Stock) | 0.01 | 3.80 | 1.98 | 6.51 | 0.3917 | 0.3917 | |||
| BIDU / Baidu, Inc. - Depositary Receipt (Common Stock) | 0.01 | -1.68 | 1.93 | 2.23 | 0.3816 | -0.0539 | |||
| GOOG / Alphabet Inc. | 0.00 | -16.46 | 1.67 | -5.39 | 0.3298 | -0.0769 | |||
| META / Meta Platforms, Inc. | 0.01 | -18.85 | 1.60 | 3.16 | 0.3165 | -0.0415 | |||
| GOOGL / Alphabet Inc. | 0.00 | -3.03 | 1.51 | 9.21 | 0.2979 | -0.0204 | |||
| ANTM / Anthem Inc | 0.01 | -16.48 | 1.50 | -8.71 | 0.2963 | -0.0824 | |||
| TMO / Thermo Fisher Scientific Inc. | 0.01 | -15.73 | 1.48 | 3.06 | 0.2930 | -0.0387 | |||
| JD / JD.com, Inc. - Depositary Receipt (Common Stock) | 0.05 | 0.00 | 1.37 | 44.11 | 0.2708 | 0.2708 | |||
| ORLY / O'Reilly Automotive, Inc. | 0.00 | -16.96 | 1.27 | -6.32 | 0.2520 | -0.0619 | |||
| ACN / Accenture plc | 0.01 | 1.27 | 0.2504 | 0.2504 | |||||
| PYPL / PayPal Holdings, Inc. | 0.01 | -16.61 | 1.25 | 2.98 | 0.2465 | -0.0328 | |||
| ISRG / Intuitive Surgical, Inc. | 0.00 | -16.26 | 1.18 | -0.25 | 0.2324 | -0.0394 | |||
| ROST / Ross Stores, Inc. | 0.01 | -3.65 | 1.16 | 7.74 | 0.2285 | -0.0189 | |||
| INTU / Intuit Inc. | 0.00 | -16.51 | 1.15 | 10.90 | 0.2275 | -0.0118 | |||
| HON / Honeywell International Inc. | 0.01 | -16.42 | 1.15 | 0.52 | 0.2273 | -0.0365 | |||
| FISV / Fiserv, Inc. | 0.01 | 8.09 | 1.13 | 29.93 | 0.2241 | 0.0229 | |||
| ULTA / Ulta Beauty, Inc. | 0.00 | -23.73 | 1.10 | 8.61 | 0.2172 | -0.0161 | |||
| COST / Costco Wholesale Corporation | 0.00 | -28.22 | 1.05 | -14.67 | 0.2083 | -0.0765 | |||
| AMGN / Amgen Inc. | 0.01 | -23.46 | 1.03 | -25.32 | 0.2047 | -0.1151 | |||
| EQIX / Equinix, Inc. | 0.00 | -16.61 | 1.02 | 7.23 | 0.2026 | -0.0178 | |||
| MAS / Masco Corporation | 0.03 | 9.96 | 1.01 | 47.81 | 0.2000 | 0.0421 | |||
| IDXX / IDEXX Laboratories, Inc. | 0.00 | -16.73 | 0.99 | 0.10 | 0.1960 | 0.1960 | |||
| ALL / The Allstate Corporation | 0.01 | -15.65 | 0.98 | -3.93 | 0.1937 | -0.0415 | |||
| CTAS / Cintas Corporation | 0.00 | 90.40 | 0.96 | 129.05 | 0.1903 | 0.0934 | |||
| LH / Labcorp Holdings Inc. | 0.01 | -16.48 | 0.92 | 1.10 | 0.1824 | -0.0281 | |||
| EOG / EOG Resources, Inc. | 0.01 | -25.73 | 0.92 | -18.94 | 0.1820 | -0.0800 | |||
| UPS / United Parcel Service, Inc. | 0.01 | -16.62 | 0.90 | -4.44 | 0.1786 | -0.0395 | |||
| / Sina Corp. | 0.01 | -5.19 | 0.86 | 4.72 | 0.1711 | -0.0195 | |||
| SYK / Stryker Corporation | 0.00 | 184.31 | 0.86 | 257.92 | 0.1699 | 0.1145 | |||
| NKE / NIKE, Inc. | 0.01 | -16.64 | 0.86 | -5.41 | 0.1693 | -0.0395 | |||
| BKNG / Booking Holdings Inc. | 0.00 | -15.52 | 0.85 | -14.41 | 0.1691 | -0.0614 | |||
| SPG / Simon Property Group, Inc. | 0.00 | -15.50 | 0.81 | -8.44 | 0.1610 | -0.0442 | |||
| SPGI / S&P Global Inc. | 0.00 | -16.55 | 0.79 | 3.29 | 0.1553 | -0.0201 | |||
| STZ / Constellation Brands, Inc. | 0.00 | -16.54 | 0.74 | -9.06 | 0.1470 | 0.1470 | |||
| MMC / Marsh & McLennan Companies, Inc. | 0.01 | -16.72 | 0.74 | -1.99 | 0.1462 | -0.0278 | |||
| NDAQ / Nasdaq, Inc. | 0.01 | -16.50 | 0.73 | -10.48 | 0.1436 | -0.0436 | |||
| ROP / Roper Technologies, Inc. | 0.00 | 11.58 | 0.72 | 43.28 | 0.1434 | 0.0266 | |||
| EA / Electronic Arts Inc. | 0.01 | -16.61 | 0.69 | 7.43 | 0.1373 | -0.0118 | |||
| PEP / PepsiCo, Inc. | 0.01 | -16.74 | 0.68 | -7.65 | 0.1337 | -0.0352 | |||
| DOW / Dow Inc. | 0.01 | -16.68 | 0.67 | -16.96 | 0.1327 | -0.0537 | |||
| URTH / iShares, Inc. - iShares MSCI World ETF | 0.01 | 241.82 | 0.67 | 283.91 | 0.1321 | 0.0920 | |||
| SBUX / Starbucks Corporation | 0.01 | -16.76 | 0.64 | -3.89 | 0.1270 | -0.0272 | |||
| PPG / PPG Industries, Inc. | 0.01 | -16.54 | 0.61 | -7.93 | 0.1217 | -0.0325 | |||
| YUM / Yum! Brands, Inc. | 0.01 | -16.76 | 0.60 | -9.57 | 0.1197 | -0.0347 | |||
| PNC / The PNC Financial Services Group, Inc. | 0.00 | -16.87 | 0.59 | -12.81 | 0.1171 | -0.0396 | |||
| YUMC / Yum China Holdings, Inc. | 0.01 | 14.71 | 0.53 | 53.51 | 0.1039 | 0.0249 | |||
| BAC / Bank of America Corporation | 0.02 | -26.35 | 0.50 | -17.55 | 0.0985 | -0.0409 | |||
| KO / The Coca-Cola Company | 0.01 | -16.60 | 0.49 | -17.46 | 0.0963 | -0.0398 | |||
| FRC / First Republic Bank | 0.00 | -16.50 | 0.42 | -3.47 | 0.0825 | -0.0172 | |||
| SHW / The Sherwin-Williams Company | 0.00 | -16.82 | 0.38 | -9.03 | 0.0758 | -0.0214 | |||
| WFC / Wells Fargo & Company | 0.01 | 0.37 | 0.0728 | 0.0728 | |||||
| PFE / Pfizer Inc. | 0.01 | -14.67 | 0.36 | -16.82 | 0.0714 | -0.0288 | |||
| MA / Mastercard Incorporated | 0.00 | -6.88 | 0.35 | 16.23 | 0.0694 | 0.0694 | |||
| VZ / Verizon Communications Inc. | 0.01 | 548.86 | 0.34 | 589.80 | 0.0669 | 0.0556 | |||
| PKG / Packaging Corporation of America | 0.00 | -16.67 | 0.32 | -0.62 | 0.0629 | 0.0629 | |||
| WMT / Walmart Inc. | 0.00 | 570.83 | 0.31 | 597.78 | 0.0621 | 0.0517 | |||
| IBN / ICICI Bank Limited - Depositary Receipt (Common Stock) | 0.02 | 19.34 | 0.28 | 32.86 | 0.0560 | 0.0068 | |||
| MOMO / Hello Group Inc. - Depositary Receipt (Common Stock) | 0.01 | 0.00 | 0.27 | 61.45 | 0.0530 | 0.0530 | |||
| EXC / Exelon Corporation | 0.01 | -21.15 | 0.25 | -12.41 | 0.0502 | -0.0167 | |||
| MRK / Merck & Co., Inc. | 0.00 | 0.25 | 0.0502 | 0.0502 | |||||
| PGR / The Progressive Corporation | 0.00 | -6.50 | 0.25 | 11.66 | 0.0493 | -0.0022 | |||
| BZUN / Baozun Inc. - Depositary Receipt (Common Stock) | 0.01 | 50.00 | 0.25 | 112.82 | 0.0493 | 0.0493 | |||
| BDX / Becton, Dickinson and Company | 0.00 | -7.62 | 0.24 | 2.11 | 0.0479 | 0.0479 | |||
| FIS / Fidelity National Information Services, Inc. | 0.00 | -18.01 | 0.24 | -9.70 | 0.0479 | -0.0140 | |||
| DELL / Dell Technologies Inc. | 0.00 | 66.25 | 0.23 | 609.09 | 0.0463 | 0.0426 | |||
| WM / Waste Management, Inc. | 0.00 | -20.21 | 0.23 | -6.77 | 0.0463 | -0.0116 | |||
| MSI / Motorola Solutions, Inc. | 0.00 | -11.23 | 0.23 | 8.37 | 0.0461 | -0.0035 | |||
| XOM / Exxon Mobil Corporation | 0.00 | -7.19 | 0.23 | 9.57 | 0.0453 | -0.0029 | |||
| RSG / Republic Services, Inc. | 0.00 | -20.40 | 0.23 | -11.02 | 0.0447 | -0.0139 | |||
| AFL / Aflac Incorporated | 0.00 | -18.77 | 0.22 | -11.02 | 0.0431 | -0.0134 | |||
| MU / Micron Technology, Inc. | 0.01 | -6.63 | 0.21 | 21.47 | 0.0425 | 0.0017 | |||
| TRV / The Travelers Companies, Inc. | 0.00 | -10.80 | 0.21 | 1.90 | 0.0425 | -0.0062 | |||
| AGNC / AGNC Investment Corp. | 0.01 | -6.92 | 0.21 | -4.63 | 0.0408 | 0.0408 | |||
| GL / Globe Life Inc. | 0.00 | -11.43 | 0.20 | -2.87 | 0.0402 | -0.0081 | |||
| PSX / Phillips 66 | 0.00 | -7.49 | 0.20 | 2.04 | 0.0396 | -0.0057 | |||
| NLY / Annaly Capital Management, Inc. | 0.02 | -6.83 | 0.20 | -5.24 | 0.0394 | 0.0394 | |||
| ARW / Arrow Electronics, Inc. | 0.00 | -7.30 | 0.20 | 3.70 | 0.0388 | 0.0388 | |||
| JKHY / Jack Henry & Associates, Inc. | 0.00 | -7.38 | 0.19 | 1.06 | 0.0378 | -0.0058 | |||
| IXN / iShares Trust - iShares Global Tech ETF | 0.00 | 296.43 | 0.19 | 375.00 | 0.0376 | 0.0376 | |||
| HUM / Humana Inc. | 0.00 | -7.79 | 0.19 | -14.48 | 0.0374 | 0.0374 | |||
| HPQ / HP Inc. | 0.01 | -6.97 | 0.19 | -11.68 | 0.0374 | -0.0120 | |||
| HFC / HollyFrontier Corp | 0.00 | 5.29 | 0.19 | 1.09 | 0.0368 | -0.0057 | |||
| DEM / WisdomTree Trust - WisdomTree Emerging Markets High Dividend Fund | 0.00 | 5.97 | 0.18 | 15.48 | 0.0354 | 0.0354 | |||
| DAL / Delta Air Lines, Inc. | 0.00 | -2.25 | 0.18 | 1.13 | 0.0354 | -0.0054 | |||
| MPC / Marathon Petroleum Corporation | 0.00 | -7.24 | 0.18 | -5.88 | 0.0348 | -0.0083 | |||
| UAL / United Airlines Holdings, Inc. | 0.00 | -17.42 | 0.17 | -21.27 | 0.0344 | -0.0166 | |||
| KR / The Kroger Co. | 0.01 | -17.42 | 0.17 | -26.29 | 0.0338 | -0.0197 | |||
| LUV / Southwest Airlines Co. | 0.00 | -7.16 | 0.16 | 3.21 | 0.0318 | -0.0042 | |||
| CE / Celanese Corporation | 0.00 | -7.51 | 0.16 | 1.28 | 0.0313 | -0.0047 | |||
| LEA / Lear Corporation | 0.00 | -7.20 | 0.16 | 1.95 | 0.0311 | 0.0311 | |||
| TGT / Target Corporation | 0.00 | -10.85 | 0.15 | 8.57 | 0.0301 | -0.0022 | |||
| HDB / HDFC Bank Limited - Depositary Receipt (Common Stock) | 0.00 | 30.00 | 0.15 | 45.19 | 0.0299 | 0.0059 | |||
| NTAP / NetApp, Inc. | 0.00 | -7.31 | 0.14 | 7.63 | 0.0279 | -0.0023 | |||
| ABT / Abbott Laboratories | 0.00 | 0.14 | 0.0279 | 0.0279 | |||||
| CNC / Centene Corporation | 0.00 | 0.14 | 0.0277 | 0.0277 | |||||
| LHX / L3Harris Technologies, Inc. | 0.00 | -7.53 | 0.14 | 9.60 | 0.0271 | -0.0017 | |||
| HPE / Hewlett Packard Enterprise Company | 0.01 | -29.94 | 0.14 | -17.96 | 0.0271 | -0.0114 | |||
| PXH / Invesco Exchange-Traded Fund Trust II - Invesco RAFI Emerging Markets ETF | 0.01 | 4.19 | 0.13 | 12.71 | 0.0263 | 0.0263 | |||
| SYY / Sysco Corporation | 0.00 | -9.72 | 0.13 | -3.70 | 0.0257 | -0.0054 | |||
| EEMV / iShares, Inc. - iShares MSCI Emerging Markets Min Vol Factor ETF | 0.00 | 0.13 | 0.0257 | 0.0257 | |||||
| IXJ / iShares Trust - iShares Global Healthcare ETF | 0.00 | -39.83 | 0.13 | -35.35 | 0.0253 | 0.0253 | |||
| FOX / Fox Corporation | 0.00 | 0.13 | 0.0251 | 0.0251 | |||||
| RXI / iShares Trust - iShares Global Consumer Discretionary ETF | 0.00 | 336.00 | 0.12 | 392.00 | 0.0243 | 0.0243 | |||
| VLO / Valero Energy Corporation | 0.00 | -46.22 | 0.12 | -38.83 | 0.0227 | -0.0206 | |||
| AZO / AutoZone, Inc. | 0.00 | 0.11 | 0.0224 | 0.0224 | |||||
| TMUS / T-Mobile US, Inc. | 0.00 | -7.69 | 0.10 | 1.01 | 0.0198 | -0.0031 | |||
| RGA / Reinsurance Group of America, Incorporated | 0.00 | -7.14 | 0.09 | -6.12 | 0.0182 | 0.0182 | |||
| SYF / Synchrony Financial | 0.00 | -7.24 | 0.09 | 26.47 | 0.0170 | 0.0013 | |||
| AXP / American Express Company | 0.00 | 0.08 | 0.0164 | 0.0164 | |||||
| IQV / IQVIA Holdings Inc. | 0.00 | -16.50 | 0.07 | 4.29 | 0.0144 | -0.0017 | |||
| EWJ / iShares, Inc. - iShares MSCI Japan ETF | 0.00 | 0.07 | 0.0136 | 0.0136 | |||||
| DFS / Discover Financial Services | 0.00 | -7.92 | 0.07 | 10.00 | 0.0131 | -0.0008 | |||
| EPP / iShares, Inc. - iShares MSCI Pacific ex Japan ETF | 0.00 | 129.03 | 0.07 | 160.00 | 0.0129 | 0.0129 | |||
| ECL / Ecolab Inc. | 0.00 | -5.26 | 0.06 | 14.29 | 0.0127 | -0.0003 | |||
| FNF / Fidelity National Financial, Inc. | 0.00 | -7.06 | 0.06 | 9.43 | 0.0115 | 0.0115 | |||
| KSS / Kohl's Corporation | 0.00 | -18.81 | 0.06 | -16.42 | 0.0111 | -0.0044 | |||
| IXG / iShares Trust - iShares Global Financials ETF | 0.00 | 26.09 | 0.05 | 38.46 | 0.0107 | 0.0107 | |||
| CCEP / Coca-Cola Europacific Partners PLC | 0.00 | 0.05 | 0.0095 | 0.0095 | |||||
| CDW / CDW Corporation | 0.00 | 0.05 | 0.0093 | 0.0093 | |||||
| ELS / Equity LifeStyle Properties, Inc. | 0.00 | 17.14 | 0.05 | 38.24 | 0.0093 | 0.0093 | |||
| ALV / Autoliv, Inc. | 0.00 | 14.29 | 0.05 | 20.51 | 0.0093 | 0.0093 | |||
| AMT / American Tower Corporation | 0.00 | 21.05 | 0.04 | 50.00 | 0.0089 | 0.0020 | |||
| PSA / Public Storage | 0.00 | 25.00 | 0.04 | 37.50 | 0.0087 | 0.0013 | |||
| DEI / Douglas Emmett, Inc. | 0.00 | 311.54 | 0.04 | 377.78 | 0.0085 | 0.0085 | |||
| TSS / Total System Services, Inc. | 0.00 | -4.26 | 0.04 | 13.16 | 0.0085 | -0.0003 | |||
| RWO / SPDR Index Shares Funds - SPDR Dow Jones Global Real Estate ETF | 0.00 | 0.04 | 0.0079 | 0.0079 | |||||
| AVB / AvalonBay Communities, Inc. | 0.00 | 17.65 | 0.04 | 33.33 | 0.0079 | 0.0079 | |||
| DISCK / Warner Bros.Discovery Inc - Series C | 0.00 | 0.04 | 0.0077 | 0.0077 | |||||
| ABBV / AbbVie Inc. | 0.00 | 0.04 | 0.0075 | 0.0075 | |||||
| LMT / Lockheed Martin Corporation | 0.00 | 0.00 | 0.04 | 16.13 | 0.0071 | -0.0000 | |||
| PSB / PS Business Parks, Inc. | 0.00 | 29.41 | 0.04 | 59.09 | 0.0069 | 0.0018 | |||
| HIW / Highwoods Properties, Inc. | 0.00 | 47.92 | 0.03 | 73.68 | 0.0065 | 0.0065 | |||
| DLR / Digital Realty Trust, Inc. | 0.00 | 22.73 | 0.03 | 39.13 | 0.0063 | 0.0063 | |||
| ROIC / Retail Opportunity Investments Corp. | 0.00 | 24.66 | 0.03 | 39.13 | 0.0063 | 0.0010 | |||
| AVGO / Broadcom Inc. | 0.00 | 0.03 | 0.0059 | 0.0059 | |||||
| EXR / Extra Space Storage Inc. | 0.00 | 27.27 | 0.03 | 45.00 | 0.0057 | 0.0057 | |||
| NHI / National Health Investors, Inc. | 0.00 | 23.33 | 0.03 | 26.09 | 0.0057 | 0.0057 | |||
| ADC / Agree Realty Corporation | 0.00 | 23.53 | 0.03 | 45.00 | 0.0057 | 0.0057 | |||
| CME / CME Group Inc. | 0.00 | 0.00 | 0.03 | -12.50 | 0.0055 | 0.0055 | |||
| EGP / EastGroup Properties, Inc. | 0.00 | 33.33 | 0.03 | 58.82 | 0.0053 | 0.0053 | |||
| HCC / Warrior Met Coal, Inc. | 0.00 | 200.00 | 0.02 | 228.57 | 0.0045 | 0.0029 | |||
| BAX / Baxter International Inc. | 0.00 | -9.68 | 0.02 | 15.00 | 0.0045 | 0.0045 | |||
| SKT / Tanger Inc. | 0.00 | 28.40 | 0.02 | 37.50 | 0.0044 | 0.0044 | |||
| HCA / HCA Healthcare, Inc. | 0.00 | 0.00 | 0.02 | 4.76 | 0.0044 | 0.0044 | |||
| GM / General Motors Company | 0.00 | -92.89 | 0.02 | -91.91 | 0.0038 | -0.0505 | |||
| DTE / DTE Energy Company | 0.00 | 0.00 | 0.02 | 13.33 | 0.0034 | 0.0034 | |||
| ED / Consolidated Edison, Inc. | 0.00 | 0.00 | 0.02 | 6.67 | 0.0032 | -0.0003 | |||
| VFINX / Vanguard Index Funds - Vanguard Index Trust 500 Index Fund | 0.00 | 0.00 | 0.02 | 14.29 | 0.0032 | 0.0032 | |||
| ADM / Archer-Daniels-Midland Company | 0.00 | 0.00 | 0.02 | 0.00 | 0.0032 | -0.0005 | |||
| STOR / Store Capital Corp | 0.00 | 35.48 | 0.01 | 55.56 | 0.0028 | 0.0028 | |||
| FDC / First Data Corporation | 0.00 | -16.92 | 0.01 | 27.27 | 0.0028 | 0.0028 | |||
| MXI / iShares Trust - iShares Global Materials ETF | 0.00 | -82.81 | 0.01 | -80.82 | 0.0028 | 0.0028 | |||
| LLL / JX Luxventure Limited | 0.00 | 0.00 | 0.01 | 16.67 | 0.0028 | -0.0000 | |||
| EZU / iShares, Inc. - iShares MSCI Eurozone ETF | 0.00 | 0.01 | 0.0028 | 0.0028 | |||||
| ALLY / Ally Financial Inc. | 0.00 | 0.00 | 0.01 | 18.18 | 0.0026 | 0.0026 | |||
| MNR / Mach Natural Resources LP | 0.00 | 39.73 | 0.01 | 44.44 | 0.0026 | 0.0026 | |||
| GLPI / Gaming and Leisure Properties, Inc. | 0.00 | 72.22 | 0.01 | 100.00 | 0.0024 | 0.0024 | |||
| LDOS / Leidos Holdings, Inc. | 0.00 | 0.00 | 0.01 | 20.00 | 0.0024 | 0.0001 | |||
| WU / The Western Union Company | 0.00 | 0.00 | 0.01 | 9.09 | 0.0024 | -0.0002 | |||
| PHM / PulteGroup, Inc. | 0.00 | 0.01 | 0.0022 | 0.0022 | |||||
| VIAB / Viacom, Inc. | 0.00 | 0.00 | 0.01 | 10.00 | 0.0022 | -0.0001 | |||
| HRB / H&R Block, Inc. | 0.00 | 0.01 | 0.0020 | 0.0020 | |||||
| NI / NiSource Inc. | 0.00 | -20.51 | 0.01 | -10.00 | 0.0018 | 0.0018 | |||
| NOC / Northrop Grumman Corporation | 0.00 | 0.00 | 0.01 | 14.29 | 0.0016 | -0.0000 | |||
| IBM / International Business Machines Corporation | 0.00 | -96.61 | 0.01 | -96.02 | 0.0016 | -0.0448 | |||
| M / Macy's, Inc. | 0.00 | 0.00 | 0.01 | -20.00 | 0.0016 | -0.0007 | |||
| XEL / Xcel Energy Inc. | 0.00 | 0.00 | 0.01 | 16.67 | 0.0014 | 0.0014 | |||
| EVRG / Evergy, Inc. | 0.00 | 0.00 | 0.01 | 0.00 | 0.0010 | -0.0002 | |||
| DXC / DXC Technology Company | 0.00 | -97.55 | 0.01 | -96.71 | 0.0010 | -0.0341 | |||
| VGK / Vanguard International Equity Index Funds - Vanguard FTSE Europe ETF | 0.00 | 0.00 | 0.01 | 25.00 | 0.0010 | 0.0010 | |||
| BG / Bunge Global SA | 0.00 | -52.94 | 0.00 | -55.56 | 0.0008 | 0.0008 | |||
| DIS / The Walt Disney Company | 0.00 | 0.00 | 0.0004 | 0.0004 | |||||
| IEMG / iShares, Inc. - iShares Core MSCI Emerging Markets ETF | 0.00 | -100.00 | 0.00 | -100.00 | 0.0000 | 0.0000 | |||
| WBC / Wabco Holdings, Inc. | 0.00 | -100.00 | 0.00 | -100.00 | 0.0000 | 0.0000 | |||
| BMO / Bank of Montreal | 0.00 | -100.00 | 0.00 | -100.00 | 0.0000 | 0.0000 | |||
| LTC / LTC Properties, Inc. | 0.00 | -100.00 | 0.00 | -100.00 | 0.0000 | 0.0000 | |||
| EPR / EPR Properties | 0.00 | -100.00 | 0.00 | -100.00 | 0.0000 | 0.0000 | |||
| CM / Canadian Imperial Bank of Commerce | 0.00 | -100.00 | 0.00 | -100.00 | 0.0000 | 0.0000 | |||
| ACC / American Campus Communities Inc. | 0.00 | -100.00 | 0.00 | -100.00 | 0.0000 | 0.0000 | |||
| BBY / Best Buy Co., Inc. | 0.00 | -100.00 | 0.00 | -100.00 | 0.0000 | 0.0000 | |||
| SEIC / SEI Investments Company | 0.00 | -100.00 | 0.00 | -100.00 | 0.0000 | 0.0000 | |||
| MX / Magnachip Semiconductor Corporation | 0.00 | -100.00 | 0.00 | -100.00 | 0.0000 | 0.0000 | |||
| AER / AerCap Holdings N.V. | 0.00 | -100.00 | 0.00 | -100.00 | 0.0000 | 0.0000 | |||
| TEL / TE Connectivity plc | 0.00 | -100.00 | 0.00 | -100.00 | -0.0312 | ||||
| RHT / Red Hat, Inc. | 0.00 | -100.00 | 0.00 | -100.00 | -0.2100 | ||||
| O / Realty Income Corporation | 0.00 | -100.00 | 0.00 | -100.00 | -0.0067 | ||||
| GIB / CGI Inc. | 0.00 | -100.00 | 0.00 | -100.00 | -0.0455 | ||||
| TECK.B / Teck Resources Limited | 0.00 | -100.00 | 0.00 | -100.00 | 0.0000 | 0.0000 | |||
| LYB / LyondellBasell Industries N.V. | 0.00 | -100.00 | 0.00 | -100.00 | -0.0473 | ||||
| STX / Seagate Technology Holdings plc | 0.00 | -100.00 | 0.00 | -100.00 | 0.0000 | 0.0000 | |||
| BPR / Brookfield Property REIT Inc. | 0.00 | -100.00 | 0.00 | -100.00 | 0.0000 | 0.0000 | |||
| HAL / Halliburton Company | 0.00 | -100.00 | 0.00 | -100.00 | -0.0561 | ||||
| BCE / BCE Inc. | 0.00 | -100.00 | 0.00 | -100.00 | 0.0000 | 0.0000 | |||
| SPXL / Direxion Shares ETF Trust - Direxion Daily S&P 500 Bull 3X Shares | 0.00 | -100.00 | 0.00 | -100.00 | 0.0000 | 0.0000 | |||
| CVS / CVS Health Corporation | 0.00 | -100.00 | 0.00 | -100.00 | -0.0069 | ||||
| C / Citigroup Inc. | 0.00 | -100.00 | 0.00 | -100.00 | -0.0411 | ||||
| MFC / HEXAOM | 0.00 | -100.00 | 0.00 | -100.00 | 0.0000 | 0.0000 | |||
| TSN / Tyson Foods, Inc. | 0.00 | -100.00 | 0.00 | -100.00 | -0.0030 | ||||
| JXI / iShares Trust - iShares Global Utilities ETF | 0.00 | -100.00 | 0.00 | -100.00 | 0.0000 | 0.0000 | |||
| REZI / Resideo Technologies, Inc. | 0.00 | -100.00 | 0.00 | -100.00 | 0.0000 | 0.0000 | |||
| US2782651036 / Eaton Vance Corp. | 0.00 | -100.00 | 0.00 | -100.00 | 0.0000 | 0.0000 | |||
| DOC / Healthpeak Properties, Inc. | 0.00 | -100.00 | 0.00 | -100.00 | 0.0000 | 0.0000 | |||
| IXC / iShares Trust - iShares Global Energy ETF | 0.00 | -100.00 | 0.00 | -100.00 | 0.0000 | 0.0000 | |||
| CLH / Clean Harbors, Inc. | 0.00 | -100.00 | 0.00 | -100.00 | 0.0000 | 0.0000 | |||
| TRP / TC Energy Corporation | 0.00 | -100.00 | 0.00 | -100.00 | 0.0000 | 0.0000 | |||
| CELG / Celgene Corp. | 0.00 | -100.00 | 0.00 | -100.00 | -0.2301 | ||||
| INFY / Infosys Limited - Depositary Receipt (Common Stock) | 0.00 | -100.00 | 0.00 | -100.00 | -0.0233 | ||||
| KRC / Kilroy Realty Corporation | 0.00 | -100.00 | 0.00 | -100.00 | 0.0000 | 0.0000 |