Statistik Asas
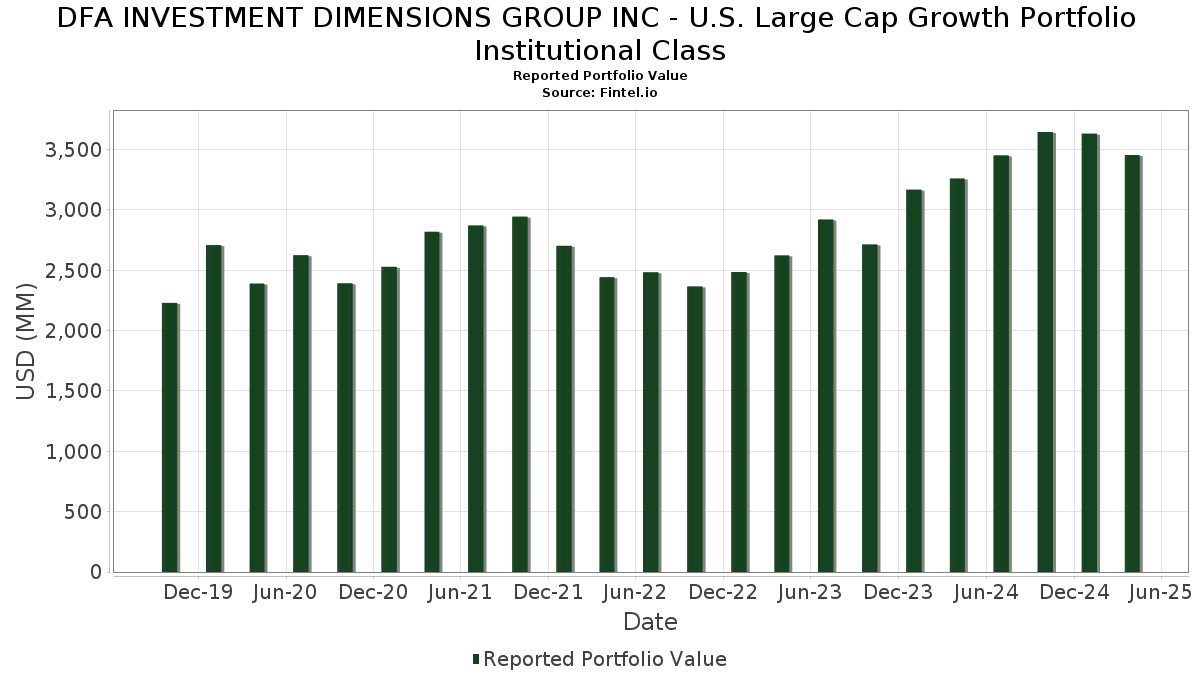
| Nilai Portfolio | $ 3,455,222,682 |
| Kedudukan Semasa | 112 |
Pegangan Terkini, Prestasi, AUM (dari 13F, 13D)
DFA INVESTMENT DIMENSIONS GROUP INC - U.S. Large Cap Growth Portfolio Institutional Class telah mendedahkan 112 jumlah pegangan dalam pemfailan SEC terkini mereka. Nilai portfolio terkini dikira sebagai $ 3,455,222,682 USD. Aset Sebenar Di Bawah Pengurusan (AUM) ialah nilai ini ditambah dengan tunai (yang tidak didedahkan). Pegangan teratas DFA INVESTMENT DIMENSIONS GROUP INC - U.S. Large Cap Growth Portfolio Institutional Class ialah Apple Inc. (US:AAPL) , NVIDIA Corporation (US:NVDA) , Microsoft Corporation (US:MSFT) , Eli Lilly and Company (US:LLY) , and Mastercard Incorporated (US:MA) . Kedudukan baharu DFA INVESTMENT DIMENSIONS GROUP INC - U.S. Large Cap Growth Portfolio Institutional Class termasuk Walmart Inc. (US:WMT) , Tapestry, Inc. (US:TPR) , .
Kenaikan Teratas Suku Tahun Ini
Kami menggunakan perubahan dalam peruntukan portfolio kerana ini adalah metrik yang paling bermakna. Perubahan boleh disebabkan oleh perdagangan atau perubahan dalam harga saham.
| Sekuriti | Saham (MM) |
Nilai (MM$) |
Portfolio % | ΔPortfolio % |
|---|---|---|---|---|
| 1.02 | 215.89 | 6.3099 | 1.3611 | |
| 0.16 | 38.84 | 1.1353 | 1.0090 | |
| 28.21 | 28.21 | 0.8244 | 0.8244 | |
| 0.47 | 187.45 | 5.4785 | 0.7427 | |
| 0.19 | 174.12 | 5.0889 | 0.4992 | |
| 0.70 | 136.73 | 3.9961 | 0.4426 | |
| 0.14 | 13.97 | 0.4084 | 0.4084 | |
| 0.89 | 64.31 | 1.8796 | 0.3216 | |
| 0.16 | 17.28 | 0.5050 | 0.2702 | |
| 0.43 | 70.01 | 2.0460 | 0.2399 |
Penurunan Teratas Suku Tahun Ini
Kami menggunakan perubahan dalam peruntukan portfolio kerana ini adalah metrik yang paling bermakna. Perubahan boleh disebabkan oleh perdagangan atau perubahan dalam harga saham.
| Sekuriti | Saham (MM) |
Nilai (MM$) |
Portfolio % | ΔPortfolio % |
|---|---|---|---|---|
| 0.37 | 67.65 | 1.9771 | -1.8857 | |
| 0.26 | 144.08 | 4.2109 | -0.9946 | |
| 0.08 | 26.22 | 0.7663 | -0.9474 | |
| 1.72 | 187.76 | 5.4877 | -0.7440 | |
| 0.38 | 136.54 | 3.9907 | -0.3805 | |
| 0.04 | 20.70 | 0.6050 | -0.3683 | |
| 0.63 | 88.10 | 2.5749 | -0.3607 | |
| 0.13 | 33.75 | 0.9863 | -0.2906 | |
| 0.15 | 20.84 | 0.6092 | -0.2613 | |
| 0.47 | 161.43 | 4.7182 | -0.2389 |
13F dan Pemfailan Dana
Borang ini telah difailkan pada 2025-06-26 untuk tempoh pelaporan 2025-04-30. Klik ikon pautan untuk melihat sejarah transaksi penuh.
Tingkatkan untuk membuka data premium dan eksport ke Excel ![]() .
.
| Sekuriti | Jenis | Purata Harga Saham | Saham (MM) |
ΔSaham (%) |
ΔSaham (%) |
Nilai ($MM) |
Portfolio (%) |
ΔPortfolio (%) |
|
|---|---|---|---|---|---|---|---|---|---|
| AAPL / Apple Inc. | 1.02 | 33.59 | 215.89 | 20.29 | 6.3099 | 1.3611 | |||
| NVDA / NVIDIA Corporation | 1.72 | -8.42 | 187.76 | -16.92 | 5.4877 | -0.7440 | |||
| MSFT / Microsoft Corporation | 0.47 | 14.60 | 187.45 | 9.13 | 5.4785 | 0.7427 | |||
| LLY / Eli Lilly and Company | 0.19 | -5.63 | 174.12 | 4.60 | 5.0889 | 0.4992 | |||
| MA / Mastercard Incorporated | 0.30 | -1.48 | 166.53 | -2.78 | 4.8672 | 0.1441 | |||
| V / Visa Inc. | 0.47 | -11.17 | 161.43 | -10.21 | 4.7182 | -0.2389 | |||
| META / Meta Platforms, Inc. | 0.26 | -4.20 | 144.08 | -23.69 | 4.2109 | -0.9946 | |||
| ABBV / AbbVie Inc. | 0.70 | 0.00 | 136.73 | 6.09 | 3.9961 | 0.4426 | |||
| HD / The Home Depot, Inc. | 0.38 | -1.57 | 136.54 | -13.87 | 3.9907 | -0.3805 | |||
| COST / Costco Wholesale Corporation | 0.10 | -0.37 | 99.48 | 1.11 | 2.9076 | 0.1948 | |||
| ORCL / Oracle Corporation | 0.63 | 0.00 | 88.10 | -17.25 | 2.5749 | -0.3607 | |||
| PG / The Procter & Gamble Company | 0.43 | 9.12 | 70.01 | 6.87 | 2.0460 | 0.2399 | |||
| AMZN / Amazon.com, Inc. | 0.37 | -37.77 | 67.65 | -51.72 | 1.9771 | -1.8857 | |||
| KO / The Coca-Cola Company | 0.89 | -0.42 | 64.31 | 13.81 | 1.8796 | 0.3216 | |||
| PEP / PepsiCo, Inc. | 0.45 | -3.74 | 61.12 | -13.39 | 1.7863 | -0.1595 | |||
| AMGN / Amgen Inc. | 0.19 | 0.00 | 55.32 | 1.93 | 1.6169 | 0.1204 | |||
| TJX / The TJX Companies, Inc. | 0.42 | 0.00 | 53.81 | 3.12 | 1.5727 | 0.1339 | |||
| COR / Cencora, Inc. | 0.15 | 0.00 | 44.91 | 15.13 | 1.3127 | 0.2370 | |||
| LMT / Lockheed Martin Corporation | 0.09 | 0.00 | 41.89 | 3.20 | 1.2243 | 0.1051 | |||
| ADP / Automatic Data Processing, Inc. | 0.13 | 0.00 | 40.42 | -0.80 | 1.1814 | 0.0579 | |||
| LNG / Cheniere Energy, Inc. | 0.17 | 0.00 | 39.50 | 3.34 | 1.1546 | 0.1005 | |||
| IBM / International Business Machines Corporation | 0.16 | 796.55 | 38.84 | 747.94 | 1.1353 | 1.0090 | |||
| GWW / W.W. Grainger, Inc. | 0.04 | 0.00 | 37.19 | -3.61 | 1.0871 | 0.0231 | |||
| ADBE / Adobe Inc. | 0.10 | -4.62 | 35.84 | -18.24 | 1.0474 | -0.1611 | |||
| HON / Honeywell International Inc. | 0.17 | 0.00 | 34.98 | -5.91 | 1.0224 | -0.0027 | |||
| PAYX / Paychex, Inc. | 0.23 | 1.86 | 34.44 | 1.48 | 1.0067 | 0.0708 | |||
| KMB / Kimberly-Clark Corporation | 0.26 | -2.81 | 34.42 | -1.46 | 1.0059 | 0.0429 | |||
| APP / AppLovin Corporation | 0.13 | 0.00 | 33.75 | -27.13 | 0.9863 | -0.2906 | |||
| VRSK / Verisk Analytics, Inc. | 0.11 | 0.00 | 33.12 | 3.13 | 0.9681 | 0.0825 | |||
| SYY / Sysco Corporation | 0.45 | -3.31 | 32.27 | -5.32 | 0.9432 | 0.0034 | |||
| WM / Waste Management, Inc. | 0.14 | 0.00 | 32.09 | 5.95 | 0.9380 | 0.1028 | |||
| GVMXX / State Street Institutional Investment Trust - State Street Institutional US Govt Money Market Fnd Premier Cls | 31.24 | -10.36 | 31.24 | -10.36 | 0.9129 | -0.0478 | |||
| LRCX / Lam Research Corporation | 0.41 | 0.00 | 29.08 | -11.57 | 0.8499 | -0.0568 | |||
| VST / Vistra Corp. | 0.22 | 16.73 | 28.89 | -9.95 | 0.8443 | -0.0402 | |||
| DFA Short Term Investment Fund / STIV (000000000) | 28.21 | 28.21 | 0.8244 | 0.8244 | |||||
| KLAC / KLA Corporation | 0.04 | -8.58 | 27.41 | -12.98 | 0.8012 | -0.0674 | |||
| MMM / 3M Company | 0.19 | 10.46 | 26.74 | 0.81 | 0.7816 | 0.0502 | |||
| CAT / Caterpillar Inc. | 0.08 | -49.33 | 26.22 | -57.82 | 0.7663 | -0.9474 | |||
| UNP / Union Pacific Corporation | 0.12 | 56.22 | 25.18 | 35.97 | 0.7359 | 0.2253 | |||
| TRGP / Targa Resources Corp. | 0.14 | 16.70 | 24.16 | 1.34 | 0.7061 | 0.0488 | |||
| ITW / Illinois Tool Works Inc. | 0.10 | 0.00 | 23.00 | -7.43 | 0.6722 | -0.0128 | |||
| MSI / Motorola Solutions, Inc. | 0.05 | 0.00 | 22.88 | -6.15 | 0.6687 | -0.0035 | |||
| IT / Gartner, Inc. | 0.05 | 0.00 | 22.76 | -22.43 | 0.6651 | -0.1438 | |||
| SHW / The Sherwin-Williams Company | 0.06 | 0.00 | 21.46 | -1.46 | 0.6274 | 0.0267 | |||
| CL / Colgate-Palmolive Company | 0.23 | 0.00 | 21.46 | 6.33 | 0.6273 | 0.0708 | |||
| ZTS / Zoetis Inc. | 0.14 | 0.00 | 21.29 | -8.49 | 0.6222 | -0.0192 | |||
| ROST / Ross Stores, Inc. | 0.15 | -28.49 | 20.84 | -33.98 | 0.6092 | -0.2613 | |||
| AMP / Ameriprise Financial, Inc. | 0.04 | -32.36 | 20.70 | -41.36 | 0.6050 | -0.3683 | |||
| TSCO / Tractor Supply Company | 0.40 | 0.00 | 20.24 | -6.88 | 0.5914 | -0.0077 | |||
| NRG / NRG Energy, Inc. | 0.16 | 89.66 | 17.28 | 102.89 | 0.5050 | 0.2702 | |||
| MCO / Moody's Corporation | 0.04 | 0.00 | 16.09 | -9.28 | 0.4702 | -0.0187 | |||
| VRT / Vertiv Holdings Co | 0.19 | 9.05 | 15.87 | -20.44 | 0.4638 | -0.0861 | |||
| FTNT / Fortinet, Inc. | 0.15 | 16.63 | 15.47 | 19.96 | 0.4522 | 0.0966 | |||
| TXN / Texas Instruments Incorporated | 0.10 | -6.76 | 15.23 | -19.17 | 0.4450 | -0.0743 | |||
| CTAS / Cintas Corporation | 0.07 | 49.56 | 14.89 | 57.85 | 0.4352 | 0.1751 | |||
| BR / Broadridge Financial Solutions, Inc. | 0.06 | 0.00 | 14.56 | 1.75 | 0.4256 | 0.0310 | |||
| WMT / Walmart Inc. | 0.14 | 13.97 | 0.4084 | 0.4084 | |||||
| CDW / CDW Corporation | 0.09 | 0.00 | 13.89 | -19.37 | 0.4060 | -0.0691 | |||
| GDDY / GoDaddy Inc. | 0.07 | 7.60 | 13.70 | -4.70 | 0.4003 | 0.0040 | |||
| IDXX / IDEXX Laboratories, Inc. | 0.03 | 0.00 | 13.58 | 2.51 | 0.3970 | 0.0317 | |||
| FAST / Fastenal Company | 0.16 | -7.91 | 13.02 | 1.81 | 0.3806 | 0.0279 | |||
| NTAP / NetApp, Inc. | 0.14 | 0.00 | 12.97 | -26.49 | 0.3791 | -0.1074 | |||
| MMC / Marsh & McLennan Companies, Inc. | 0.05 | 0.00 | 11.31 | 3.96 | 0.3306 | 0.0306 | |||
| LII / Lennox International Inc. | 0.02 | 0.00 | 11.29 | -7.71 | 0.3300 | -0.0073 | |||
| ADSK / Autodesk, Inc. | 0.04 | 0.00 | 11.11 | -11.91 | 0.3246 | -0.0230 | |||
| EXPE / Expedia Group, Inc. | 0.07 | 0.00 | 11.04 | -8.20 | 0.3226 | -0.0089 | |||
| LPLA / LPL Financial Holdings Inc. | 0.03 | 7.47 | 11.03 | -6.34 | 0.3224 | -0.0023 | |||
| BA / The Boeing Company | 0.06 | 0.00 | 10.99 | 3.81 | 0.3212 | 0.0293 | |||
| ODFL / Old Dominion Freight Line, Inc. | 0.07 | -0.75 | 10.78 | -18.04 | 0.3152 | -0.0476 | |||
| TT / Trane Technologies plc | 0.03 | -4.88 | 9.75 | 0.51 | 0.2849 | 0.0175 | |||
| DRI / Darden Restaurants, Inc. | 0.05 | 15.80 | 9.17 | 19.01 | 0.2679 | 0.0555 | |||
| LVS / Las Vegas Sands Corp. | 0.25 | 0.00 | 9.06 | -19.99 | 0.2648 | -0.0474 | |||
| WSM / Williams-Sonoma, Inc. | 0.06 | 61.96 | 8.85 | 18.36 | 0.2587 | 0.0525 | |||
| WAT / Waters Corporation | 0.02 | 0.00 | 8.59 | -16.30 | 0.2512 | -0.0319 | |||
| LULU / lululemon athletica inc. | 0.03 | 1,343.68 | 8.11 | 843.77 | 0.2370 | 0.2133 | |||
| US23320U4058 / The DFA Investment Trust Company | 0.68 | 181.32 | 7.83 | 181.24 | 0.2288 | 0.1520 | |||
| CLX / The Clorox Company | 0.05 | -24.24 | 7.76 | -32.06 | 0.2267 | -0.0881 | |||
| CMG / Chipotle Mexican Grill, Inc. | 0.15 | -1.79 | 7.61 | -14.97 | 0.2224 | -0.0243 | |||
| JBL / Jabil Inc. | 0.05 | 349.81 | 7.49 | 305.91 | 0.2188 | 0.1679 | |||
| BURL / Burlington Stores, Inc. | 0.03 | 0.00 | 7.13 | -20.75 | 0.2085 | -0.0397 | |||
| AON / Aon plc | 0.02 | 23.88 | 6.97 | 18.51 | 0.2036 | 0.0415 | |||
| EQH / Equitable Holdings, Inc. | 0.14 | 0.00 | 6.79 | -9.14 | 0.1985 | -0.0076 | |||
| MO / Altria Group, Inc. | 0.11 | 0.00 | 6.48 | 13.25 | 0.1894 | 0.0316 | |||
| BAH / Booz Allen Hamilton Holding Corporation | 0.05 | 0.00 | 6.34 | -6.95 | 0.1854 | -0.0026 | |||
| LYV / Live Nation Entertainment, Inc. | 0.04 | 103.46 | 5.90 | 86.26 | 0.1724 | 0.0851 | |||
| NKE / NIKE, Inc. | 0.10 | -6.41 | 5.56 | -31.36 | 0.1625 | -0.0608 | |||
| ROL / Rollins, Inc. | 0.08 | 0.00 | 4.29 | 15.43 | 0.1255 | 0.0229 | |||
| ROK / Rockwell Automation, Inc. | 0.02 | 0.00 | 4.10 | -11.04 | 0.1199 | -0.0073 | |||
| BKNG / Booking Holdings Inc. | 0.00 | 0.00 | 3.45 | 7.65 | 0.1007 | 0.0124 | |||
| SBUX / Starbucks Corporation | 0.04 | 0.00 | 2.97 | -25.65 | 0.0869 | -0.0234 | |||
| AMAT / Applied Materials, Inc. | 0.02 | -6.46 | 2.95 | -21.86 | 0.0862 | -0.0178 | |||
| SOLV / Solventum Corporation | 0.04 | 0.00 | 2.62 | -10.70 | 0.0766 | -0.0043 | |||
| XPO / XPO, Inc. | 0.02 | -0.86 | 2.44 | -21.32 | 0.0713 | -0.0142 | |||
| RCL / Royal Caribbean Cruises Ltd. | 0.01 | 0.00 | 1.34 | -19.40 | 0.0392 | -0.0067 | |||
| VLTO / Veralto Corporation | 0.01 | 154.07 | 1.22 | 135.84 | 0.0358 | 0.0215 | |||
| DE / Deere & Company | 0.00 | 0.00 | 1.09 | -2.69 | 0.0318 | 0.0010 | |||
| POOL / Pool Corporation | 0.00 | -50.07 | 1.00 | -57.50 | 0.0292 | -0.0356 | |||
| BJ / BJ's Wholesale Club Holdings, Inc. | 0.01 | -30.42 | 0.98 | -17.48 | 0.0286 | -0.0041 | |||
| TPL / Texas Pacific Land Corporation | 0.00 | 0.00 | 0.93 | -0.64 | 0.0272 | 0.0014 | |||
| DVA / DaVita Inc. | 0.01 | 0.00 | 0.88 | -19.65 | 0.0257 | -0.0045 | |||
| LECO / Lincoln Electric Holdings, Inc. | 0.00 | 0.00 | 0.65 | -11.37 | 0.0189 | -0.0012 | |||
| FDS / FactSet Research Systems Inc. | 0.00 | 0.00 | 0.37 | -9.00 | 0.0110 | -0.0004 | |||
| BBY / Best Buy Co., Inc. | 0.00 | -6.37 | 0.29 | -27.48 | 0.0086 | -0.0026 | |||
| MANH / Manhattan Associates, Inc. | 0.00 | -79.68 | 0.18 | -82.75 | 0.0052 | -0.0233 | |||
| DECK / Deckers Outdoor Corporation | 0.00 | -94.35 | 0.14 | -96.48 | 0.0042 | -0.1086 | |||
| EXPD / Expeditors International of Washington, Inc. | 0.00 | 0.00 | 0.10 | -3.70 | 0.0031 | 0.0001 | |||
| BFA / Brown-Forman Corp. - Class A | 0.00 | 0.00 | 0.09 | 3.61 | 0.0025 | 0.0002 | |||
| HSY / The Hershey Company | 0.00 | 0.00 | 0.08 | 11.43 | 0.0023 | 0.0004 | |||
| TPR / Tapestry, Inc. | 0.00 | 0.01 | 0.0004 | 0.0004 | |||||
| MAR / Marriott International, Inc. | 0.00 | 0.00 | 0.00 | 0.0000 | -0.0000 | ||||
| EW / Edwards Lifesciences Corporation | 0.00 | 0.00 | 0.00 | 0.0000 | 0.0000 | ||||
| Future / DE (000000000) | -0.20 | -0.0057 | -0.0057 |