Statistik Asas
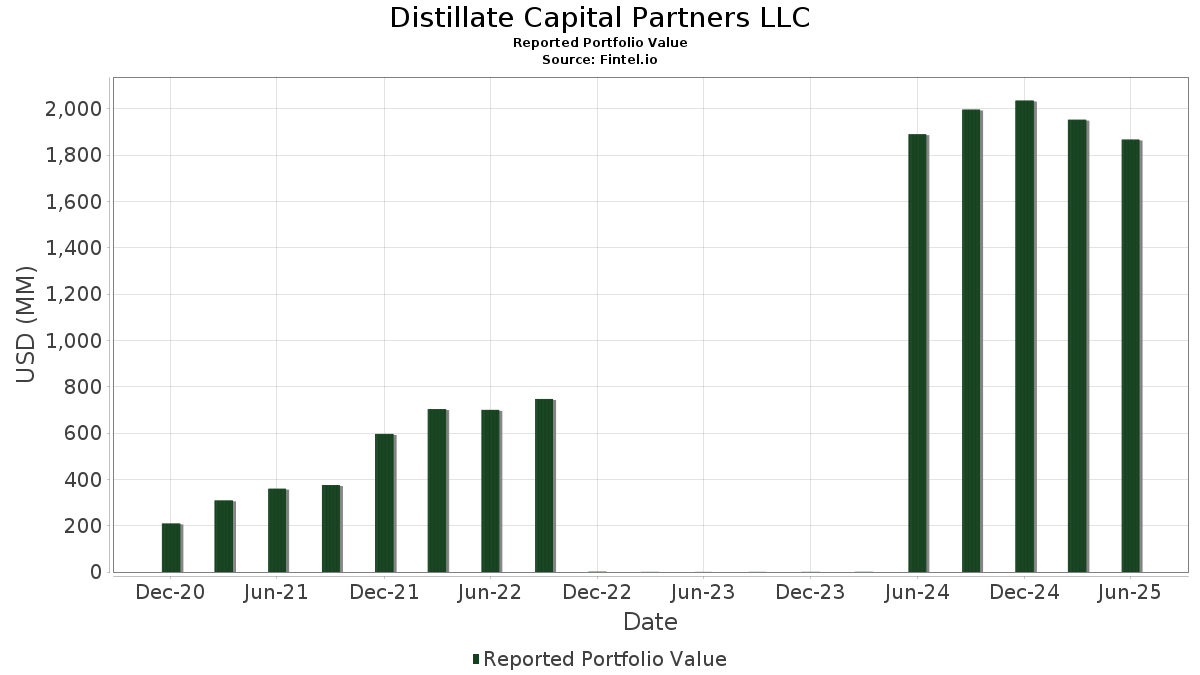
| Nilai Portfolio | $ 1,866,794,330 |
| Kedudukan Semasa | 117 |
Pegangan Terkini, Prestasi, AUM (dari 13F, 13D)
Distillate Capital Partners LLC telah mendedahkan 117 jumlah pegangan dalam pemfailan SEC terkini mereka. Nilai portfolio terkini dikira sebagai $ 1,866,794,330 USD. Aset Sebenar Di Bawah Pengurusan (AUM) ialah nilai ini ditambah dengan tunai (yang tidak didedahkan). Pegangan teratas Distillate Capital Partners LLC ialah UnitedHealth Group Incorporated (US:UNH) , Merck & Co., Inc. (US:MRK) , Johnson & Johnson (US:JNJ) , AbbVie Inc. (US:ABBV) , and T-Mobile US, Inc. (US:TMUS) . Kedudukan baharu Distillate Capital Partners LLC termasuk PepsiCo, Inc. (US:PEP) , Uber Technologies, Inc. (US:UBER) , EMCOR Group, Inc. (US:EME) , Crown Holdings, Inc. (US:CCK) , and Ralliant Corporation (US:RAL) .
Kenaikan Teratas Suku Tahun Ini
Kami menggunakan perubahan dalam peruntukan portfolio kerana ini adalah metrik yang paling bermakna. Perubahan boleh disebabkan oleh perdagangan atau perubahan dalam harga saham.
| Sekuriti | Saham (MM) |
Nilai (MM$) |
Portfolio % | ΔPortfolio % |
|---|---|---|---|---|
| 0.10 | 28.29 | 1.5154 | 1.5154 | |
| 0.09 | 25.45 | 1.3635 | 1.3635 | |
| 0.19 | 24.59 | 1.3174 | 1.3174 | |
| 0.26 | 24.02 | 1.2865 | 1.2865 | |
| 0.11 | 19.24 | 1.0306 | 1.0306 | |
| 0.10 | 16.58 | 0.8879 | 0.8879 | |
| 0.05 | 15.92 | 0.8527 | 0.8527 | |
| 0.19 | 15.39 | 0.8242 | 0.8242 | |
| 0.03 | 14.11 | 0.7559 | 0.7559 | |
| 0.11 | 14.07 | 0.7537 | 0.7537 |
Penurunan Teratas Suku Tahun Ini
Kami menggunakan perubahan dalam peruntukan portfolio kerana ini adalah metrik yang paling bermakna. Perubahan boleh disebabkan oleh perdagangan atau perubahan dalam harga saham.
| Sekuriti | Saham (MM) |
Nilai (MM$) |
Portfolio % | ΔPortfolio % |
|---|---|---|---|---|
| 0.14 | 44.84 | 2.4017 | -1.1304 | |
| 0.00 | 0.00 | -0.9672 | ||
| 0.57 | 44.75 | 2.3973 | -0.4686 | |
| 0.23 | 42.54 | 2.2790 | -0.4423 | |
| 0.03 | 14.69 | 0.7870 | -0.2351 | |
| 0.05 | 21.01 | 1.1253 | -0.1946 | |
| 0.06 | 22.56 | 1.2083 | -0.1872 | |
| 0.23 | 36.04 | 1.9304 | -0.1856 | |
| 0.11 | 11.44 | 0.6129 | -0.1793 | |
| 0.07 | 9.48 | 0.5080 | -0.1682 |
13F dan Pemfailan Dana
Borang ini telah difailkan pada 2025-08-13 untuk tempoh pelaporan 2025-06-30. Klik ikon pautan untuk melihat sejarah transaksi penuh.
Tingkatkan untuk membuka data premium dan eksport ke Excel ![]() .
.
| Sekuriti | Jenis | Purata Harga Saham | Saham (MM) |
ΔSaham (%) |
ΔSaham (%) |
Nilai ($MM) |
Portfolio (%) |
ΔPortfolio (%) |
|
|---|---|---|---|---|---|---|---|---|---|
| UNH / UnitedHealth Group Incorporated | 0.14 | 9.14 | 44.84 | -34.99 | 2.4017 | -1.1304 | |||
| MRK / Merck & Co., Inc. | 0.57 | -9.31 | 44.75 | -20.02 | 2.3973 | -0.4686 | |||
| JNJ / Johnson & Johnson | 0.28 | 0.57 | 43.32 | -7.36 | 2.3206 | -0.0745 | |||
| ABBV / AbbVie Inc. | 0.23 | -9.62 | 42.54 | -19.93 | 2.2790 | -0.4423 | |||
| TMUS / T-Mobile US, Inc. | 0.16 | 1.35 | 37.02 | -9.46 | 1.9829 | -0.1111 | |||
| PG / The Procter & Gamble Company | 0.23 | -6.70 | 36.04 | -12.78 | 1.9304 | -0.1856 | |||
| CMCSA / Comcast Corporation | 0.93 | -5.97 | 33.13 | -9.05 | 1.7747 | -0.0910 | |||
| CSCO / Cisco Systems, Inc. | 0.47 | -20.39 | 32.43 | -10.49 | 1.7373 | -0.1185 | |||
| QCOM / QUALCOMM Incorporated | 0.19 | -6.88 | 30.37 | -3.46 | 1.6269 | 0.0157 | |||
| CI / The Cigna Group | 0.09 | -5.63 | 30.16 | -5.18 | 1.6156 | -0.0134 | |||
| BKNG / Booking Holdings Inc. | 0.01 | -6.62 | 30.07 | 17.35 | 1.6107 | 0.2984 | |||
| CRM / Salesforce, Inc. | 0.10 | 28.29 | 1.5154 | 1.5154 | |||||
| AMGN / Amgen Inc. | 0.09 | 25.45 | 1.3635 | 1.3635 | |||||
| BLK / BlackRock, Inc. | 0.02 | -6.07 | 24.74 | 4.13 | 1.3254 | 0.1085 | |||
| MO / Altria Group, Inc. | 0.42 | -6.06 | 24.61 | -8.23 | 1.3182 | -0.0552 | |||
| PEP / PepsiCo, Inc. | 0.19 | 24.59 | 1.3174 | 1.3174 | |||||
| ADBE / Adobe Inc. | 0.06 | -4.79 | 24.26 | -3.95 | 1.2997 | 0.0058 | |||
| UBER / Uber Technologies, Inc. | 0.26 | 24.02 | 1.2865 | 1.2865 | |||||
| LMT / Lockheed Martin Corporation | 0.05 | -1.70 | 23.92 | 1.91 | 1.2816 | 0.0793 | |||
| PYPL / PayPal Holdings, Inc. | 0.32 | -7.92 | 23.79 | 4.88 | 1.2742 | 0.1126 | |||
| MCK / McKesson Corporation | 0.03 | -4.40 | 23.15 | 4.09 | 1.2401 | 0.1010 | |||
| ELV / Elevance Health, Inc. | 0.06 | -7.43 | 22.56 | -17.22 | 1.2083 | -0.1872 | |||
| LOW / Lowe's Companies, Inc. | 0.10 | -6.28 | 22.54 | -10.85 | 1.2074 | -0.0874 | |||
| GD / General Dynamics Corporation | 0.07 | -3.84 | 21.86 | 2.90 | 1.1707 | 0.0829 | |||
| AMAT / Applied Materials, Inc. | 0.12 | -26.17 | 21.63 | -6.86 | 1.1587 | -0.0308 | |||
| EPD / Enterprise Products Partners L.P. - Limited Partnership | 0.69 | -7.19 | 21.43 | -15.69 | 1.1477 | -0.1539 | |||
| MPC / Marathon Petroleum Corporation | 0.13 | -23.13 | 21.27 | -12.35 | 1.1395 | -0.1036 | |||
| HCA / HCA Healthcare, Inc. | 0.05 | -26.47 | 21.01 | -18.49 | 1.1253 | -0.1946 | |||
| KR / The Kroger Co. | 0.28 | -5.79 | 20.42 | -0.17 | 1.0937 | 0.0463 | |||
| LRCX / Lam Research Corporation | 0.20 | -31.84 | 19.58 | -8.75 | 1.0489 | -0.0502 | |||
| FI / Fiserv, Inc. | 0.11 | 19.24 | 1.0306 | 1.0306 | |||||
| TEL / TE Connectivity plc | 0.11 | -9.98 | 18.68 | 7.44 | 1.0008 | 0.1102 | |||
| MPLX / MPLX LP - Limited Partnership | 0.36 | -7.88 | 18.47 | -11.34 | 0.9896 | -0.0776 | |||
| ABNB / Airbnb, Inc. | 0.14 | -5.43 | 18.33 | 4.77 | 0.9820 | 0.0858 | |||
| FANG / Diamondback Energy, Inc. | 0.13 | -3.03 | 18.07 | -16.67 | 0.9679 | -0.1426 | |||
| AJG / Arthur J. Gallagher & Co. | 0.06 | -4.81 | 17.71 | -11.74 | 0.9488 | -0.0790 | |||
| FOXA / Fox Corporation | 0.31 | -4.01 | 17.44 | -4.96 | 0.9342 | -0.0056 | |||
| PCAR / PACCAR Inc | 0.18 | -6.58 | 17.44 | -8.80 | 0.9342 | -0.0451 | |||
| CBOE / Cboe Global Markets, Inc. | 0.07 | -3.91 | 17.44 | -0.97 | 0.9341 | 0.0323 | |||
| DGX / Quest Diagnostics Incorporated | 0.09 | -4.65 | 16.84 | 1.23 | 0.9023 | 0.0500 | |||
| BDX / Becton, Dickinson and Company | 0.10 | 16.58 | 0.8879 | 0.8879 | |||||
| SSNC / SS&C Technologies Holdings, Inc. | 0.20 | -5.02 | 16.36 | -5.86 | 0.8766 | -0.0136 | |||
| RS / Reliance, Inc. | 0.05 | -4.15 | 16.31 | 4.19 | 0.8736 | 0.0720 | |||
| FTI / TechnipFMC plc | 0.47 | -9.38 | 16.27 | -1.51 | 0.8716 | 0.0255 | |||
| SYY / Sysco Corporation | 0.21 | -6.72 | 16.21 | -5.85 | 0.8685 | -0.0134 | |||
| CRH / CRH plc | 0.18 | -11.17 | 16.10 | -7.33 | 0.8627 | -0.0273 | |||
| FIX / Comfort Systems USA, Inc. | 0.03 | -6.22 | 16.07 | 56.01 | 0.8610 | 0.3333 | |||
| USFD / US Foods Holding Corp. | 0.21 | -4.79 | 16.01 | 12.01 | 0.8579 | 0.1256 | |||
| STLD / Steel Dynamics, Inc. | 0.12 | -4.92 | 15.97 | -2.71 | 0.8554 | 0.0148 | |||
| COR / Cencora, Inc. | 0.05 | 15.92 | 0.8527 | 0.8527 | |||||
| CTSH / Cognizant Technology Solutions Corporation | 0.20 | -5.38 | 15.90 | -3.48 | 0.8519 | 0.0080 | |||
| FFIV / F5, Inc. | 0.05 | -4.53 | 15.86 | 5.53 | 0.8495 | 0.0798 | |||
| TXT / Textron Inc. | 0.20 | -5.83 | 15.80 | 4.65 | 0.8465 | 0.0731 | |||
| RGLD / Royal Gold, Inc. | 0.09 | -1.57 | 15.63 | 7.05 | 0.8373 | 0.0895 | |||
| TDY / Teledyne Technologies Incorporated | 0.03 | -4.98 | 15.60 | -2.19 | 0.8355 | 0.0188 | |||
| PHM / PulteGroup, Inc. | 0.15 | -4.89 | 15.58 | -2.44 | 0.8345 | 0.0167 | |||
| GPN / Global Payments Inc. | 0.19 | 15.39 | 0.8242 | 0.8242 | |||||
| NBIX / Neurocrine Biosciences, Inc. | 0.12 | -6.30 | 15.29 | 6.49 | 0.8188 | 0.0836 | |||
| CTRA / Coterra Energy Inc. | 0.60 | -4.65 | 15.12 | -16.27 | 0.8100 | -0.1149 | |||
| PR / Permian Resources Corporation | 1.08 | -3.67 | 14.77 | -5.28 | 0.7914 | -0.0074 | |||
| LECO / Lincoln Electric Holdings, Inc. | 0.07 | -4.00 | 14.70 | 5.19 | 0.7875 | 0.0717 | |||
| REGN / Regeneron Pharmaceuticals, Inc. | 0.03 | -11.06 | 14.69 | -26.38 | 0.7870 | -0.2351 | |||
| JBL / Jabil Inc. | 0.07 | -35.96 | 14.61 | 2.65 | 0.7827 | 0.0537 | |||
| CDW / CDW Corporation | 0.08 | -7.53 | 14.31 | 3.05 | 0.7664 | 0.0553 | |||
| CPAY / Corpay, Inc. | 0.04 | -6.48 | 14.29 | -11.02 | 0.7655 | -0.0570 | |||
| HRL / Hormel Foods Corporation | 0.47 | -6.67 | 14.23 | -8.75 | 0.7621 | -0.0364 | |||
| NVR / NVR, Inc. | 0.00 | -3.07 | 14.22 | -1.18 | 0.7620 | 0.0248 | |||
| ON / ON Semiconductor Corporation | 0.27 | -29.59 | 14.22 | -9.31 | 0.7620 | -0.0413 | |||
| LKQ / LKQ Corporation | 0.38 | -5.04 | 14.15 | -17.39 | 0.7582 | -0.1193 | |||
| EME / EMCOR Group, Inc. | 0.03 | 14.11 | 0.7559 | 0.7559 | |||||
| ROST / Ross Stores, Inc. | 0.11 | 14.07 | 0.7537 | 0.7537 | |||||
| BLD / TopBuild Corp. | 0.04 | -4.88 | 14.04 | 0.99 | 0.7520 | 0.0400 | |||
| SNA / Snap-on Incorporated | 0.04 | -4.28 | 13.99 | -11.62 | 0.7494 | -0.0613 | |||
| NDSN / Nordson Corporation | 0.07 | -4.43 | 13.97 | 1.54 | 0.7484 | 0.0437 | |||
| UHS / Universal Health Services, Inc. | 0.08 | -5.50 | 13.93 | -8.90 | 0.7461 | -0.0369 | |||
| ALLE / Allegion plc | 0.10 | -10.35 | 13.88 | -0.96 | 0.7433 | 0.0257 | |||
| DOX / Amdocs Limited | 0.15 | -10.27 | 13.67 | -10.56 | 0.7321 | -0.0505 | |||
| EPAM / EPAM Systems, Inc. | 0.08 | -6.94 | 13.57 | -2.54 | 0.7268 | 0.0138 | |||
| GDDY / GoDaddy Inc. | 0.08 | 13.54 | 0.7254 | 0.7254 | |||||
| OMC / Omnicom Group Inc. | 0.18 | -5.33 | 13.19 | -17.89 | 0.7064 | -0.1161 | |||
| NTAP / NetApp, Inc. | 0.12 | -5.98 | 13.15 | 14.05 | 0.7044 | 0.1139 | |||
| AVY / Avery Dennison Corporation | 0.07 | -4.19 | 13.06 | -5.53 | 0.6997 | -0.0085 | |||
| ZM / Zoom Communications Inc. | 0.17 | 13.03 | 0.6978 | 0.6978 | |||||
| GPC / Genuine Parts Company | 0.11 | 12.95 | 0.6939 | 0.6939 | |||||
| DBX / Dropbox, Inc. | 0.45 | -4.70 | 12.80 | 2.04 | 0.6855 | 0.0432 | |||
| AOS / A. O. Smith Corporation | 0.19 | -5.50 | 12.75 | -5.19 | 0.6828 | -0.0058 | |||
| TOL / Toll Brothers, Inc. | 0.11 | -5.01 | 12.71 | 2.68 | 0.6809 | 0.0469 | |||
| IEX / IDEX Corporation | 0.07 | 12.52 | 0.6709 | 0.6709 | |||||
| CCK / Crown Holdings, Inc. | 0.12 | 12.50 | 0.6695 | 0.6695 | |||||
| WSM / Williams-Sonoma, Inc. | 0.08 | -4.29 | 12.47 | -1.10 | 0.6681 | 0.0222 | |||
| DECK / Deckers Outdoor Corporation | 0.12 | -5.92 | 12.22 | -13.27 | 0.6546 | -0.0671 | |||
| CROX / Crocs, Inc. | 0.12 | -5.96 | 12.13 | -10.31 | 0.6500 | -0.0429 | |||
| MAS / Masco Corporation | 0.19 | -5.56 | 12.08 | -12.60 | 0.6471 | -0.0607 | |||
| ALGN / Align Technology, Inc. | 0.06 | -6.26 | 12.06 | 11.72 | 0.6459 | 0.0931 | |||
| PKG / Packaging Corporation of America | 0.06 | -4.64 | 11.76 | -9.28 | 0.6298 | -0.0339 | |||
| OC / Owens Corning | 0.08 | -6.12 | 11.57 | -9.63 | 0.6196 | -0.0359 | |||
| BLDR / Builders FirstSource, Inc. | 0.10 | -4.09 | 11.54 | -10.42 | 0.6180 | -0.0416 | |||
| JAZZ / Jazz Pharmaceuticals plc | 0.11 | -13.46 | 11.44 | -26.04 | 0.6129 | -0.1793 | |||
| FTV / Fortive Corporation | 0.19 | 9.92 | 0.5311 | 0.5311 | |||||
| ICLR / ICON Public Limited Company | 0.07 | -13.58 | 9.48 | -28.17 | 0.5080 | -0.1682 | |||
| RAL / Ralliant Corporation | 0.06 | 3.08 | 0.1649 | 0.1649 | |||||
| OVV / Ovintiv Inc. | 0.00 | -14.29 | 0.00 | 0.0000 | -0.0000 | ||||
| TAP.A / Molson Coors Beverage Company | 0.00 | -93.70 | 0.00 | -100.00 | 0.0000 | -0.0004 | |||
| APA / APA Corporation | 0.00 | 0.00 | 0.00 | 0.0000 | -0.0000 | ||||
| SWKS / Skyworks Solutions, Inc. | 0.00 | -96.61 | 0.00 | -100.00 | 0.0000 | -0.0004 | |||
| MTDR / Matador Resources Company | 0.00 | 0.00 | 0.00 | 0.0000 | -0.0000 | ||||
| BBWI / Bath & Body Works, Inc. | 0.00 | 28.57 | 0.00 | 0.0000 | 0.0000 | ||||
| MOS / The Mosaic Company | 0.00 | 0.00 | 0.00 | 0.0000 | 0.0000 | ||||
| RRC / Range Resources Corporation | 0.00 | 20.00 | 0.00 | 0.0000 | 0.0000 | ||||
| BWA / BorgWarner Inc. | 0.00 | 0.00 | 0.00 | 0.0000 | 0.0000 | ||||
| CIVI / Civitas Resources, Inc. | 0.00 | 33.33 | 0.00 | 0.0000 | 0.0000 | ||||
| WFRD / Weatherford International plc | 0.00 | 0.00 | 0.00 | 0.0000 | -0.0000 | ||||
| DXC / DXC Technology Company | 0.00 | 30.00 | 0.00 | 0.0000 | 0.0000 | ||||
| CHRW / C.H. Robinson Worldwide, Inc. | 0.00 | 0.00 | 0.0000 | 0.0000 | |||||
| MAT / Mattel, Inc. | 0.00 | 0.00 | 0.0000 | 0.0000 | |||||
| ETSY / Etsy, Inc. | 0.00 | -25.00 | 0.00 | 0.0000 | -0.0000 | ||||
| QRVO / Qorvo, Inc. | 0.00 | 0.00 | 0.0000 | 0.0000 | |||||
| CF / CF Industries Holdings, Inc. | 0.00 | -100.00 | 0.00 | 0.0000 | |||||
| AR / Antero Resources Corporation | 0.00 | -100.00 | 0.00 | 0.0000 | |||||
| IPG / The Interpublic Group of Companies, Inc. | 0.00 | -100.00 | 0.00 | 0.0000 | |||||
| WMS / Advanced Drainage Systems, Inc. | 0.00 | -100.00 | 0.00 | 0.0000 | |||||
| EXEL / Exelixis, Inc. | 0.00 | -100.00 | 0.00 | 0.0000 | |||||
| HOLX / Hologic, Inc. | 0.00 | -100.00 | 0.00 | 0.0000 | |||||
| CACI / CACI International Inc | 0.00 | -100.00 | 0.00 | 0.0000 | |||||
| SGI / Somnigroup International Inc. | 0.00 | -100.00 | 0.00 | 0.0000 | |||||
| FDX / FedEx Corporation | 0.00 | -100.00 | 0.00 | -100.00 | -0.9672 | ||||
| ULTA / Ulta Beauty, Inc. | 0.00 | -100.00 | 0.00 | 0.0000 | |||||
| VST / Vistra Corp. | 0.00 | -100.00 | 0.00 | 0.0000 | |||||
| EXP / Eagle Materials Inc. | 0.00 | -100.00 | 0.00 | 0.0000 | |||||
| MEDP / Medpace Holdings, Inc. | 0.00 | -100.00 | 0.00 | 0.0000 | |||||
| FERG / Ferguson Enterprises Inc. | 0.00 | -100.00 | 0.00 | 0.0000 | |||||
| FTXP / Foothills Exploration, Inc. | 0.00 | -100.00 | 0.00 | 0.0000 | |||||
| FBIN / Fortune Brands Innovations, Inc. | 0.00 | -100.00 | 0.00 | 0.0000 | |||||
| GMED / Globus Medical, Inc. | 0.00 | -100.00 | 0.00 | 0.0000 | |||||
| WAB / Westinghouse Air Brake Technologies Corporation | 0.00 | -100.00 | 0.00 | 0.0000 | |||||
| PSN / Parsons Corporation | 0.00 | -100.00 | 0.00 | 0.0000 | |||||
| CNXC / Concentrix Corporation | 0.00 | -100.00 | 0.00 | 0.0000 | |||||
| LEN / Lennar Corporation | 0.00 | -100.00 | 0.00 | 0.0000 | |||||
| DKS / DICK'S Sporting Goods, Inc. | 0.00 | -100.00 | 0.00 | 0.0000 |