Statistik Asas
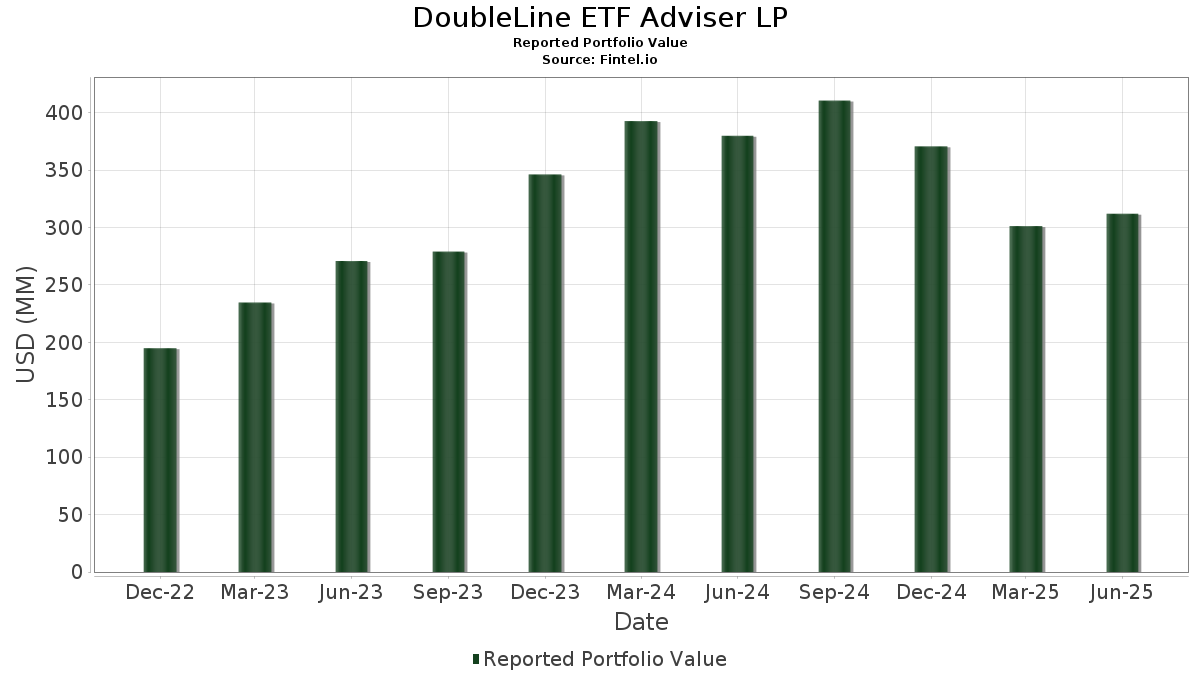
| Nilai Portfolio | $ 311,988,651 |
| Kedudukan Semasa | 155 |
Pegangan Terkini, Prestasi, AUM (dari 13F, 13D)
DoubleLine ETF Adviser LP telah mendedahkan 155 jumlah pegangan dalam pemfailan SEC terkini mereka. Nilai portfolio terkini dikira sebagai $ 311,988,651 USD. Aset Sebenar Di Bawah Pengurusan (AUM) ialah nilai ini ditambah dengan tunai (yang tidak didedahkan). Pegangan teratas DoubleLine ETF Adviser LP ialah Amazon.com, Inc. (US:AMZN) , Meta Platforms, Inc. (US:META) , Linde plc (US:LIN) , Tesla, Inc. (US:TSLA) , and Alphabet Inc. (US:GOOGL) . Kedudukan baharu DoubleLine ETF Adviser LP termasuk DoorDash, Inc. (US:DASH) , TKO Group Holdings, Inc. (US:TKO) , Williams-Sonoma, Inc. (US:WSM) , Millrose Properties, Inc. (US:MRP) , and .
Kenaikan Teratas Suku Tahun Ini
Kami menggunakan perubahan dalam peruntukan portfolio kerana ini adalah metrik yang paling bermakna. Perubahan boleh disebabkan oleh perdagangan atau perubahan dalam harga saham.
| Sekuriti | Saham (MM) |
Nilai (MM$) |
Portfolio % | ΔPortfolio % |
|---|---|---|---|---|
| 0.03 | 12.61 | 4.0420 | 4.0420 | |
| 0.01 | 4.54 | 1.4554 | 1.4554 | |
| 0.01 | 3.92 | 1.2558 | 1.2558 | |
| 0.07 | 3.80 | 1.2185 | 1.2185 | |
| 0.08 | 3.66 | 1.1733 | 1.1733 | |
| 0.01 | 3.62 | 1.1590 | 1.1590 | |
| 0.05 | 3.59 | 1.1506 | 1.1506 | |
| 0.01 | 3.45 | 1.1064 | 1.1064 | |
| 0.01 | 3.44 | 1.1024 | 1.1024 | |
| 0.03 | 3.30 | 1.0579 | 1.0579 |
Penurunan Teratas Suku Tahun Ini
Kami menggunakan perubahan dalam peruntukan portfolio kerana ini adalah metrik yang paling bermakna. Perubahan boleh disebabkan oleh perdagangan atau perubahan dalam harga saham.
| Sekuriti | Saham (MM) |
Nilai (MM$) |
Portfolio % | ΔPortfolio % |
|---|---|---|---|---|
| 0.00 | 3.12 | 0.9997 | -0.4974 | |
| 0.01 | 3.37 | 1.0801 | -0.3079 | |
| 0.13 | 3.63 | 1.1627 | -0.2535 | |
| 0.01 | 2.53 | 0.8104 | -0.2076 | |
| 0.02 | 2.13 | 0.6828 | -0.1723 | |
| 0.02 | 3.63 | 1.1622 | -0.1681 | |
| 0.05 | 5.59 | 1.7916 | -0.1614 | |
| 0.02 | 2.81 | 0.9022 | -0.1584 | |
| 0.02 | 1.65 | 0.5295 | -0.1496 | |
| 0.08 | 3.51 | 1.1247 | -0.1444 |
13F dan Pemfailan Dana
Borang ini telah difailkan pada 2025-08-14 untuk tempoh pelaporan 2025-06-30. Klik ikon pautan untuk melihat sejarah transaksi penuh.
Tingkatkan untuk membuka data premium dan eksport ke Excel ![]() .
.
| Sekuriti | Jenis | Purata Harga Saham | Saham (MM) |
ΔSaham (%) |
ΔSaham (%) |
Nilai ($MM) |
Portfolio (%) |
ΔPortfolio (%) |
|
|---|---|---|---|---|---|---|---|---|---|
| AMZN / Amazon.com, Inc. | 0.08 | 5.18 | 18.18 | 21.29 | 5.8278 | 0.8509 | |||
| META / Meta Platforms, Inc. | 0.02 | -13.70 | 15.23 | 10.52 | 4.8810 | 0.3070 | |||
| LIN / Linde plc | 0.03 | 12.61 | 4.0420 | 4.0420 | |||||
| TSLA / Tesla, Inc. | 0.04 | 6.28 | 12.60 | 30.27 | 4.0399 | 0.8279 | |||
| GOOGL / Alphabet Inc. | 0.04 | 5.29 | 7.87 | 19.99 | 2.5239 | 0.3454 | |||
| NFLX / Netflix, Inc. | 0.01 | -7.43 | 7.16 | 32.92 | 2.2946 | 0.5068 | |||
| GOOG / Alphabet Inc. | 0.04 | 4.33 | 6.37 | 18.47 | 2.0415 | 0.2565 | |||
| AMT / American Tower Corporation | 0.03 | 1.13 | 5.97 | 2.72 | 1.9125 | -0.0158 | |||
| PLD / Prologis, Inc. | 0.05 | 1.04 | 5.59 | -4.98 | 1.7916 | -0.1614 | |||
| WELL / Welltower Inc. | 0.04 | 49.80 | 5.51 | 50.30 | 1.7663 | 0.5492 | |||
| HD / The Home Depot, Inc. | 0.01 | 7.00 | 5.24 | 7.05 | 1.6796 | 0.0545 | |||
| SHW / The Sherwin-Williams Company | 0.01 | 4.54 | 1.4554 | 1.4554 | |||||
| ECL / Ecolab Inc. | 0.01 | 3.92 | 1.2558 | 1.2558 | |||||
| EA / Electronic Arts Inc. | 0.02 | 10.68 | 3.84 | 22.32 | 1.2313 | 0.1886 | |||
| NEM / Newmont Corporation | 0.07 | 3.80 | 1.2185 | 1.2185 | |||||
| DIS / The Walt Disney Company | 0.03 | -5.12 | 3.68 | 19.20 | 1.1782 | 0.1546 | |||
| FCX / Freeport-McMoRan Inc. | 0.08 | 3.66 | 1.1733 | 1.1733 | |||||
| TTWO / Take-Two Interactive Software, Inc. | 0.01 | -19.60 | 3.64 | -5.79 | 1.1676 | -0.1160 | |||
| T / AT&T Inc. | 0.13 | -16.90 | 3.63 | -14.98 | 1.1627 | -0.2535 | |||
| TMUS / T-Mobile US, Inc. | 0.02 | 1.29 | 3.63 | -9.51 | 1.1622 | -0.1681 | |||
| APD / Air Products and Chemicals, Inc. | 0.01 | 3.62 | 1.1590 | 1.1590 | |||||
| CHTR / Charter Communications, Inc. | 0.01 | -5.83 | 3.61 | 4.45 | 1.1576 | 0.0099 | |||
| BKNG / Booking Holdings Inc. | 0.00 | -17.15 | 3.61 | 4.10 | 1.1560 | 0.0060 | |||
| CMCSA / Comcast Corporation | 0.10 | 12.34 | 3.59 | 8.63 | 1.1507 | 0.0538 | |||
| CTVA / Corteva, Inc. | 0.05 | 3.59 | 1.1506 | 1.1506 | |||||
| VZ / Verizon Communications Inc. | 0.08 | -3.78 | 3.51 | -8.22 | 1.1247 | -0.1444 | |||
| VMC / Vulcan Materials Company | 0.01 | 3.45 | 1.1064 | 1.1064 | |||||
| MLM / Martin Marietta Materials, Inc. | 0.01 | 3.44 | 1.1024 | 1.1024 | |||||
| MCD / McDonald's Corporation | 0.01 | -13.83 | 3.37 | -19.42 | 1.0801 | -0.3079 | |||
| NUE / Nucor Corporation | 0.03 | 3.30 | 1.0579 | 1.0579 | |||||
| DLR / Digital Realty Trust, Inc. | 0.02 | 2.20 | 3.26 | 24.33 | 1.0434 | 0.1743 | |||
| DD / DuPont de Nemours, Inc. | 0.05 | 3.17 | 1.0155 | 1.0155 | |||||
| EQIX / Equinix, Inc. | 0.00 | -29.11 | 3.12 | -30.83 | 0.9997 | -0.4974 | |||
| O / Realty Income Corporation | 0.05 | 4.60 | 3.06 | 3.87 | 0.9806 | 0.0029 | |||
| WBD / Warner Bros. Discovery, Inc. | 0.26 | -6.63 | 3.02 | -0.30 | 0.9683 | -0.0374 | |||
| SPG / Simon Property Group, Inc. | 0.02 | 1.35 | 2.89 | -1.93 | 0.9279 | -0.0518 | |||
| PPG / PPG Industries, Inc. | 0.03 | 2.85 | 0.9140 | 0.9140 | |||||
| TJX / The TJX Companies, Inc. | 0.02 | -13.10 | 2.81 | -11.90 | 0.9022 | -0.1584 | |||
| LYV / Live Nation Entertainment, Inc. | 0.02 | -7.31 | 2.79 | 7.38 | 0.8950 | 0.0318 | |||
| IP / International Paper Company | 0.06 | 2.73 | 0.8762 | 0.8762 | |||||
| PSA / Public Storage | 0.01 | 1.31 | 2.72 | -0.66 | 0.8732 | -0.0374 | |||
| CCI / Crown Castle Inc. | 0.03 | 1.95 | 2.64 | 0.46 | 0.8449 | -0.0260 | |||
| LOW / Lowe's Companies, Inc. | 0.01 | -13.33 | 2.53 | -17.55 | 0.8104 | -0.2076 | |||
| CBRE / CBRE Group, Inc. | 0.02 | -1.67 | 2.46 | 5.36 | 0.7876 | 0.0133 | |||
| SW / Smurfit Westrock Plc | 0.05 | 2.34 | 0.7509 | 0.7509 | |||||
| AMCR / Amcor plc | 0.25 | 2.30 | 0.7365 | 0.7365 | |||||
| SBUX / Starbucks Corporation | 0.02 | -11.47 | 2.13 | -17.28 | 0.6828 | -0.1723 | |||
| IFF / International Flavors & Fragrances Inc. | 0.03 | 2.08 | 0.6683 | 0.6683 | |||||
| DOW / Dow Inc. | 0.08 | 2.07 | 0.6633 | 0.6633 | |||||
| VICI / VICI Properties Inc. | 0.06 | 1.91 | 2.03 | 1.86 | 0.6508 | -0.0110 | |||
| CSGP / CoStar Group, Inc. | 0.02 | 1.33 | 2.00 | 2.83 | 0.6405 | -0.0046 | |||
| STLD / Steel Dynamics, Inc. | 0.02 | 1.96 | 0.6292 | 0.6292 | |||||
| PKG / Packaging Corporation of America | 0.01 | 1.87 | 0.6005 | 0.6005 | |||||
| EXR / Extra Space Storage Inc. | 0.01 | 1.39 | 1.84 | 0.66 | 0.5893 | -0.0170 | |||
| IRM / Iron Mountain Incorporated | 0.02 | 1.28 | 1.79 | 20.77 | 0.5723 | 0.0814 | |||
| DASH / DoorDash, Inc. | 0.01 | 1.75 | 0.5608 | 0.5608 | |||||
| BALL / Ball Corporation | 0.03 | 1.74 | 0.5566 | 0.5566 | |||||
| NKE / NIKE, Inc. | 0.02 | -12.51 | 1.72 | -2.05 | 0.5510 | -0.0318 | |||
| AVB / AvalonBay Communities, Inc. | 0.01 | 1.66 | 1.71 | -3.56 | 0.5469 | -0.0407 | |||
| VTR / Ventas, Inc. | 0.03 | 8.38 | 1.67 | -0.48 | 0.5365 | -0.0217 | |||
| OMC / Omnicom Group Inc. | 0.02 | -6.93 | 1.65 | -19.22 | 0.5295 | -0.1496 | |||
| CF / CF Industries Holdings, Inc. | 0.02 | 1.64 | 0.5246 | 0.5246 | |||||
| LYB / LyondellBasell Industries N.V. | 0.03 | 1.62 | 0.5188 | 0.5188 | |||||
| ORLY / O'Reilly Automotive, Inc. | 0.02 | 1,213.78 | 1.59 | -17.32 | 0.5097 | -0.1290 | |||
| RCL / Royal Caribbean Cruises Ltd. | 0.01 | -12.03 | 1.57 | 34.07 | 0.5048 | 0.1149 | |||
| CMG / Chipotle Mexican Grill, Inc. | 0.03 | -13.26 | 1.56 | -3.05 | 0.4997 | -0.0338 | |||
| AVY / Avery Dennison Corporation | 0.01 | 1.53 | 0.4913 | 0.4913 | |||||
| SBAC / SBA Communications Corporation | 0.01 | 1.49 | 1.49 | 8.39 | 0.4764 | 0.0209 | |||
| FOXA / Fox Corporation | 0.03 | -9.56 | 1.43 | -10.48 | 0.4573 | -0.0716 | |||
| TKO / TKO Group Holdings, Inc. | 0.01 | 1.41 | 0.4533 | 0.4533 | |||||
| EQR / Equity Residential | 0.02 | 1.52 | 1.36 | -4.30 | 0.4352 | -0.0357 | |||
| NWSA / News Corporation | 0.04 | -6.79 | 1.33 | 1.75 | 0.4278 | -0.0076 | |||
| AZO / AutoZone, Inc. | 0.00 | -9.62 | 1.33 | -12.02 | 0.4248 | -0.0752 | |||
| HLT / Hilton Worldwide Holdings Inc. | 0.00 | -14.09 | 1.31 | 0.54 | 0.4189 | -0.0126 | |||
| MOS / The Mosaic Company | 0.04 | 1.30 | 0.4180 | 0.4180 | |||||
| MAR / Marriott International, Inc. | 0.00 | -13.29 | 1.28 | -0.54 | 0.4115 | -0.0170 | |||
| ABNB / Airbnb, Inc. | 0.01 | -12.02 | 1.18 | -2.55 | 0.3796 | -0.0238 | |||
| INVH / Invitation Homes Inc. | 0.03 | 1.24 | 1.10 | -4.76 | 0.3528 | -0.0307 | |||
| WY / Weyerhaeuser Company | 0.04 | -1.38 | 1.10 | -13.43 | 0.3513 | -0.0692 | |||
| IPG / The Interpublic Group of Companies, Inc. | 0.04 | -7.45 | 1.08 | -16.56 | 0.3456 | -0.0835 | |||
| ESS / Essex Property Trust, Inc. | 0.00 | 1.42 | 1.07 | -6.22 | 0.3431 | -0.0359 | |||
| MAA / Mid-America Apartment Communities, Inc. | 0.01 | 1.58 | 1.02 | -10.28 | 0.3273 | -0.0506 | |||
| GM / General Motors Company | 0.02 | -22.70 | 0.98 | -19.16 | 0.3153 | -0.0884 | |||
| EMN / Eastman Chemical Company | 0.01 | 0.97 | 0.3110 | 0.3110 | |||||
| PARA / Paramount Global | 0.07 | -5.83 | 0.94 | 1.52 | 0.3006 | -0.0059 | |||
| SUI / Sun Communities, Inc. | 0.01 | 1.13 | 0.89 | -0.56 | 0.2855 | -0.0118 | |||
| F / Ford Motor Company | 0.08 | -11.70 | 0.89 | -4.52 | 0.2846 | -0.0240 | |||
| MTCH / Match Group, Inc. | 0.03 | -9.23 | 0.88 | -10.12 | 0.2818 | -0.0430 | |||
| ROST / Ross Stores, Inc. | 0.01 | -12.17 | 0.88 | -12.30 | 0.2812 | -0.0510 | |||
| YUM / Yum! Brands, Inc. | 0.01 | -8.76 | 0.86 | -14.14 | 0.2765 | -0.0568 | |||
| KIM / Kimco Realty Corporation | 0.04 | 1.29 | 0.84 | 0.24 | 0.2677 | -0.0089 | |||
| WPC / W. P. Carey Inc. | 0.01 | 1.18 | 0.80 | 0.00 | 0.2573 | -0.0092 | |||
| ALB / Albemarle Corporation | 0.01 | 0.80 | 0.2567 | 0.2567 | |||||
| FOX / Fox Corporation | 0.02 | -7.00 | 0.79 | -8.87 | 0.2536 | -0.0347 | |||
| JLL / Jones Lang LaSalle Incorporated | 0.00 | 2.91 | 0.76 | 6.15 | 0.2435 | 0.0060 | |||
| GLPI / Gaming and Leisure Properties, Inc. | 0.02 | 1.47 | 0.75 | -6.91 | 0.2419 | -0.0273 | |||
| DHI / D.R. Horton, Inc. | 0.01 | -15.03 | 0.75 | -13.86 | 0.2412 | -0.0487 | |||
| EBAY / eBay Inc. | 0.01 | -14.60 | 0.73 | -6.07 | 0.2331 | -0.0241 | |||
| UDR / UDR, Inc. | 0.02 | 1.63 | 0.72 | -8.25 | 0.2320 | -0.0296 | |||
| DOC / Healthpeak Properties, Inc. | 0.04 | 0.61 | 0.72 | -12.80 | 0.2293 | -0.0433 | |||
| CPT / Camden Property Trust | 0.01 | 1.26 | 0.71 | -6.74 | 0.2266 | -0.0249 | |||
| ELS / Equity LifeStyle Properties, Inc. | 0.01 | 1.32 | 0.69 | -6.23 | 0.2218 | -0.0234 | |||
| REG / Regency Centers Corporation | 0.01 | 1.45 | 0.68 | -2.15 | 0.2195 | -0.0126 | |||
| AMH / American Homes 4 Rent | 0.02 | 1.87 | 0.68 | -2.74 | 0.2164 | -0.0142 | |||
| NLY / Annaly Capital Management, Inc. | 0.04 | 9.15 | 0.67 | 1.21 | 0.2148 | -0.0052 | |||
| Z / Zillow Group, Inc. | 0.01 | 6.96 | 0.66 | 9.39 | 0.2129 | 0.0111 | |||
| ARE / Alexandria Real Estate Equities, Inc. | 0.01 | -0.44 | 0.65 | -21.82 | 0.2090 | -0.0680 | |||
| GRMN / Garmin Ltd. | 0.00 | -12.35 | 0.65 | -15.80 | 0.2069 | -0.0475 | |||
| LAMR / Lamar Advertising Company | 0.01 | 1.57 | 0.63 | 8.29 | 0.2012 | 0.0089 | |||
| OHI / Omega Healthcare Investors, Inc. | 0.02 | 8.86 | 0.63 | 4.86 | 0.2007 | 0.0023 | |||
| HST / Host Hotels & Resorts, Inc. | 0.04 | -0.12 | 0.63 | 7.93 | 0.2007 | 0.0082 | |||
| TSCO / Tractor Supply Company | 0.01 | -10.80 | 0.60 | -14.55 | 0.1920 | -0.0408 | |||
| CCL / Carnival Corporation & plc | 0.02 | -11.85 | 0.59 | 26.92 | 0.1905 | 0.0350 | |||
| BXP / Boston Properties, Inc. | 0.01 | 1.77 | 0.58 | 2.12 | 0.1856 | -0.0025 | |||
| CUBE / CubeSmart | 0.01 | 2.05 | 0.57 | 1.43 | 0.1823 | -0.0036 | |||
| LULU / lululemon athletica inc. | 0.00 | -13.17 | 0.55 | -27.11 | 0.1777 | -0.0748 | |||
| AGNC / AGNC Investment Corp. | 0.06 | 16.87 | 0.55 | 12.20 | 0.1771 | 0.0135 | |||
| LEN / Lennar Corporation | 0.00 | -12.18 | 0.55 | -15.36 | 0.1768 | -0.0396 | |||
| DRI / Darden Restaurants, Inc. | 0.00 | -11.94 | 0.54 | -7.64 | 0.1747 | -0.0211 | |||
| EGP / EastGroup Properties, Inc. | 0.00 | 6.69 | 0.51 | 1.19 | 0.1639 | -0.0038 | |||
| REXR / Rexford Industrial Realty, Inc. | 0.01 | 7.42 | 0.49 | -2.58 | 0.1577 | -0.0097 | |||
| NVR / NVR, Inc. | 0.00 | -10.96 | 0.48 | -9.09 | 0.1539 | -0.0217 | |||
| NNN / NNN REIT, Inc. | 0.01 | 1.88 | 0.48 | 3.02 | 0.1531 | -0.0006 | |||
| ADC / Agree Realty Corporation | 0.01 | 8.21 | 0.47 | 2.39 | 0.1515 | -0.0017 | |||
| BRX / Brixmor Property Group Inc. | 0.02 | 2.57 | 0.47 | 0.64 | 0.1503 | -0.0044 | |||
| PHM / PulteGroup, Inc. | 0.00 | -11.64 | 0.46 | -9.43 | 0.1480 | -0.0211 | |||
| ULTA / Ulta Beauty, Inc. | 0.00 | -16.78 | 0.45 | 6.07 | 0.1457 | 0.0036 | |||
| EXPE / Expedia Group, Inc. | 0.00 | -11.00 | 0.45 | -10.78 | 0.1434 | -0.0229 | |||
| NWS / News Corporation | 0.01 | -7.20 | 0.44 | 4.74 | 0.1419 | 0.0017 | |||
| WSM / Williams-Sonoma, Inc. | 0.00 | 0.44 | 0.1404 | 0.1404 | |||||
| FRT / Federal Realty Investment Trust | 0.00 | 2.24 | 0.43 | -0.69 | 0.1387 | -0.0060 | |||
| STAG / STAG Industrial, Inc. | 0.01 | 3.84 | 0.40 | 4.21 | 0.1272 | 0.0009 | |||
| STWD / Starwood Property Trust, Inc. | 0.02 | 2.01 | 0.38 | 3.81 | 0.1221 | -0.0000 | |||
| VNO / Vornado Realty Trust | 0.01 | 1.50 | 0.38 | 5.04 | 0.1203 | 0.0016 | |||
| FR / First Industrial Realty Trust, Inc. | 0.01 | 1.29 | 0.37 | -9.69 | 0.1197 | -0.0175 | |||
| GPC / Genuine Parts Company | 0.00 | -9.94 | 0.37 | -8.37 | 0.1195 | -0.0155 | |||
| TPR / Tapestry, Inc. | 0.00 | -21.46 | 0.37 | -1.86 | 0.1186 | -0.0068 | |||
| RITM / Rithm Capital Corp. | 0.03 | 3.31 | 0.35 | 1.73 | 0.1130 | -0.0019 | |||
| LVS / Las Vegas Sands Corp. | 0.01 | -11.35 | 0.33 | 0.00 | 0.1064 | -0.0040 | |||
| HR / Healthcare Realty Trust Incorporated | 0.02 | 0.54 | 0.33 | -5.49 | 0.1049 | -0.0103 | |||
| DECK / Deckers Outdoor Corporation | 0.00 | -12.61 | 0.32 | -19.39 | 0.1014 | -0.0290 | |||
| DPZ / Domino's Pizza, Inc. | 0.00 | -13.67 | 0.31 | -15.19 | 0.0985 | -0.0220 | |||
| APTV / Aptiv PLC | 0.00 | -18.81 | 0.30 | -6.87 | 0.0956 | -0.0108 | |||
| CUZ / Cousins Properties Incorporated | 0.01 | 1.96 | 0.30 | 3.83 | 0.0956 | 0.0002 | |||
| BBY / Best Buy Co., Inc. | 0.00 | -9.64 | 0.29 | -17.51 | 0.0936 | -0.0240 | |||
| SBRA / Sabra Health Care REIT, Inc. | 0.01 | 1.96 | 0.26 | 7.92 | 0.0831 | 0.0031 | |||
| COLD / Americold Realty Trust, Inc. | 0.02 | 1.72 | 0.26 | -21.17 | 0.0824 | -0.0259 | |||
| KMX / CarMax, Inc. | 0.00 | -8.18 | 0.24 | -20.66 | 0.0776 | -0.0239 | |||
| LKQ / LKQ Corporation | 0.01 | -9.05 | 0.22 | -20.92 | 0.0717 | -0.0221 | |||
| RL / Ralph Lauren Corporation | 0.00 | -12.31 | 0.22 | 8.82 | 0.0714 | 0.0035 | |||
| POOL / Pool Corporation | 0.00 | -12.08 | 0.22 | -19.71 | 0.0707 | -0.0203 | |||
| KRC / Kilroy Realty Corporation | 0.01 | 0.60 | 0.21 | 5.42 | 0.0686 | 0.0012 | |||
| ZG / Zillow Group, Inc. | 0.00 | -3.10 | 0.21 | -0.95 | 0.0673 | -0.0029 | |||
| MRP / Millrose Properties, Inc. | 0.01 | 0.20 | 0.0647 | 0.0647 | |||||
| ATUS / Altice USA, Inc. | 0.01 | 34.88 | 0.03 | 10.71 | 0.0100 | 0.0005 | |||
| KMB / Kimberly-Clark Corporation | 0.00 | -100.00 | 0.00 | 0.0000 | |||||
| TSN / Tyson Foods, Inc. | 0.00 | -100.00 | 0.00 | 0.0000 | |||||
| MO / Altria Group, Inc. | 0.00 | -100.00 | 0.00 | 0.0000 | |||||
| HRL / Hormel Foods Corporation | 0.00 | -100.00 | 0.00 | 0.0000 | |||||
| PM / Philip Morris International Inc. | 0.00 | -100.00 | 0.00 | 0.0000 | |||||
| LINE / Lineage, Inc. | 0.00 | -100.00 | 0.00 | 0.0000 | |||||
| CPB / The Campbell's Company | 0.00 | -100.00 | 0.00 | 0.0000 | |||||
| DG / Dollar General Corporation | 0.00 | -100.00 | 0.00 | 0.0000 | |||||
| MKC / McCormick & Company, Incorporated | 0.00 | -100.00 | 0.00 | 0.0000 | |||||
| CAG / Conagra Brands, Inc. | 0.00 | -100.00 | 0.00 | 0.0000 | |||||
| PEP / PepsiCo, Inc. | 0.00 | -100.00 | 0.00 | 0.0000 | |||||
| KDP / Keurig Dr Pepper Inc. | 0.00 | -100.00 | 0.00 | 0.0000 | |||||
| K / Kellanova | 0.00 | -100.00 | 0.00 | 0.0000 | |||||
| MNST / Monster Beverage Corporation | 0.00 | -100.00 | 0.00 | 0.0000 | |||||
| KHC / The Kraft Heinz Company | 0.00 | -100.00 | 0.00 | 0.0000 | |||||
| DLTR / Dollar Tree, Inc. | 0.00 | -100.00 | 0.00 | 0.0000 | |||||
| KR / The Kroger Co. | 0.00 | -100.00 | 0.00 | 0.0000 | |||||
| MDLZ / Mondelez International, Inc. | 0.00 | -100.00 | 0.00 | 0.0000 | |||||
| STZ / Constellation Brands, Inc. | 0.00 | -100.00 | 0.00 | 0.0000 | |||||
| NCLH / Norwegian Cruise Line Holdings Ltd. | 0.00 | -100.00 | 0.00 | 0.0000 | |||||
| HSY / The Hershey Company | 0.00 | -100.00 | 0.00 | 0.0000 | |||||
| GIS / General Mills, Inc. | 0.00 | -100.00 | 0.00 | 0.0000 | |||||
| WMT / Walmart Inc. | 0.00 | -100.00 | 0.00 | 0.0000 | |||||
| COST / Costco Wholesale Corporation | 0.00 | -100.00 | 0.00 | 0.0000 | |||||
| ADM / Archer-Daniels-Midland Company | 0.00 | -100.00 | 0.00 | 0.0000 | |||||
| SYY / Sysco Corporation | 0.00 | -100.00 | 0.00 | 0.0000 | |||||
| KVUE / Kenvue Inc. | 0.00 | -100.00 | 0.00 | 0.0000 | |||||
| BG / Bunge Global SA | 0.00 | -100.00 | 0.00 | 0.0000 | |||||
| TAP / Molson Coors Beverage Company | 0.00 | -100.00 | 0.00 | 0.0000 | |||||
| EL / The Estée Lauder Companies Inc. | 0.00 | -100.00 | 0.00 | 0.0000 | |||||
| CLX / The Clorox Company | 0.00 | -100.00 | 0.00 | 0.0000 | |||||
| RYN / Rayonier Inc. | 0.00 | -100.00 | 0.00 | 0.0000 | |||||
| LW / Lamb Weston Holdings, Inc. | 0.00 | -100.00 | 0.00 | 0.0000 | |||||
| SJM / The J. M. Smucker Company | 0.00 | -100.00 | 0.00 | 0.0000 | |||||
| BFB / Brown-Forman Corp. - Class B | 0.00 | -100.00 | 0.00 | 0.0000 | |||||
| WBA / Walgreens Boots Alliance, Inc. | 0.00 | -100.00 | 0.00 | 0.0000 | |||||
| CHD / Church & Dwight Co., Inc. | 0.00 | -100.00 | 0.00 | 0.0000 | |||||
| QVCGB / QVC Group Inc. | 0.00 | -100.00 | 0.00 | 0.0000 | |||||
| PG / The Procter & Gamble Company | 0.00 | -100.00 | 0.00 | 0.0000 | |||||
| KO / The Coca-Cola Company | 0.00 | -100.00 | 0.00 | 0.0000 | |||||
| CL / Colgate-Palmolive Company | 0.00 | -100.00 | 0.00 | 0.0000 | |||||
| TGT / Target Corporation | 0.00 | -100.00 | 0.00 | 0.0000 |