Statistik Asas
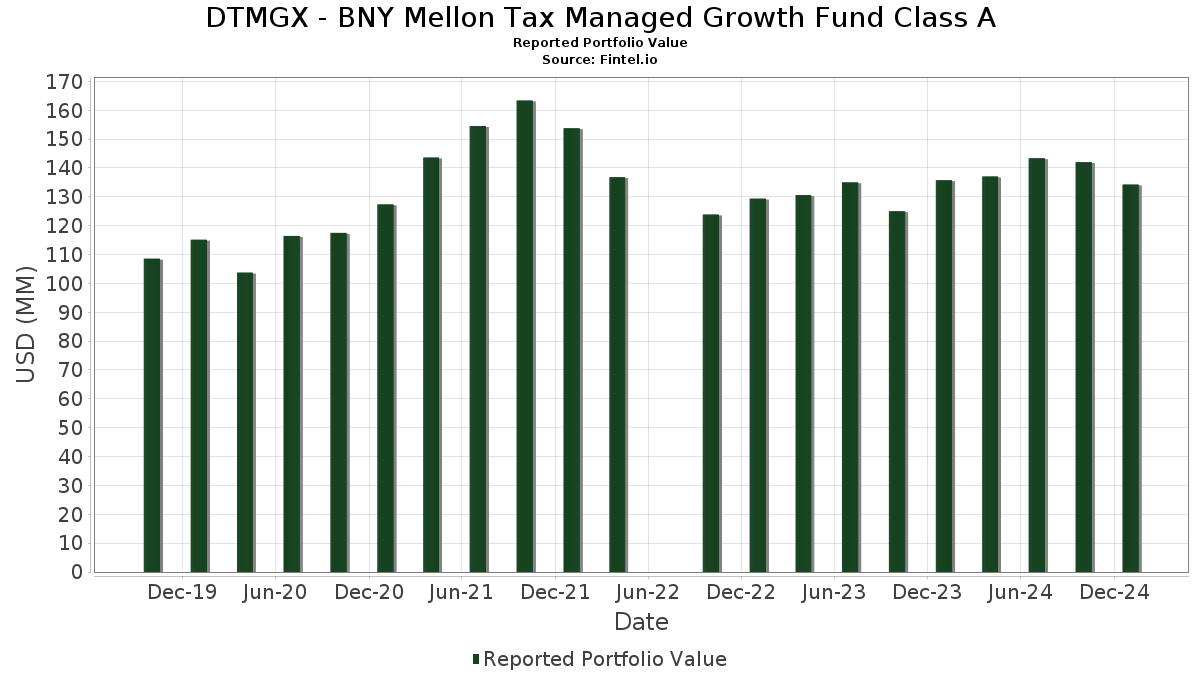
| Nilai Portfolio | $ 134,228,382 |
| Kedudukan Semasa | 48 |
Pegangan Terkini, Prestasi, AUM (dari 13F, 13D)
DTMGX - BNY Mellon Tax Managed Growth Fund Class A telah mendedahkan 48 jumlah pegangan dalam pemfailan SEC terkini mereka. Nilai portfolio terkini dikira sebagai $ 134,228,382 USD. Aset Sebenar Di Bawah Pengurusan (AUM) ialah nilai ini ditambah dengan tunai (yang tidak didedahkan). Pegangan teratas DTMGX - BNY Mellon Tax Managed Growth Fund Class A ialah Microsoft Corporation (US:MSFT) , Apple Inc. (US:AAPL) , Amazon.com, Inc. (US:AMZN) , Alphabet Inc. (US:GOOG) , and Visa Inc. (US:V) .
Kenaikan Teratas Suku Tahun Ini
Kami menggunakan perubahan dalam peruntukan portfolio kerana ini adalah metrik yang paling bermakna. Perubahan boleh disebabkan oleh perdagangan atau perubahan dalam harga saham.
| Sekuriti | Saham (MM) |
Nilai (MM$) |
Portfolio % | ΔPortfolio % |
|---|---|---|---|---|
| 0.04 | 9.40 | 7.0049 | 1.3708 | |
| 0.03 | 6.86 | 5.1082 | 0.7028 | |
| 0.64 | 0.64 | 0.4782 | 0.4782 | |
| 0.01 | 4.93 | 3.6737 | 0.2876 | |
| 0.01 | 2.96 | 2.2069 | 0.2606 | |
| 0.00 | 2.19 | 1.6324 | 0.2080 | |
| 0.02 | 6.42 | 4.7795 | 0.1876 | |
| 0.02 | 2.20 | 1.6407 | 0.1481 | |
| 0.01 | 2.64 | 1.9649 | 0.1416 | |
| 0.00 | 2.44 | 1.8160 | 0.1241 |
Penurunan Teratas Suku Tahun Ini
Kami menggunakan perubahan dalam peruntukan portfolio kerana ini adalah metrik yang paling bermakna. Perubahan boleh disebabkan oleh perdagangan atau perubahan dalam harga saham.
| Sekuriti | Saham (MM) |
Nilai (MM$) |
Portfolio % | ΔPortfolio % |
|---|---|---|---|---|
| 0.05 | 4.23 | 3.1482 | -1.3064 | |
| 0.03 | 11.12 | 8.2808 | -0.5807 | |
| 0.02 | 4.53 | 3.3723 | -0.4940 | |
| 0.01 | 1.42 | 1.0586 | -0.3878 | |
| 0.01 | 4.62 | 3.4434 | -0.2485 | |
| 0.01 | 1.41 | 1.0513 | -0.1814 | |
| 0.04 | 4.44 | 3.3097 | -0.1785 | |
| 0.02 | 1.94 | 1.4445 | -0.1713 | |
| 0.00 | 1.52 | 1.1357 | -0.0915 | |
| 0.04 | 2.41 | 1.7934 | -0.0704 |
13F dan Pemfailan Dana
Borang ini telah difailkan pada 2025-03-25 untuk tempoh pelaporan 2025-01-31. Klik ikon pautan untuk melihat sejarah transaksi penuh.
Tingkatkan untuk membuka data premium dan eksport ke Excel ![]() .
.
| Sekuriti | Jenis | Purata Harga Saham | Saham (MM) |
ΔSaham (%) |
ΔSaham (%) |
Nilai ($MM) |
Portfolio (%) |
ΔPortfolio (%) |
|
|---|---|---|---|---|---|---|---|---|---|
| MSFT / Microsoft Corporation | 0.03 | -12.80 | 11.12 | -10.93 | 8.2808 | -0.5807 | |||
| AAPL / Apple Inc. | 0.05 | -8.90 | 11.00 | -4.83 | 8.1966 | -0.0129 | |||
| AMZN / Amazon.com, Inc. | 0.04 | -7.06 | 9.40 | 18.50 | 7.0049 | 1.3708 | |||
| GOOG / Alphabet Inc. | 0.03 | -7.17 | 6.86 | 10.53 | 5.1082 | 0.7028 | |||
| V / Visa Inc. | 0.02 | -15.87 | 6.42 | -0.79 | 4.7795 | 0.1876 | |||
| ASML / ASML Holding N.V. - Depositary Receipt (Common Stock) | 0.01 | -5.92 | 4.93 | 3.42 | 3.6737 | 0.2876 | |||
| UNH / UnitedHealth Group Incorporated | 0.01 | -7.49 | 4.62 | -11.10 | 3.4434 | -0.2485 | |||
| TXN / Texas Instruments Incorporated | 0.02 | -8.51 | 4.53 | -16.86 | 3.3723 | -0.4940 | |||
| NVDA / NVIDIA Corporation | 0.04 | 0.00 | 4.44 | -9.57 | 3.3097 | -0.1785 | |||
| BLK / BlackRock, Inc. | 0.00 | -10.39 | 4.31 | -1.78 | 3.2130 | 0.0955 | |||
| NVO / Novo Nordisk A/S - Depositary Receipt (Common Stock) | 0.05 | -10.70 | 4.23 | -32.65 | 3.1482 | -1.3064 | |||
| CVX / Chevron Corporation | 0.02 | -6.87 | 3.36 | -6.66 | 2.5069 | -0.0527 | |||
| PGR / The Progressive Corporation | 0.01 | -6.98 | 3.09 | -5.60 | 2.2986 | -0.0224 | |||
| ISRG / Intuitive Surgical, Inc. | 0.01 | -4.78 | 2.96 | 8.10 | 2.2069 | 0.2606 | |||
| MCD / McDonald's Corporation | 0.01 | -6.41 | 2.78 | -7.48 | 2.0734 | -0.0632 | |||
| NOW / ServiceNow, Inc. | 0.00 | -7.50 | 2.64 | 0.96 | 1.9650 | 0.1099 | |||
| TSM / Taiwan Semiconductor Manufacturing Company Limited - Depositary Receipt (Common Stock) | 0.01 | -6.49 | 2.64 | 2.73 | 1.9649 | 0.1416 | |||
| INTU / Intuit Inc. | 0.00 | -3.91 | 2.58 | -5.32 | 1.9247 | -0.0125 | |||
| SPGI / S&P Global Inc. | 0.00 | -5.75 | 2.44 | 2.31 | 1.8160 | 0.1241 | |||
| ICE / Intercontinental Exchange, Inc. | 0.02 | -7.74 | 2.43 | -5.41 | 1.8093 | -0.0137 | |||
| BAESY / BAE Systems plc - Depositary Receipt (Common Stock) | 0.04 | -2.76 | 2.41 | -8.27 | 1.7934 | -0.0704 | |||
| ABT / Abbott Laboratories | 0.02 | -7.15 | 2.20 | 4.81 | 1.6407 | 0.1481 | |||
| MA / Mastercard Incorporated | 0.00 | -1.74 | 2.19 | 9.28 | 1.6324 | 0.2080 | |||
| XOM / Exxon Mobil Corporation | 0.02 | -6.85 | 1.94 | -14.81 | 1.4445 | -0.1713 | |||
| CP / Canadian Pacific Kansas City Limited | 0.02 | -5.45 | 1.73 | -2.42 | 1.2904 | 0.0294 | |||
| KO / The Coca-Cola Company | 0.03 | -7.02 | 1.63 | -9.67 | 1.2121 | -0.0663 | |||
| SHW / The Sherwin-Williams Company | 0.00 | -5.35 | 1.62 | -5.49 | 1.2047 | -0.0105 | |||
| HD / The Home Depot, Inc. | 0.00 | -6.22 | 1.61 | -1.88 | 1.2031 | 0.0344 | |||
| CME / CME Group Inc. | 0.01 | -2.10 | 1.60 | 2.77 | 1.1903 | 0.0861 | |||
| ADBE / Adobe Inc. | 0.00 | -3.60 | 1.52 | -11.81 | 1.1357 | -0.0915 | |||
| MAR / Marriott International, Inc. | 0.00 | -15.72 | 1.43 | -5.82 | 1.0619 | -0.0128 | |||
| PEP / PepsiCo, Inc. | 0.01 | -23.11 | 1.42 | -30.21 | 1.0586 | -0.3878 | |||
| UNP / Union Pacific Corporation | 0.01 | -23.86 | 1.41 | -18.67 | 1.0513 | -0.1814 | |||
| ADP / Automatic Data Processing, Inc. | 0.00 | -3.80 | 1.38 | 0.80 | 1.0282 | 0.0557 | |||
| CSGP / CoStar Group, Inc. | 0.02 | -1.95 | 1.35 | 3.22 | 1.0044 | 0.0765 | |||
| LLY / Eli Lilly and Company | 0.00 | 0.00 | 1.30 | -2.26 | 0.9668 | 0.0241 | |||
| LVMUY / LVMH Moët Hennessy - Louis Vuitton, Société Européenne - Depositary Receipt (Common Stock) | 0.01 | -1.40 | 1.28 | 8.31 | 0.9522 | 0.1143 | |||
| ZTS / Zoetis Inc. | 0.01 | -1.52 | 1.16 | -5.91 | 0.8670 | -0.0108 | |||
| NKE / NIKE, Inc. | 0.01 | -4.61 | 1.12 | -4.92 | 0.8350 | -0.0019 | |||
| AZN / AstraZeneca PLC - Depositary Receipt (Common Stock) | 0.01 | -1.77 | 1.04 | -2.34 | 0.7768 | 0.0189 | |||
| IT / Gartner, Inc. | 0.00 | 0.00 | 0.99 | 7.96 | 0.7380 | 0.0868 | |||
| PG / The Procter & Gamble Company | 0.01 | -0.42 | 0.98 | 0.00 | 0.7315 | 0.0347 | |||
| VRSK / Verisk Analytics, Inc. | 0.00 | -4.85 | 0.93 | -0.54 | 0.6927 | 0.0295 | |||
| ODFL / Old Dominion Freight Line, Inc. | 0.00 | -1.46 | 0.88 | -9.21 | 0.6541 | -0.0322 | |||
| EOG / EOG Resources, Inc. | 0.01 | -0.42 | 0.75 | 2.75 | 0.5576 | 0.0401 | |||
| DREYFUS INSTITUTIONAL PREFERRED GOVERNMENT PLUS MONEY MARKET FUND / STIV (000000000) | 0.64 | 0.64 | 0.4782 | 0.4782 | |||||
| OTIS / Otis Worldwide Corporation | 0.01 | -2.08 | 0.58 | -4.89 | 0.4351 | -0.0008 | |||
| DE / Deere & Company | 0.00 | 0.00 | 0.36 | 17.82 | 0.2663 | 0.0507 |