Statistik Asas
| Nilai Portfolio | $ 8,507,533,393 |
| Kedudukan Semasa | 154 |
Pegangan Terkini, Prestasi, AUM (dari 13F, 13D)
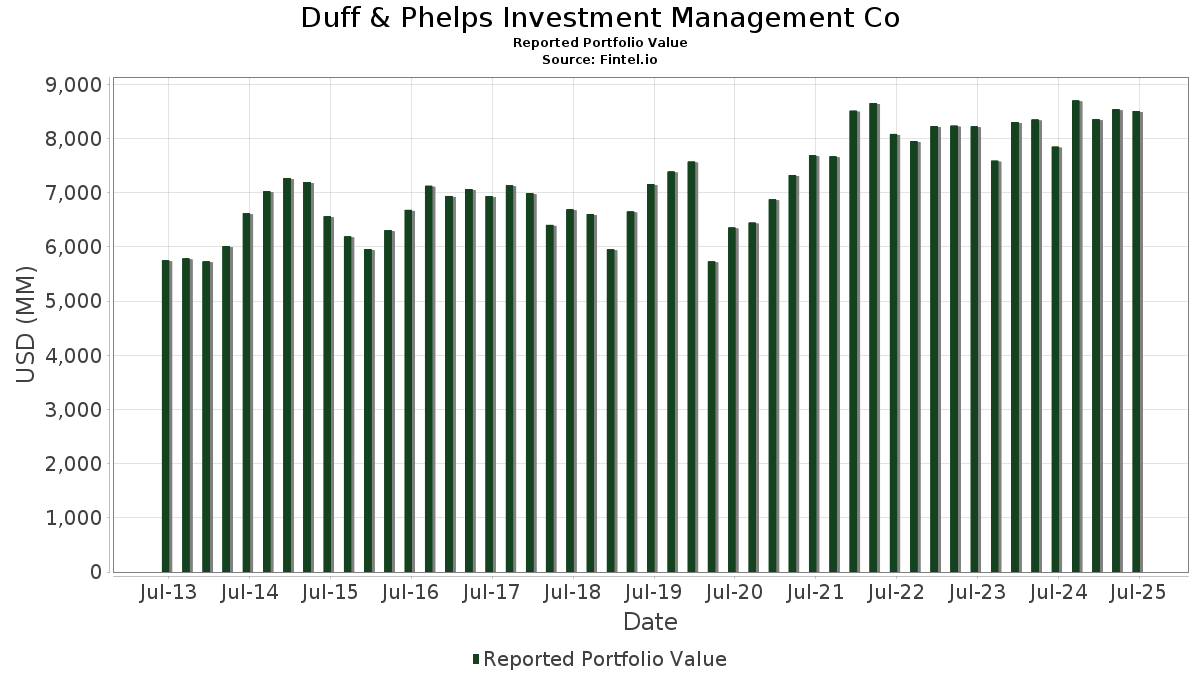
Duff & Phelps Investment Management Co telah mendedahkan 154 jumlah pegangan dalam pemfailan SEC terkini mereka. Nilai portfolio terkini dikira sebagai $ 8,507,533,393 USD. Aset Sebenar Di Bawah Pengurusan (AUM) ialah nilai ini ditambah dengan tunai (yang tidak didedahkan). Pegangan teratas Duff & Phelps Investment Management Co ialah Welltower Inc. (US:WELL) , Equinix, Inc. (US:EQIX) , Prologis, Inc. (US:PLD) , Digital Realty Trust, Inc. (US:DLR) , and American Tower Corporation (US:AMT) . Kedudukan baharu Duff & Phelps Investment Management Co termasuk SmartStop Self Storage REIT, Inc. (US:SMA) , American Healthcare REIT, Inc. (US:AHR) , Ormat Technologies, Inc. (US:ORA) , .
Kenaikan Teratas Suku Tahun Ini
Kami menggunakan perubahan dalam peruntukan portfolio kerana ini adalah metrik yang paling bermakna. Perubahan boleh disebabkan oleh perdagangan atau perubahan dalam harga saham.
| Sekuriti | Saham (MM) |
Nilai (MM$) |
Portfolio % | ΔPortfolio % |
|---|---|---|---|---|
| 1.37 | 239.13 | 2.8108 | 0.5021 | |
| 1.47 | 151.04 | 1.7754 | 0.4342 | |
| 0.96 | 34.65 | 0.4073 | 0.4073 | |
| 0.80 | 26.04 | 0.3061 | 0.3061 | |
| 2.48 | 72.81 | 0.8558 | 0.2806 | |
| 2.60 | 180.39 | 2.1204 | 0.2309 | |
| 0.18 | 18.35 | 0.2157 | 0.2157 | |
| 2.04 | 154.33 | 1.8140 | 0.1906 | |
| 1.03 | 75.23 | 0.8842 | 0.1729 | |
| 0.20 | 14.91 | 0.1752 | 0.1698 |
Penurunan Teratas Suku Tahun Ini
Kami menggunakan perubahan dalam peruntukan portfolio kerana ini adalah metrik yang paling bermakna. Perubahan boleh disebabkan oleh perdagangan atau perubahan dalam harga saham.
| Sekuriti | Saham (MM) |
Nilai (MM$) |
Portfolio % | ΔPortfolio % |
|---|---|---|---|---|
| 0.77 | 62.67 | 0.7366 | -0.6125 | |
| 0.09 | 19.97 | 0.2348 | -0.2625 | |
| 1.12 | 116.63 | 1.3708 | -0.2521 | |
| 0.50 | 86.28 | 1.0142 | -0.2336 | |
| 2.77 | 174.76 | 2.0542 | -0.2197 | |
| 2.97 | 312.14 | 3.6689 | -0.2125 | |
| 3.60 | 132.14 | 1.5532 | -0.2022 | |
| 5.16 | 71.92 | 0.8453 | -0.1935 | |
| 2.92 | 104.01 | 1.2226 | -0.1870 | |
| 2.14 | 79.58 | 0.9354 | -0.1819 |
13F dan Pemfailan Dana
Borang ini telah difailkan pada 2025-08-11 untuk tempoh pelaporan 2025-06-30. Klik ikon pautan untuk melihat sejarah transaksi penuh.
Tingkatkan untuk membuka data premium dan eksport ke Excel ![]() .
.
| Sekuriti | Jenis | Purata Harga Saham | Saham (MM) |
ΔSaham (%) |
ΔSaham (%) |
Nilai ($MM) |
Portfolio (%) |
ΔPortfolio (%) |
|
|---|---|---|---|---|---|---|---|---|---|
| WELL / Welltower Inc. | 2.51 | 1.33 | 385.81 | 1.67 | 4.5349 | 0.0915 | |||
| EQIX / Equinix, Inc. | 0.41 | 3.09 | 324.36 | 0.58 | 3.8126 | 0.0363 | |||
| PLD / Prologis, Inc. | 2.97 | 0.14 | 312.14 | -5.83 | 3.6689 | -0.2125 | |||
| DLR / Digital Realty Trust, Inc. | 1.37 | -0.31 | 239.13 | 21.29 | 2.8108 | 0.5021 | |||
| AMT / American Tower Corporation | 0.88 | -1.47 | 194.03 | 0.08 | 2.2806 | 0.0105 | |||
| NEE / NextEra Energy, Inc. | 2.60 | 14.16 | 180.39 | 11.80 | 2.1204 | 0.2309 | |||
| AVB / AvalonBay Communities, Inc. | 0.88 | 4.14 | 178.82 | -1.26 | 2.1019 | -0.0187 | |||
| VTR / Ventas, Inc. | 2.77 | -2.01 | 174.76 | -10.00 | 2.0542 | -0.2197 | |||
| SRE / Sempra | 2.04 | 4.84 | 154.33 | 11.32 | 1.8140 | 0.1906 | |||
| AMH / American Homes 4 Rent | 4.24 | 0.20 | 152.78 | -4.42 | 1.7959 | -0.0758 | |||
| IRM / Iron Mountain Incorporated | 1.47 | 10.62 | 151.04 | 31.88 | 1.7754 | 0.4342 | |||
| XEL / Xcel Energy Inc. | 2.21 | 11.64 | 150.26 | 7.40 | 1.7663 | 0.1279 | |||
| PSA / Public Storage | 0.51 | -2.45 | 150.02 | -4.36 | 1.7634 | -0.0735 | |||
| SPG / Simon Property Group, Inc. | 0.86 | 0.44 | 138.19 | -2.78 | 1.6243 | -0.0401 | |||
| AEE / Ameren Corporation | 1.40 | -0.04 | 134.19 | -4.38 | 1.5773 | -0.0661 | |||
| EVRG / Evergy, Inc. | 1.95 | -0.05 | 134.07 | -0.08 | 1.5759 | 0.0048 | |||
| NI / NiSource Inc. | 3.32 | -6.14 | 133.86 | -5.56 | 1.5735 | -0.0863 | |||
| CNP / CenterPoint Energy, Inc. | 3.60 | -13.08 | 132.14 | -11.85 | 1.5532 | -0.2022 | |||
| ETR / Entergy Corporation | 1.55 | -0.05 | 129.16 | -2.82 | 1.5182 | -0.0381 | |||
| WMB / The Williams Companies, Inc. | 2.04 | 0.15 | 128.19 | 5.26 | 1.5067 | 0.0808 | |||
| SO / The Southern Company | 1.35 | 3.47 | 123.60 | 3.33 | 1.4528 | 0.0522 | |||
| DUK / Duke Energy Corporation | 1.04 | 4.26 | 123.08 | 0.87 | 1.4467 | 0.0179 | |||
| WEC / WEC Energy Group, Inc. | 1.12 | -11.99 | 116.63 | -15.85 | 1.3708 | -0.2521 | |||
| LNT / Alliant Energy Corporation | 1.91 | -0.48 | 115.31 | -6.48 | 1.3553 | -0.0885 | |||
| LNG / Cheniere Energy, Inc. | 0.47 | -14.54 | 114.90 | -10.07 | 1.3506 | -0.1455 | |||
| ATO / Atmos Energy Corporation | 0.75 | -8.38 | 114.84 | -8.66 | 1.3499 | -0.1223 | |||
| CCI / Crown Castle Inc. | 1.09 | 0.77 | 112.23 | -0.68 | 1.3192 | -0.0040 | |||
| BRX / Brixmor Property Group Inc. | 4.21 | 0.08 | 109.51 | -1.84 | 1.2872 | -0.0192 | |||
| MAA / Mid-America Apartment Communities, Inc. | 0.73 | 23.78 | 107.35 | 9.32 | 1.2618 | 0.1120 | |||
| REXR / Rexford Industrial Realty, Inc. | 2.92 | -4.90 | 104.01 | -13.60 | 1.2226 | -0.1870 | |||
| PPL / PPL Corporation | 3.01 | -0.06 | 102.01 | -6.21 | 1.1991 | -0.0745 | |||
| CMS / CMS Energy Corporation | 1.45 | 5.18 | 100.71 | -2.98 | 1.1838 | -0.0318 | |||
| DTE / DTE Energy Company | 0.73 | 0.00 | 96.37 | -4.20 | 1.1328 | -0.0452 | |||
| MPLX / MPLX LP - Limited Partnership | 1.83 | -4.98 | 94.41 | -8.55 | 1.1097 | -0.0991 | |||
| CUBE / CubeSmart | 2.22 | 1.64 | 94.33 | 1.14 | 1.1088 | 0.0166 | |||
| TRP / TC Energy Corporation | 1.89 | -0.10 | 92.37 | 3.24 | 1.0858 | 0.0381 | |||
| OGE / OGE Energy Corp. | 2.08 | -0.04 | 92.23 | -3.47 | 1.0841 | -0.0348 | |||
| ET / Energy Transfer LP - Limited Partnership | 5.05 | 0.94 | 91.48 | -1.56 | 1.0753 | -0.0128 | |||
| T / AT&T Inc. | 3.08 | 0.00 | 89.12 | 2.33 | 1.0476 | 0.0278 | |||
| ELS / Equity LifeStyle Properties, Inc. | 1.44 | 2.13 | 88.57 | -5.57 | 1.0410 | -0.0573 | |||
| PEG / Public Service Enterprise Group Incorporated | 1.05 | 1.96 | 88.01 | 4.29 | 1.0345 | 0.0463 | |||
| TRGP / Targa Resources Corp. | 0.50 | -6.75 | 86.28 | -19.03 | 1.0142 | -0.2336 | |||
| ESS / Essex Property Trust, Inc. | 0.30 | 1.98 | 84.24 | -5.73 | 0.9902 | -0.0562 | |||
| WTRG / Essential Utilities, Inc. | 2.14 | -11.23 | 79.58 | -16.59 | 0.9354 | -0.1819 | |||
| AEP / American Electric Power Company, Inc. | 0.76 | 0.00 | 79.08 | -5.04 | 0.9296 | -0.0457 | |||
| EPRT / Essential Properties Realty Trust, Inc. | 2.39 | 7.62 | 76.33 | 5.21 | 0.8972 | 0.0477 | |||
| SR / Spire Inc. | 1.03 | 32.75 | 75.23 | 23.83 | 0.8842 | 0.1729 | |||
| KMI / Kinder Morgan, Inc. | 2.48 | 43.83 | 72.81 | 48.21 | 0.8558 | 0.2806 | |||
| PCG / PG&E Corporation | 5.16 | -0.09 | 71.92 | -18.93 | 0.8453 | -0.1935 | |||
| D / Dominion Energy, Inc. | 1.24 | 0.00 | 70.01 | 0.80 | 0.8229 | 0.0096 | |||
| RHP / Ryman Hospitality Properties, Inc. | 0.67 | 2.95 | 66.53 | 11.09 | 0.7820 | 0.0807 | |||
| AWK / American Water Works Company, Inc. | 0.47 | -11.41 | 65.11 | -16.46 | 0.7653 | -0.1473 | |||
| BXP / Boston Properties, Inc. | 0.96 | 1.83 | 64.89 | 2.25 | 0.7627 | 0.0196 | |||
| ENB / Enbridge Inc. | 1.38 | 0.37 | 62.76 | 2.65 | 0.7377 | 0.0218 | |||
| OKE / ONEOK, Inc. | 0.77 | -33.88 | 62.67 | -45.61 | 0.7366 | -0.6125 | |||
| VZ / Verizon Communications Inc. | 1.34 | 0.00 | 57.96 | -4.61 | 0.6813 | -0.0302 | |||
| PNW / Pinnacle West Capital Corporation | 0.62 | 0.00 | 55.91 | -6.07 | 0.6572 | -0.0398 | |||
| PBA / Pembina Pipeline Corporation | 1.43 | 0.42 | 53.51 | -5.91 | 0.6290 | -0.0370 | |||
| PECO / Phillips Edison & Company, Inc. | 1.52 | 0.95 | 53.35 | -3.08 | 0.6271 | -0.0175 | |||
| CUZ / Cousins Properties Incorporated | 1.77 | 10.23 | 53.14 | 12.20 | 0.6246 | 0.0701 | |||
| FE / FirstEnergy Corp. | 1.30 | 14.58 | 52.52 | 14.13 | 0.6173 | 0.0785 | |||
| VNO / Vornado Realty Trust | 1.33 | 0.85 | 50.76 | 4.26 | 0.5966 | 0.0265 | |||
| XYL / Xylem Inc. | 0.39 | 1.47 | 50.75 | 9.88 | 0.5965 | 0.0557 | |||
| DTM / DT Midstream, Inc. | 0.46 | 18.99 | 50.37 | 35.56 | 0.5921 | 0.1570 | |||
| SBRA / Sabra Health Care REIT, Inc. | 2.55 | 0.63 | 47.01 | 6.22 | 0.5526 | 0.0343 | |||
| FTS / Fortis Inc. | 0.98 | 0.00 | 46.79 | 4.62 | 0.5500 | 0.0263 | |||
| TU / TELUS Corporation | 2.67 | 0.00 | 42.74 | 11.77 | 0.5024 | 0.0546 | |||
| OGS / ONE Gas, Inc. | 0.58 | 0.00 | 41.39 | -4.93 | 0.4865 | -0.0233 | |||
| HST / Host Hotels & Resorts, Inc. | 2.68 | 6.96 | 41.15 | 15.61 | 0.4837 | 0.0669 | |||
| KEY / Keyera Corp. | 1.24 | 20.39 | 40.56 | 26.45 | 0.4768 | 0.1012 | |||
| EPD / Enterprise Products Partners L.P. - Limited Partnership | 1.29 | -9.65 | 40.02 | -17.94 | 0.4704 | -0.1006 | |||
| GLPI / Gaming and Leisure Properties, Inc. | 0.83 | 1.14 | 38.69 | -7.25 | 0.4547 | -0.0337 | |||
| NWN / Northwest Natural Holding Company | 0.94 | 20.66 | 37.36 | 12.18 | 0.4391 | 0.0492 | |||
| SMA / SmartStop Self Storage REIT, Inc. | 0.96 | 34.65 | 0.4073 | 0.4073 | |||||
| PAA / Plains All American Pipeline, L.P. - Limited Partnership | 1.86 | -15.09 | 34.02 | -22.22 | 0.3999 | -0.1123 | |||
| VLTO / Veralto Corporation | 0.33 | 15.00 | 33.74 | 19.13 | 0.3966 | 0.0649 | |||
| COLD / Americold Realty Trust, Inc. | 1.95 | -1.68 | 32.40 | -23.81 | 0.3809 | -0.1171 | |||
| CP / Canadian Pacific Kansas City Limited | 0.39 | 16.31 | 31.19 | 31.42 | 0.3667 | 0.0887 | |||
| SBS / Companhia de Saneamento Básico do Estado de São Paulo - SABESP - Depositary Receipt (Common Stock) | 1.36 | -0.96 | 29.91 | 21.83 | 0.3515 | 0.0641 | |||
| BCE / BCE Inc. | 1.22 | 0.00 | 26.97 | -3.44 | 0.3170 | -0.0101 | |||
| CSX / CSX Corporation | 0.80 | 26.04 | 0.3061 | 0.3061 | |||||
| PNR / Pentair plc | 0.25 | 6.20 | 25.16 | 24.64 | 0.2957 | 0.0593 | |||
| VICI / VICI Properties Inc. | 0.76 | -1.86 | 24.69 | -1.92 | 0.2902 | -0.0046 | |||
| ECL / Ecolab Inc. | 0.09 | -2.39 | 23.82 | 3.74 | 0.2800 | 0.0111 | |||
| CNM / Core & Main, Inc. | 0.38 | 0.00 | 23.17 | 24.93 | 0.2723 | 0.0551 | |||
| BKH / Black Hills Corporation | 0.39 | 0.00 | 21.86 | -7.50 | 0.2570 | -0.0198 | |||
| LAMR / Lamar Advertising Company | 0.17 | 0.14 | 20.70 | 6.82 | 0.2433 | 0.0164 | |||
| UNP / Union Pacific Corporation | 0.09 | -51.71 | 19.97 | -52.97 | 0.2348 | -0.2625 | |||
| ES / Eversource Energy | 0.30 | 0.00 | 19.33 | 2.43 | 0.2272 | 0.0062 | |||
| CNI / Canadian National Railway Company | 0.18 | 18.35 | 0.2157 | 0.2157 | |||||
| KGS / Kodiak Gas Services, Inc. | 0.48 | 19.13 | 16.62 | 9.46 | 0.1954 | 0.0176 | |||
| ADC / Agree Realty Corporation | 0.20 | 3,300.83 | 14.91 | 3,119.65 | 0.1752 | 0.1698 | |||
| WMS / Advanced Drainage Systems, Inc. | 0.13 | -17.26 | 14.60 | -12.53 | 0.1716 | -0.0238 | |||
| GFL / GFL Environmental Inc. | 0.29 | -24.16 | 14.59 | -20.79 | 0.1715 | -0.0442 | |||
| VMI / Valmont Industries, Inc. | 0.04 | 153.78 | 14.52 | 190.42 | 0.1706 | 0.1121 | |||
| NSC / Norfolk Southern Corporation | 0.05 | -52.51 | 13.87 | -48.68 | 0.1631 | -0.1535 | |||
| ACM / AECOM | 0.12 | 39.27 | 13.33 | 69.51 | 0.1567 | 0.0646 | |||
| BMI / Badger Meter, Inc. | 0.05 | 0.00 | 13.12 | 28.75 | 0.1542 | 0.0349 | |||
| SPIB / SPDR Series Trust - SPDR Portfolio Intermediate Term Corporate Bond ETF | 0.37 | 1.50 | 12.51 | 2.53 | 0.1470 | 0.0042 | |||
| HTO / H2O America | 0.23 | 27.77 | 12.11 | 21.41 | 0.1423 | 0.0255 | |||
| MWA / Mueller Water Products, Inc. | 0.50 | 20.69 | 12.03 | 14.14 | 0.1414 | 0.0180 | |||
| TTEK / Tetra Tech, Inc. | 0.31 | 0.00 | 11.21 | 22.93 | 0.1318 | 0.0250 | |||
| SBAC / SBA Communications Corporation | 0.05 | -2.32 | 10.90 | 4.28 | 0.1281 | 0.0057 | |||
| O / Realty Income Corporation | 0.19 | -58.11 | 10.87 | -58.40 | 0.1278 | -0.1782 | |||
| STN / Stantec Inc. | 0.09 | -19.77 | 10.16 | 5.12 | 0.1194 | 0.0062 | |||
| KIM / Kimco Realty Corporation | 0.47 | -2.08 | 9.89 | -3.10 | 0.1163 | -0.0033 | |||
| IEX / IDEX Corporation | 0.05 | 72.68 | 9.35 | 67.53 | 0.1099 | 0.0445 | |||
| WTS / Watts Water Technologies, Inc. | 0.03 | 15.66 | 8.59 | 39.47 | 0.1010 | 0.0289 | |||
| VOD / Vodafone Group Public Limited Company - Depositary Receipt (Common Stock) | 0.68 | -12.78 | 7.27 | -0.78 | 0.0855 | -0.0003 | |||
| WM / Waste Management, Inc. | 0.03 | -28.75 | 6.74 | -29.58 | 0.0792 | -0.0329 | |||
| EIX / Edison International | 0.12 | -50.87 | 6.38 | -56.98 | 0.0750 | -0.0986 | |||
| SUN / Sunoco LP - Limited Partnership | 0.11 | 470.05 | 6.07 | 426.37 | 0.0713 | 0.0578 | |||
| FELE / Franklin Electric Co., Inc. | 0.07 | 5.88 | 0.0691 | 0.0691 | |||||
| DHR / Danaher Corporation | 0.03 | 0.00 | 5.87 | -3.65 | 0.0690 | -0.0023 | |||
| TMO / Thermo Fisher Scientific Inc. | 0.01 | -18.53 | 5.80 | -33.61 | 0.0682 | -0.0341 | |||
| FERG / Ferguson Enterprises Inc. | 0.03 | -11.11 | 5.76 | 20.80 | 0.0677 | 0.0119 | |||
| WY / Weyerhaeuser Company | 0.22 | 42.21 | 5.61 | 24.78 | 0.0659 | 0.0133 | |||
| KEYERA CORP SUBSCRIPT RECEIPT / Master Ltd Part (493271118) | 0.17 | 5.60 | 0.0000 | ||||||
| ZWS / Zurn Elkay Water Solutions Corporation | 0.15 | -54.13 | 5.55 | -49.13 | 0.0652 | -0.0625 | |||
| FSLR / First Solar, Inc. | 0.03 | 55.89 | 4.50 | 104.13 | 0.0529 | 0.0271 | |||
| INVH / Invitation Homes Inc. | 0.13 | -6.53 | 4.32 | -12.02 | 0.0507 | -0.0067 | |||
| AHR / American Healthcare REIT, Inc. | 0.11 | 4.04 | 0.0475 | 0.0475 | |||||
| OMAB / Grupo Aeroportuario del Centro Norte, S.A.B. de C.V. - Depositary Receipt (Common Stock) | 0.03 | 0.00 | 3.59 | 34.19 | 0.0422 | 0.0109 | |||
| ERII / Energy Recovery, Inc. | 0.25 | 0.00 | 3.18 | -19.57 | 0.0374 | -0.0089 | |||
| GNR / SPDR Index Shares Funds - SPDR S&P Global Natural Resources ETF | 0.05 | 67.74 | 2.68 | 70.85 | 0.0315 | 0.0131 | |||
| EXR / Extra Space Storage Inc. | 0.02 | -11.85 | 2.52 | -12.50 | 0.0296 | -0.0041 | |||
| NXT / Nextracker Inc. | 0.04 | 31.69 | 2.18 | 69.97 | 0.0256 | 0.0106 | |||
| ARE / Alexandria Real Estate Equities, Inc. | 0.02 | -41.38 | 1.79 | -53.98 | 0.0210 | -0.0245 | |||
| CWEN / Clearway Energy, Inc. | 0.06 | 13.25 | 1.79 | 19.71 | 0.0210 | 0.0035 | |||
| PAGP / Plains GP Holdings, L.P. - Limited Partnership | 0.08 | -25.21 | 1.57 | -31.96 | 0.0185 | -0.0086 | |||
| BE / Bloom Energy Corporation | 0.07 | 138.19 | 1.56 | 189.80 | 0.0184 | 0.0121 | |||
| ENPH / Enphase Energy, Inc. | 0.04 | 13.21 | 1.40 | -27.65 | 0.0165 | -0.0062 | |||
| CEG / Constellation Energy Corporation | 0.00 | 66.96 | 1.22 | 167.25 | 0.0143 | 0.0090 | |||
| TEL / TE Connectivity plc | 0.01 | 9.25 | 1.21 | 30.41 | 0.0142 | 0.0033 | |||
| GDX / VanEck ETF Trust - VanEck Gold Miners ETF | 0.02 | 31.78 | 1.19 | 49.31 | 0.0140 | 0.0047 | |||
| SCHP / Schwab Strategic Trust - Schwab U.S. TIPS ETF | 0.04 | 349.68 | 1.12 | 346.00 | 0.0131 | 0.0102 | |||
| VCLN / Virtus ETF Trust II - Virtus Duff & Phelps Clean Energy ETF | 0.06 | 175.48 | 1.12 | 220.40 | 0.0131 | 0.0090 | |||
| EGP / EastGroup Properties, Inc. | 0.01 | 0.00 | 0.96 | -5.16 | 0.0112 | -0.0006 | |||
| HUBB / Hubbell Incorporated | 0.00 | 58.72 | 0.93 | 95.97 | 0.0109 | 0.0053 | |||
| DBC / Invesco DB Commodity Index Tracking Fund | 0.04 | 22.38 | 0.89 | 18.67 | 0.0105 | 0.0017 | |||
| GLNG / Golar LNG Limited | 0.02 | -24.63 | 0.86 | -18.29 | 0.0101 | -0.0022 | |||
| CCJ / Cameco Corporation | 0.01 | 5.52 | 0.84 | 90.50 | 0.0099 | 0.0047 | |||
| KNTK / Kinetik Holdings Inc. | 0.02 | -1.28 | 0.82 | -16.31 | 0.0096 | -0.0018 | |||
| ORA / Ormat Technologies, Inc. | 0.01 | 0.76 | 0.0089 | 0.0089 | |||||
| GEV / GE Vernova Inc. | 0.00 | 13.20 | 0.73 | 96.24 | 0.0086 | 0.0042 | |||
| MP / MP Materials Corp. | 0.02 | -31.46 | 0.70 | -6.57 | 0.0082 | -0.0005 | |||
| VLO / Valero Energy Corporation | 0.00 | -92.72 | 0.56 | -92.59 | 0.0066 | -0.0822 | |||
| DBA / Invesco DB Multi-Sector Commodity Trust - Invesco DB Agriculture Fund | 0.02 | 130.62 | 0.54 | 129.06 | 0.0063 | 0.0036 | |||
| RUN / Sunrun Inc. | 0.05 | 47.33 | 0.42 | 105.34 | 0.0050 | 0.0026 | |||
| GEI / Gibson Energy Inc. | 0.02 | 0.42 | 0.0050 | 0.0050 | |||||
| SEDG / SolarEdge Technologies, Inc. | 0.02 | 0.41 | 0.0048 | 0.0048 | |||||
| TRNO / Terreno Realty Corporation | 0.01 | 0.00 | 0.38 | -11.37 | 0.0045 | -0.0006 | |||
| PLUG / Plug Power Inc. | 0.22 | 13.21 | 0.32 | 25.10 | 0.0038 | 0.0008 | |||
| ARRY / Array Technologies, Inc. | 0.04 | 13.22 | 0.21 | 37.18 | 0.0025 | 0.0007 | |||
| HESM / Hess Midstream LP | 0.00 | -100.00 | 0.00 | 0.0000 | |||||
| AES / The AES Corporation | 0.00 | -100.00 | 0.00 | 0.0000 | |||||
| WES / Western Midstream Partners, LP - Limited Partnership | 0.00 | -100.00 | 0.00 | 0.0000 | |||||
| CWT / California Water Service Group | 0.00 | -100.00 | 0.00 | 0.0000 | |||||
| AWR / American States Water Company | 0.00 | -100.00 | 0.00 | 0.0000 | |||||
| RYN / Rayonier Inc. | 0.00 | -100.00 | 0.00 | 0.0000 | |||||
| GTLS / Chart Industries, Inc. | 0.00 | -100.00 | 0.00 | 0.0000 | |||||
| SOBO / South Bow Corporation | 0.00 | -100.00 | 0.00 | 0.0000 |