Statistik Asas
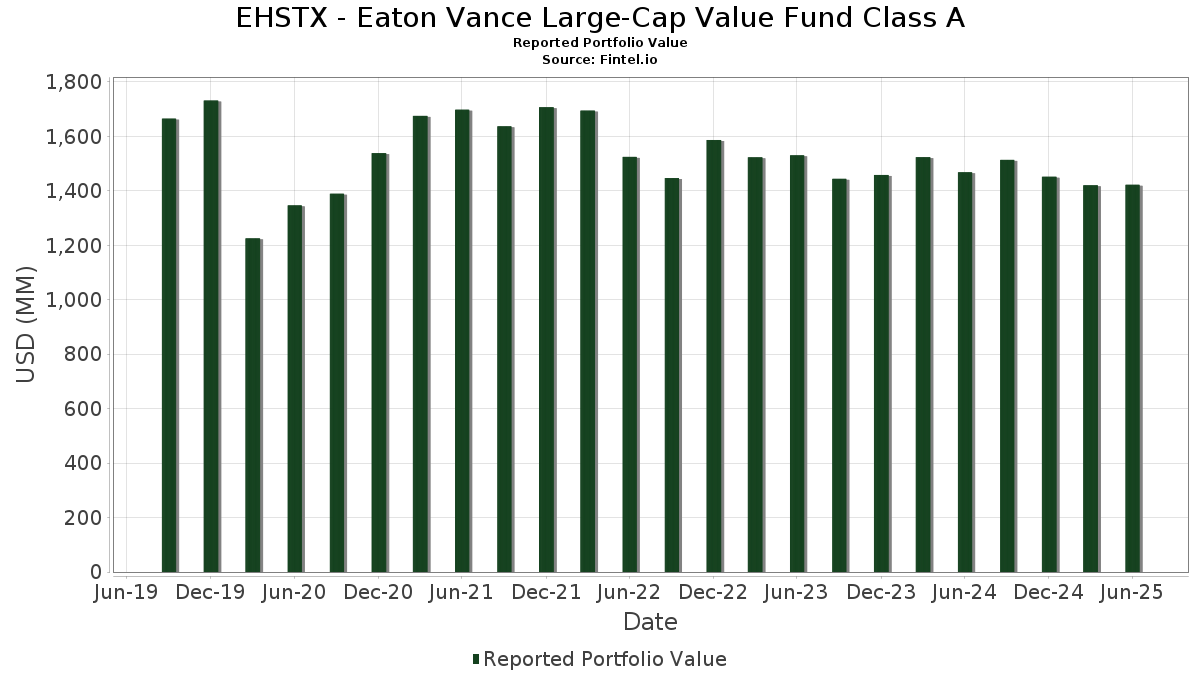
| Nilai Portfolio | $ 1,421,948,544 |
| Kedudukan Semasa | 68 |
Pegangan Terkini, Prestasi, AUM (dari 13F, 13D)
EHSTX - Eaton Vance Large-Cap Value Fund Class A telah mendedahkan 68 jumlah pegangan dalam pemfailan SEC terkini mereka. Nilai portfolio terkini dikira sebagai $ 1,421,948,544 USD. Aset Sebenar Di Bawah Pengurusan (AUM) ialah nilai ini ditambah dengan tunai (yang tidak didedahkan). Pegangan teratas EHSTX - Eaton Vance Large-Cap Value Fund Class A ialah Bank of America Corporation (US:BAC) , Amazon.com, Inc. (US:AMZN) , Morgan Stanley Institutional Liquidity Funds Government Portfolio, Institutional Class (US:US61747C7074) , Wells Fargo & Company (US:WFC) , and The Charles Schwab Corporation (US:SCHW) . Kedudukan baharu EHSTX - Eaton Vance Large-Cap Value Fund Class A termasuk Amazon.com, Inc. (US:AMZN) , Meta Platforms, Inc. (US:META) , Salesforce, Inc. (US:CRM) , Hess Corporation (US:HES) , and Pool Corporation (US:POOL) .
Kenaikan Teratas Suku Tahun Ini
Kami menggunakan perubahan dalam peruntukan portfolio kerana ini adalah metrik yang paling bermakna. Perubahan boleh disebabkan oleh perdagangan atau perubahan dalam harga saham.
| Sekuriti | Saham (MM) |
Nilai (MM$) |
Portfolio % | ΔPortfolio % |
|---|---|---|---|---|
| 0.21 | 45.83 | 3.2244 | 3.2244 | |
| 0.03 | 22.19 | 1.5611 | 1.5611 | |
| 0.08 | 20.99 | 1.4765 | 1.4765 | |
| 0.09 | 20.42 | 1.4367 | 1.4367 | |
| 0.03 | 18.86 | 1.3269 | 1.3269 | |
| 1.05 | 49.83 | 3.5056 | 1.2739 | |
| 0.43 | 38.94 | 2.7393 | 0.8582 | |
| 0.16 | 20.16 | 1.4180 | 0.6943 | |
| 0.24 | 25.37 | 1.7846 | 0.6851 | |
| 0.07 | 9.50 | 0.6685 | 0.6685 |
Penurunan Teratas Suku Tahun Ini
Kami menggunakan perubahan dalam peruntukan portfolio kerana ini adalah metrik yang paling bermakna. Perubahan boleh disebabkan oleh perdagangan atau perubahan dalam harga saham.
| Sekuriti | Saham (MM) |
Nilai (MM$) |
Portfolio % | ΔPortfolio % |
|---|---|---|---|---|
| 0.06 | 9.37 | 0.6595 | -1.5552 | |
| 0.00 | 0.00 | -1.4533 | ||
| 44.68 | 44.68 | 3.1429 | -1.1369 | |
| 0.28 | 30.52 | 2.1468 | -1.0326 | |
| 0.04 | 10.14 | 0.7136 | -0.7692 | |
| 0.25 | 11.56 | 0.8136 | -0.7420 | |
| 0.09 | 26.56 | 1.8682 | -0.7409 | |
| 0.15 | 18.22 | 1.2818 | -0.6396 | |
| 0.09 | 23.98 | 1.6872 | -0.6266 | |
| 0.23 | 28.03 | 1.9721 | -0.5630 |
13F dan Pemfailan Dana
Borang ini telah difailkan pada 2025-08-25 untuk tempoh pelaporan 2025-06-30. Klik ikon pautan untuk melihat sejarah transaksi penuh.
Tingkatkan untuk membuka data premium dan eksport ke Excel ![]() .
.
| Sekuriti | Jenis | Purata Harga Saham | Saham (MM) |
ΔSaham (%) |
ΔSaham (%) |
Nilai ($MM) |
Portfolio (%) |
ΔPortfolio (%) |
|
|---|---|---|---|---|---|---|---|---|---|
| BAC / Bank of America Corporation | 1.05 | 38.86 | 49.83 | 57.46 | 3.5056 | 1.2739 | |||
| AMZN / Amazon.com, Inc. | 0.21 | 45.83 | 3.2244 | 3.2244 | |||||
| US61747C7074 / Morgan Stanley Institutional Liquidity Funds Government Portfolio, Institutional Class | 44.68 | -26.39 | 44.68 | -26.39 | 3.1429 | -1.1369 | |||
| WFC / Wells Fargo & Company | 0.55 | -1.75 | 44.26 | 9.64 | 3.1138 | 0.2670 | |||
| SCHW / The Charles Schwab Corporation | 0.43 | 25.24 | 38.94 | 45.98 | 2.7393 | 0.8582 | |||
| AIG / American International Group, Inc. | 0.41 | -2.30 | 35.27 | -3.81 | 2.4815 | -0.1047 | |||
| ABT / Abbott Laboratories | 0.25 | 0.00 | 33.77 | 2.53 | 2.3757 | 0.0531 | |||
| MMM / 3M Company | 0.22 | -3.45 | 33.68 | 0.09 | 2.3697 | -0.0036 | |||
| RGA / Reinsurance Group of America, Incorporated | 0.16 | -4.05 | 31.94 | -3.34 | 2.2471 | -0.0833 | |||
| XOM / Exxon Mobil Corporation | 0.28 | -25.33 | 30.52 | -32.32 | 2.1468 | -1.0326 | |||
| CSCO / Cisco Systems, Inc. | 0.44 | -23.05 | 30.22 | -13.49 | 2.1262 | -0.3375 | |||
| CSX / CSX Corporation | 0.92 | 12.23 | 30.06 | 24.43 | 2.1145 | 0.4110 | |||
| DIS / The Walt Disney Company | 0.23 | -37.93 | 28.03 | -22.02 | 1.9721 | -0.5630 | |||
| EMR / Emerson Electric Co. | 0.21 | -17.75 | 27.70 | 0.02 | 1.9484 | -0.0044 | |||
| NEE / NextEra Energy, Inc. | 0.39 | -13.68 | 27.29 | -15.47 | 1.9199 | -0.3568 | |||
| MCD / McDonald's Corporation | 0.09 | -23.26 | 26.56 | -28.22 | 1.8682 | -0.7409 | |||
| LIN / Linde plc | 0.06 | -18.04 | 26.33 | -17.42 | 1.8521 | -0.3960 | |||
| BALL / Ball Corporation | 0.46 | 14.55 | 25.78 | 23.39 | 1.8138 | 0.3403 | |||
| BSX / Boston Scientific Corporation | 0.24 | 52.82 | 25.37 | 62.71 | 1.7846 | 0.6851 | |||
| MU / Micron Technology, Inc. | 0.20 | -42.27 | 24.64 | -18.11 | 1.7332 | -0.3884 | |||
| RYAN / Ryan Specialty Holdings, Inc. | 0.36 | 18.75 | 24.47 | 9.30 | 1.7213 | 0.1426 | |||
| TRV / The Travelers Companies, Inc. | 0.09 | -27.75 | 23.98 | -26.91 | 1.6872 | -0.6266 | |||
| EQT / EQT Corporation | 0.41 | 17.39 | 23.70 | 28.13 | 1.6671 | 0.3629 | |||
| TYIA / Johnson Controls International plc | 0.22 | -38.03 | 23.25 | -18.30 | 1.6357 | -0.3712 | |||
| META / Meta Platforms, Inc. | 0.03 | 22.19 | 1.5611 | 1.5611 | |||||
| USFD / US Foods Holding Corp. | 0.28 | 0.00 | 21.83 | 17.64 | 1.5360 | 0.2272 | |||
| CRM / Salesforce, Inc. | 0.08 | 20.99 | 1.4765 | 1.4765 | |||||
| LOW / Lowe's Companies, Inc. | 0.09 | 20.42 | 1.4367 | 1.4367 | |||||
| NBIX / Neurocrine Biosciences, Inc. | 0.16 | 72.84 | 20.16 | 96.43 | 1.4180 | 0.6943 | |||
| WMB / The Williams Companies, Inc. | 0.32 | 0.00 | 20.07 | 5.11 | 1.4121 | 0.0653 | |||
| GOOGL / Alphabet Inc. | 0.11 | -1.59 | 19.67 | 12.15 | 1.3840 | 0.1470 | |||
| FR / First Industrial Realty Trust, Inc. | 0.41 | 0.00 | 19.62 | -10.80 | 1.3801 | -0.1709 | |||
| ZTS / Zoetis Inc. | 0.13 | -21.29 | 19.53 | -25.45 | 1.3742 | -0.4736 | |||
| HII / Huntington Ingalls Industries, Inc. | 0.08 | 0.00 | 19.26 | 18.34 | 1.3552 | 0.2072 | |||
| CMS / CMS Energy Corporation | 0.28 | -19.05 | 19.10 | -25.34 | 1.3440 | -0.4604 | |||
| PRU / Prudential plc | 1.53 | 0.00 | 19.09 | 15.99 | 1.3433 | 0.1824 | |||
| GS / The Goldman Sachs Group, Inc. | 0.03 | 18.86 | 1.3269 | 1.3269 | |||||
| SRE / Sempra | 0.25 | 16.57 | 18.58 | 23.78 | 1.3072 | 0.2486 | |||
| MTD / Mettler-Toledo International Inc. | 0.02 | 23.29 | 18.39 | 22.64 | 1.2937 | 0.2363 | |||
| CLX / The Clorox Company | 0.15 | -17.99 | 18.22 | -33.12 | 1.2818 | -0.6396 | |||
| BJ / BJ's Wholesale Club Holdings, Inc. | 0.17 | -12.86 | 17.83 | -17.65 | 1.2542 | -0.2724 | |||
| INTC / Intel Corporation | 0.79 | 10.65 | 17.63 | 9.14 | 1.2400 | 0.1011 | |||
| UPS / United Parcel Service, Inc. | 0.17 | 27.63 | 17.56 | 17.13 | 1.2352 | 0.1781 | |||
| ABBV / AbbVie Inc. | 0.09 | -20.62 | 17.04 | -29.68 | 1.1991 | -0.5102 | |||
| AA / Alcoa Corporation | 0.55 | 38.07 | 16.31 | 33.59 | 1.1471 | 0.2864 | |||
| LAD / Lithia Motors, Inc. | 0.05 | -9.64 | 15.83 | 3.99 | 1.1134 | 0.0401 | |||
| STLD / Steel Dynamics, Inc. | 0.12 | -73.20 | 15.76 | -32.41 | 1.1090 | -0.2842 | |||
| GILD / Gilead Sciences, Inc. | 0.14 | 0.00 | 15.34 | -1.05 | 1.0793 | -0.0141 | |||
| HSY / The Hershey Company | 0.09 | 27.33 | 15.08 | 23.55 | 1.0611 | 0.2002 | |||
| IBKR / Interactive Brokers Group, Inc. | 0.26 | 402.20 | 14.44 | 68.05 | 1.0158 | 0.4099 | |||
| ON / ON Semiconductor Corporation | 0.27 | -25.00 | 14.19 | -3.40 | 0.9984 | -0.0376 | |||
| MTH / Meritage Homes Corporation | 0.20 | 1.82 | 13.66 | -3.80 | 0.9610 | -0.0404 | |||
| HAS / Hasbro, Inc. | 0.18 | -35.08 | 12.96 | -22.06 | 0.9115 | -0.2608 | |||
| NICE / NICE Ltd. - Depositary Receipt (Common Stock) | 0.07 | 107.72 | 12.32 | 127.60 | 0.8667 | 0.4850 | |||
| BKR / Baker Hughes Company | 0.30 | -2.45 | 11.69 | -14.91 | 0.8224 | -0.1464 | |||
| BMY / Bristol-Myers Squibb Company | 0.25 | -30.93 | 11.56 | -47.58 | 0.8136 | -0.7420 | |||
| GIS / General Mills, Inc. | 0.21 | 2.76 | 10.93 | -10.96 | 0.7688 | -0.0967 | |||
| CBOE / Cboe Global Markets, Inc. | 0.04 | -53.19 | 10.14 | -51.76 | 0.7136 | -0.7692 | |||
| EXC / Exelon Corporation | 0.23 | 0.00 | 9.96 | -5.77 | 0.7005 | -0.0447 | |||
| TTC / The Toro Company | 0.14 | 10.61 | 9.86 | 7.46 | 0.6933 | 0.0466 | |||
| IR / Ingersoll Rand Inc. | 0.12 | -1.26 | 9.70 | 2.62 | 0.6823 | 0.0158 | |||
| WAB / Westinghouse Air Brake Technologies Corporation | 0.05 | -31.63 | 9.64 | -21.07 | 0.6781 | -0.1831 | |||
| HES / Hess Corporation | 0.07 | 9.50 | 0.6685 | 0.6685 | |||||
| MAA / Mid-America Apartment Communities, Inc. | 0.06 | -66.20 | 9.37 | -70.15 | 0.6595 | -1.5552 | |||
| TW / Tradeweb Markets Inc. | 0.06 | 0.00 | 8.90 | -1.39 | 0.6259 | -0.0103 | |||
| MCK / McKesson Corporation | 0.01 | -32.66 | 8.42 | -26.68 | 0.5925 | -0.2175 | |||
| CUBE / CubeSmart | 0.18 | -31.43 | 7.82 | -13.29 | 0.5504 | -0.0363 | |||
| POOL / Pool Corporation | 0.02 | 6.39 | 0.4497 | 0.4497 | |||||
| IHF / iShares Trust - iShares U.S. Healthcare Providers ETF | 0.00 | -100.00 | 0.00 | -100.00 | -1.4533 |