Statistik Asas
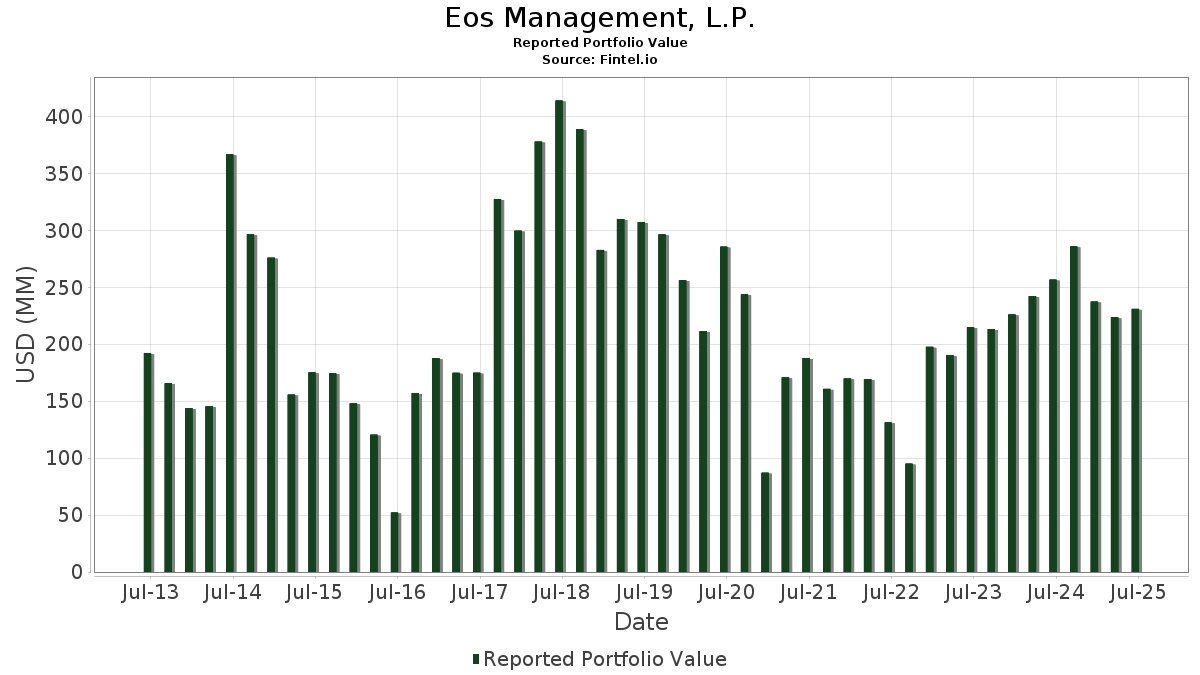
| Nilai Portfolio | $ 230,985,831 |
| Kedudukan Semasa | 38 |
Pegangan Terkini, Prestasi, AUM (dari 13F, 13D)
Eos Management, L.P. telah mendedahkan 38 jumlah pegangan dalam pemfailan SEC terkini mereka. Nilai portfolio terkini dikira sebagai $ 230,985,831 USD. Aset Sebenar Di Bawah Pengurusan (AUM) ialah nilai ini ditambah dengan tunai (yang tidak didedahkan). Pegangan teratas Eos Management, L.P. ialah SPDR S&P 500 ETF (US:SPY) , Berkshire Hathaway Inc. (US:BRK.B) , Meta Platforms, Inc. (US:META) , Microsoft Corporation (US:MSFT) , and O'Reilly Automotive, Inc. (US:ORLY) . Kedudukan baharu Eos Management, L.P. termasuk Booking Holdings Inc. (US:BKNG) , BWX Technologies, Inc. (US:BWXT) , Constellation Energy Corporation (US:CEG) , CONVERTIBLE ZERO (US:US009066AB74) , and UnitedHealth Group Incorporated (US:UNH) .
Kenaikan Teratas Suku Tahun Ini
Kami menggunakan perubahan dalam peruntukan portfolio kerana ini adalah metrik yang paling bermakna. Perubahan boleh disebabkan oleh perdagangan atau perubahan dalam harga saham.
| Sekuriti | Saham (MM) |
Nilai (MM$) |
Portfolio % | ΔPortfolio % |
|---|---|---|---|---|
| 0.11 | 68.42 | 29.6201 | 1.9063 | |
| 0.00 | 3.30 | 1.4286 | 1.4286 | |
| 0.02 | 2.92 | 1.2629 | 1.2629 | |
| 0.02 | 11.65 | 5.0444 | 1.1102 | |
| 0.02 | 11.97 | 5.1836 | 1.0005 | |
| 0.01 | 2.12 | 0.9178 | 0.9178 | |
| 0.05 | 7.25 | 3.1395 | 0.9138 | |
| 0.00 | 1.57 | 0.6800 | 0.6800 | |
| 0.02 | 7.12 | 3.0813 | 0.6712 | |
| 0.00 | 1.51 | 0.6541 | 0.6541 |
Penurunan Teratas Suku Tahun Ini
Kami menggunakan perubahan dalam peruntukan portfolio kerana ini adalah metrik yang paling bermakna. Perubahan boleh disebabkan oleh perdagangan atau perubahan dalam harga saham.
| Sekuriti | Saham (MM) |
Nilai (MM$) |
Portfolio % | ΔPortfolio % |
|---|---|---|---|---|
| 0.03 | 5.04 | 2.1837 | -1.5370 | |
| 0.03 | 16.15 | 6.9926 | -0.9300 | |
| 0.00 | 0.00 | -0.8414 | ||
| 0.03 | 7.60 | 3.2908 | -0.6712 | |
| 0.01 | 4.43 | 1.9189 | -0.5816 | |
| 0.03 | 7.15 | 3.0936 | -0.3677 | |
| 0.07 | 7.76 | 3.3606 | -0.2543 | |
| 0.05 | 1.73 | 0.7473 | -0.2256 | |
| 0.01 | 6.67 | 2.8857 | -0.2161 | |
| 0.01 | 3.54 | 1.5314 | -0.0781 |
13F dan Pemfailan Dana
Borang ini telah difailkan pada 2025-07-29 untuk tempoh pelaporan 2025-06-30. Klik ikon pautan untuk melihat sejarah transaksi penuh.
Tingkatkan untuk membuka data premium dan eksport ke Excel ![]() .
.
| Sekuriti | Jenis | Purata Harga Saham | Saham (MM) |
ΔSaham (%) |
ΔSaham (%) |
Nilai ($MM) |
Portfolio (%) |
ΔPortfolio (%) |
|
|---|---|---|---|---|---|---|---|---|---|
| SPY / SPDR S&P 500 ETF | 0.11 | 0.00 | 68.42 | 10.45 | 29.6201 | 1.9063 | |||
| BRK.B / Berkshire Hathaway Inc. | 0.03 | 0.00 | 16.15 | -8.79 | 6.9926 | -0.9300 | |||
| META / Meta Platforms, Inc. | 0.02 | 0.00 | 11.97 | 28.07 | 5.1836 | 1.0005 | |||
| MSFT / Microsoft Corporation | 0.02 | 0.00 | 11.65 | 32.50 | 5.0444 | 1.1102 | |||
| ORLY / O'Reilly Automotive, Inc. | 0.09 | 1,878.82 | 7.96 | 24.51 | 3.4445 | 0.5853 | |||
| BABA / Alibaba Group Holding Limited - Depositary Receipt (Common Stock) | 0.07 | 12.02 | 7.76 | -3.92 | 3.3606 | -0.2543 | |||
| AMZN / Amazon.com, Inc. | 0.03 | -25.56 | 7.60 | -14.16 | 3.2908 | -0.6712 | |||
| NVDA / NVIDIA Corporation | 0.05 | 0.00 | 7.25 | 45.78 | 3.1395 | 0.9138 | |||
| JPM / JPMorgan Chase & Co. | 0.03 | 0.00 | 7.25 | 18.18 | 3.1377 | 0.3941 | |||
| AAPL / Apple Inc. | 0.03 | 0.00 | 7.15 | -7.64 | 3.0936 | -0.3677 | |||
| APP / AppLovin Corporation | 0.02 | 0.00 | 7.12 | 32.11 | 3.0813 | 0.6712 | |||
| ROP / Roper Technologies, Inc. | 0.01 | 0.00 | 6.67 | -3.85 | 2.8857 | -0.2161 | |||
| TDG / TransDigm Group Incorporated | 0.00 | 0.00 | 6.55 | 9.93 | 2.8367 | 0.1700 | |||
| HEI / HEICO Corporation | 0.02 | 0.00 | 5.10 | 22.77 | 2.2058 | 0.3489 | |||
| DHR / Danaher Corporation | 0.03 | -37.06 | 5.04 | -39.36 | 2.1837 | -1.5370 | |||
| GOOGL / Alphabet Inc. | 0.03 | 0.00 | 4.62 | 13.98 | 2.0019 | 0.1865 | |||
| WAT / Waters Corporation | 0.01 | -16.26 | 4.43 | -20.69 | 1.9189 | -0.5816 | |||
| SHW / The Sherwin-Williams Company | 0.01 | 0.00 | 3.54 | -1.67 | 1.5314 | -0.0781 | |||
| BKNG / Booking Holdings Inc. | 0.00 | 3.30 | 1.4286 | 1.4286 | |||||
| DOV / Dover Corporation | 0.02 | 0.00 | 3.10 | 4.28 | 1.3407 | 0.0123 | |||
| GOOG / Alphabet Inc. | 0.02 | 0.00 | 3.00 | 13.52 | 1.2979 | 0.1166 | |||
| BWXT / BWX Technologies, Inc. | 0.02 | 2.92 | 1.2629 | 1.2629 | |||||
| CART / Maplebear Inc. | 0.06 | 0.00 | 2.51 | 13.41 | 1.0876 | 0.0966 | |||
| FSV / FirstService Corporation | 0.01 | 0.00 | 2.30 | 5.21 | 0.9965 | 0.0178 | |||
| CEG / Constellation Energy Corporation | 0.01 | 2.12 | 0.9178 | 0.9178 | |||||
| UBER / Uber Technologies, Inc. | 0.02 | 0.00 | 2.11 | 28.02 | 0.9120 | 0.1760 | |||
| JD / JD.com, Inc. - Depositary Receipt (Common Stock) | 0.05 | 0.00 | 1.73 | -20.61 | 0.7473 | -0.2256 | |||
| US009066AB74 / CONVERTIBLE ZERO | 1.69 | 1.02 | 0.7315 | -0.0166 | |||||
| TSM / Taiwan Semiconductor Manufacturing Company Limited - Depositary Receipt (Common Stock) | 0.01 | 0.00 | 1.58 | 36.42 | 0.6831 | 0.1657 | |||
| SPGI / S&P Global Inc. | 0.00 | 1.57 | 0.6800 | 0.6800 | |||||
| UNH / UnitedHealth Group Incorporated | 0.00 | 1.51 | 0.6541 | 0.6541 | |||||
| VRT / Vertiv Holdings Co | 0.01 | 1.46 | 0.6325 | 0.6325 | |||||
| ANET / Arista Networks Inc | 0.01 | 1.21 | 0.5256 | 0.5256 | |||||
| GS / The Goldman Sachs Group, Inc. | 0.00 | 0.00 | 1.08 | 29.50 | 0.4679 | 0.0947 | |||
| NOW / ServiceNow, Inc. | 0.00 | 0.00 | 0.66 | 29.08 | 0.2849 | 0.0569 | |||
| CHTR / Charter Communications, Inc. | 0.00 | 0.00 | 0.57 | 11.07 | 0.2478 | 0.0169 | |||
| HOUS / Anywhere Real Estate Inc. | 0.06 | 0.00 | 0.22 | 9.05 | 0.0940 | 0.0046 | |||
| ATUS / Altice USA, Inc. | 0.06 | 0.00 | 0.13 | -19.87 | 0.0545 | -0.0155 | |||
| BAX / Baxter International Inc. | 0.00 | -100.00 | 0.00 | 0.0000 | |||||
| DDOG / Datadog, Inc. | 0.00 | -100.00 | 0.00 | 0.0000 | |||||
| PDD / PDD Holdings Inc. - Depositary Receipt (Common Stock) | 0.00 | -100.00 | 0.00 | 0.0000 | |||||
| CRM / Salesforce, Inc. | 0.00 | -100.00 | 0.00 | 0.0000 | |||||
| TMO / Thermo Fisher Scientific Inc. | 0.00 | -100.00 | 0.00 | 0.0000 | |||||
| APD / Air Products and Chemicals, Inc. | 0.00 | -100.00 | 0.00 | 0.0000 | |||||
| BIDU / Baidu, Inc. - Depositary Receipt (Common Stock) | 0.00 | -100.00 | 0.00 | 0.0000 | |||||
| PYPL / PayPal Holdings, Inc. | 0.00 | -100.00 | 0.00 | -100.00 | -0.8414 | ||||
| OXY / Occidental Petroleum Corporation | 0.00 | -100.00 | 0.00 | 0.0000 |