Statistik Asas
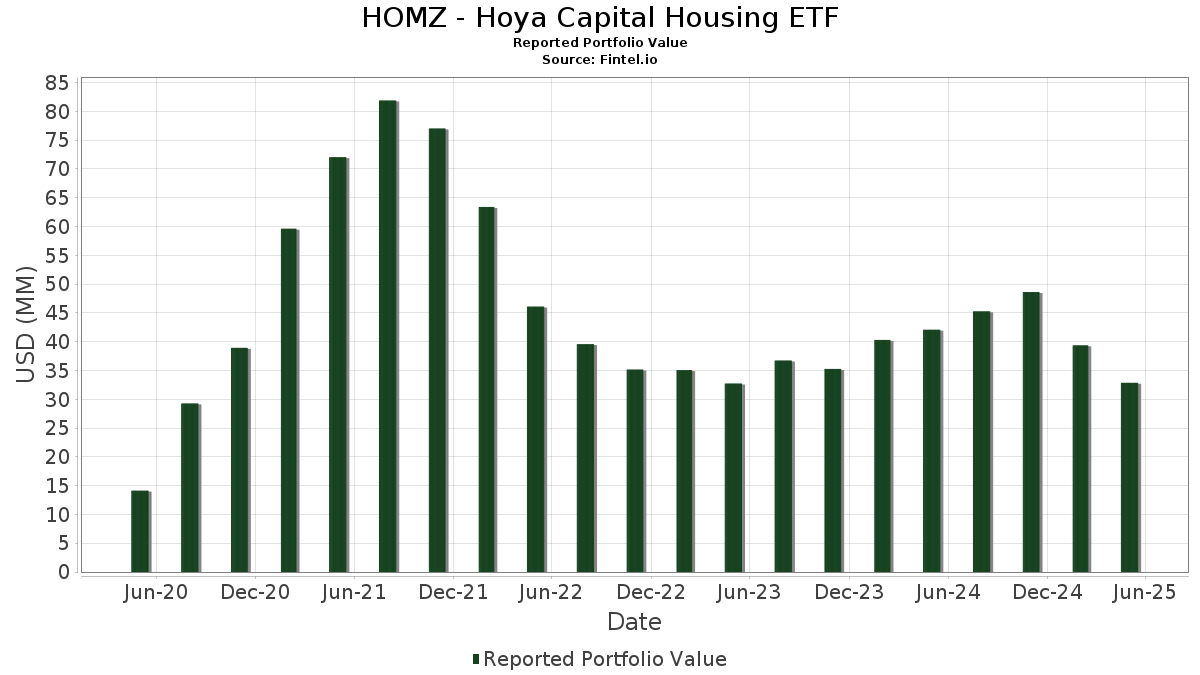
| Nilai Portfolio | $ 32,845,610 |
| Kedudukan Semasa | 101 |
Pegangan Terkini, Prestasi, AUM (dari 13F, 13D)
HOMZ - Hoya Capital Housing ETF telah mendedahkan 101 jumlah pegangan dalam pemfailan SEC terkini mereka. Nilai portfolio terkini dikira sebagai $ 32,845,610 USD. Aset Sebenar Di Bawah Pengurusan (AUM) ialah nilai ini ditambah dengan tunai (yang tidak didedahkan). Pegangan teratas HOMZ - Hoya Capital Housing ETF ialah The Home Depot, Inc. (US:HD) , Lowe's Companies, Inc. (US:LOW) , Welltower Inc. (US:WELL) , Ventas, Inc. (US:VTR) , and American Homes 4 Rent (US:AMH) .
Kenaikan Teratas Suku Tahun Ini
Kami menggunakan perubahan dalam peruntukan portfolio kerana ini adalah metrik yang paling bermakna. Perubahan boleh disebabkan oleh perdagangan atau perubahan dalam harga saham.
| Sekuriti | Saham (MM) |
Nilai (MM$) |
Portfolio % | ΔPortfolio % |
|---|---|---|---|---|
| 0.03 | 0.28 | 0.8661 | 0.3423 | |
| 0.02 | 0.59 | 1.7957 | 0.2051 | |
| 0.19 | 0.19 | 0.5841 | 0.1987 | |
| 0.00 | 0.66 | 1.9992 | 0.1962 | |
| 0.01 | 0.51 | 1.5621 | 0.1962 | |
| 0.00 | 0.54 | 1.6328 | 0.1751 | |
| 0.02 | 0.58 | 1.7772 | 0.1526 | |
| 0.00 | 0.28 | 0.8568 | 0.1505 | |
| 0.00 | 0.53 | 1.6064 | 0.1373 | |
| 0.01 | 0.27 | 0.8237 | 0.1294 |
Penurunan Teratas Suku Tahun Ini
Kami menggunakan perubahan dalam peruntukan portfolio kerana ini adalah metrik yang paling bermakna. Perubahan boleh disebabkan oleh perdagangan atau perubahan dalam harga saham.
| Sekuriti | Saham (MM) |
Nilai (MM$) |
Portfolio % | ΔPortfolio % |
|---|---|---|---|---|
| 0.00 | 0.15 | 0.4563 | -0.2792 | |
| 0.04 | 0.23 | 0.6872 | -0.2596 | |
| 0.00 | 0.19 | 0.5725 | -0.2406 | |
| 0.04 | 0.18 | 0.5552 | -0.1793 | |
| 0.01 | 0.43 | 1.3071 | -0.1745 | |
| 0.02 | 0.24 | 0.7163 | -0.1525 | |
| 0.00 | 0.14 | 0.4230 | -0.1390 | |
| 0.02 | 0.18 | 0.5497 | -0.1332 | |
| 0.00 | 0.19 | 0.5931 | -0.1317 | |
| 0.00 | 0.21 | 0.6429 | -0.1167 |
13F dan Pemfailan Dana
Borang ini telah difailkan pada 2025-07-30 untuk tempoh pelaporan 2025-05-31. Klik ikon pautan untuk melihat sejarah transaksi penuh.
Tingkatkan untuk membuka data premium dan eksport ke Excel ![]() .
.
| Sekuriti | Jenis | Purata Harga Saham | Saham (MM) |
ΔSaham (%) |
ΔSaham (%) |
Nilai ($MM) |
Portfolio (%) |
ΔPortfolio (%) |
|
|---|---|---|---|---|---|---|---|---|---|
| HD / The Home Depot, Inc. | 0.00 | -7.84 | 1.03 | -14.38 | 3.1342 | 0.0767 | |||
| LOW / Lowe's Companies, Inc. | 0.00 | -7.87 | 1.00 | -16.37 | 3.0480 | 0.0058 | |||
| WELL / Welltower Inc. | 0.00 | -7.89 | 0.66 | -7.33 | 1.9992 | 0.1962 | |||
| VTR / Ventas, Inc. | 0.01 | -7.87 | 0.59 | -14.29 | 1.8073 | 0.0448 | |||
| AMH / American Homes 4 Rent | 0.02 | -7.84 | 0.59 | -5.75 | 1.7957 | 0.2051 | |||
| INVH / Invitation Homes Inc. | 0.02 | -7.83 | 0.58 | -8.61 | 1.7772 | 0.1526 | |||
| ELME / Elme Communities | 0.04 | -7.83 | 0.58 | -14.89 | 1.7757 | 0.0341 | |||
| MAA / Mid-America Apartment Communities, Inc. | 0.00 | -7.83 | 0.57 | -14.14 | 1.7397 | 0.0486 | |||
| SUI / Sun Communities, Inc. | 0.00 | -7.82 | 0.57 | -16.47 | 1.7307 | 0.0018 | |||
| CPT / Camden Property Trust | 0.00 | -7.87 | 0.56 | -12.75 | 1.7080 | 0.0738 | |||
| ESS / Essex Property Trust, Inc. | 0.00 | -7.91 | 0.55 | -16.15 | 1.6602 | 0.0085 | |||
| EQR / Equity Residential | 0.01 | -7.83 | 0.54 | -12.84 | 1.6537 | 0.0698 | |||
| UDR / UDR, Inc. | 0.01 | -7.85 | 0.54 | -15.52 | 1.6417 | 0.0198 | |||
| PSA / Public Storage | 0.00 | -7.94 | 0.54 | -6.46 | 1.6328 | 0.1751 | |||
| EXR / Extra Space Storage Inc. | 0.00 | -7.86 | 0.53 | -8.82 | 1.6064 | 0.1373 | |||
| ELS / Equity LifeStyle Properties, Inc. | 0.01 | -7.84 | 0.53 | -14.47 | 1.6011 | 0.0365 | |||
| AVB / AvalonBay Communities, Inc. | 0.00 | -7.89 | 0.52 | -15.78 | 1.5935 | 0.0136 | |||
| CUBE / CubeSmart | 0.01 | -7.83 | 0.51 | -4.47 | 1.5621 | 0.1962 | |||
| UMH / UMH Properties, Inc. | 0.03 | -7.84 | 0.51 | -18.21 | 1.5593 | -0.0332 | |||
| CSR / Centerspace | 0.01 | -7.84 | 0.51 | -11.36 | 1.5453 | 0.0919 | |||
| IRT / Independence Realty Trust, Inc. | 0.03 | -7.83 | 0.50 | -21.47 | 1.5272 | -0.0950 | |||
| TMHC / Taylor Morrison Home Corporation | 0.01 | -7.86 | 0.46 | -15.94 | 1.4148 | 0.0108 | |||
| NVR / NVR, Inc. | 0.00 | -8.45 | 0.46 | -10.12 | 1.4073 | 0.1006 | |||
| PHM / PulteGroup, Inc. | 0.00 | -7.84 | 0.44 | -12.62 | 1.3499 | 0.0616 | |||
| NXRT / NexPoint Residential Trust, Inc. | 0.01 | -7.83 | 0.43 | -26.42 | 1.3071 | -0.1745 | |||
| DHI / D.R. Horton, Inc. | 0.00 | -7.87 | 0.42 | -14.17 | 1.2903 | 0.0344 | |||
| TPH / Tri Pointe Homes, Inc. | 0.01 | -7.85 | 0.41 | -14.16 | 1.2359 | 0.0335 | |||
| MTH / Meritage Homes Corporation | 0.01 | -7.90 | 0.41 | -19.16 | 1.2325 | -0.0403 | |||
| MHO / M/I Homes, Inc. | 0.00 | -7.86 | 0.39 | -16.34 | 1.1865 | 0.0054 | |||
| TOL / Toll Brothers, Inc. | 0.00 | -7.88 | 0.39 | -13.97 | 1.1822 | 0.0348 | |||
| KBH / KB Home | 0.01 | -7.83 | 0.38 | -22.09 | 1.1609 | -0.0826 | |||
| LEN / Lennar Corporation | 0.00 | -7.90 | 0.37 | -18.40 | 1.1206 | -0.0250 | |||
| SGI / Somnigroup International Inc. | 0.01 | -7.85 | 0.36 | -6.23 | 1.1012 | 0.1216 | |||
| AZEK / The AZEK Company Inc. | 0.01 | -7.85 | 0.30 | -2.64 | 0.8999 | 0.1284 | |||
| LZB / La-Z-Boy Incorporated | 0.01 | -7.84 | 0.29 | -14.91 | 0.8884 | 0.0193 | |||
| WSM / Williams-Sonoma, Inc. | 0.00 | -7.90 | 0.29 | -23.53 | 0.8716 | -0.0788 | |||
| W / Wayfair Inc. | 0.01 | -7.86 | 0.29 | -3.72 | 0.8678 | 0.1137 | |||
| RDFN / Redfin Corporation | 0.03 | -7.83 | 0.28 | 37.86 | 0.8661 | 0.3423 | |||
| CARR / Carrier Global Corporation | 0.00 | -7.83 | 0.28 | 1.08 | 0.8568 | 0.1505 | |||
| SHW / The Sherwin-Williams Company | 0.00 | -7.87 | 0.28 | -8.77 | 0.8559 | 0.0728 | |||
| PGR / The Progressive Corporation | 0.00 | -7.88 | 0.28 | -7.00 | 0.8513 | 0.0877 | |||
| TRV / The Travelers Companies, Inc. | 0.00 | -8.13 | 0.27 | -1.79 | 0.8338 | 0.1234 | |||
| MTG / MGIC Investment Corporation | 0.01 | -7.85 | 0.27 | -1.10 | 0.8237 | 0.1294 | |||
| ALL / The Allstate Corporation | 0.00 | -8.04 | 0.27 | -3.25 | 0.8180 | 0.1133 | |||
| PCH / PotlatchDeltic Corporation | 0.01 | -7.83 | 0.27 | -21.87 | 0.8157 | -0.0563 | |||
| AOS / A. O. Smith Corporation | 0.00 | -7.84 | 0.27 | -11.04 | 0.8114 | 0.0515 | |||
| RITM / Rithm Capital Corp. | 0.02 | -7.84 | 0.27 | -15.34 | 0.8064 | 0.0104 | |||
| EFC / Ellington Financial Inc. | 0.02 | -7.83 | 0.26 | -19.14 | 0.7973 | -0.0271 | |||
| STWD / Starwood Property Trust, Inc. | 0.01 | -7.82 | 0.26 | -11.34 | 0.7874 | 0.0465 | |||
| WFC / Wells Fargo & Company | 0.00 | -7.88 | 0.26 | -11.99 | 0.7820 | 0.0398 | |||
| ORI / Old Republic International Corporation | 0.01 | -7.86 | 0.26 | -9.57 | 0.7777 | 0.0598 | |||
| RDN / Radian Group Inc. | 0.01 | -7.81 | 0.25 | -4.51 | 0.7759 | 0.0987 | |||
| LII / Lennox International Inc. | 0.00 | -7.84 | 0.25 | -13.40 | 0.7677 | 0.0272 | |||
| NLY / Annaly Capital Management, Inc. | 0.01 | -7.84 | 0.25 | -20.45 | 0.7596 | -0.0378 | |||
| CVCO / Cavco Industries, Inc. | 0.00 | -7.88 | 0.25 | -23.93 | 0.7559 | -0.0728 | |||
| SSD / Simpson Manufacturing Co., Inc. | 0.00 | -7.99 | 0.25 | -12.72 | 0.7528 | 0.0316 | |||
| WY / Weyerhaeuser Company | 0.01 | -7.86 | 0.24 | -20.85 | 0.7410 | -0.0390 | |||
| GRBK / Green Brick Partners, Inc. | 0.00 | -7.87 | 0.24 | -10.04 | 0.7389 | 0.0547 | |||
| RKT / Rocket Companies, Inc. | 0.02 | -7.83 | 0.24 | -15.97 | 0.7369 | 0.0040 | |||
| CSGP / CoStar Group, Inc. | 0.00 | -7.86 | 0.24 | -11.11 | 0.7321 | 0.0445 | |||
| MAS / Masco Corporation | 0.00 | -7.91 | 0.24 | -23.57 | 0.7319 | -0.0672 | |||
| AGNC / AGNC Investment Corp. | 0.03 | -7.83 | 0.24 | -21.12 | 0.7289 | -0.0413 | |||
| PMT / PennyMac Mortgage Investment Trust | 0.02 | -7.83 | 0.24 | -22.73 | 0.7261 | -0.0585 | |||
| TREX / Trex Company, Inc. | 0.00 | -7.87 | 0.24 | -16.67 | 0.7165 | -0.0004 | |||
| TWO / Two Harbors Investment Corp. | 0.02 | -7.84 | 0.24 | -31.29 | 0.7163 | -0.1525 | |||
| CIM / Chimera Investment Corporation | 0.02 | -7.83 | 0.23 | -14.60 | 0.7140 | 0.0157 | |||
| WSO / Watsco, Inc. | 0.00 | -8.32 | 0.23 | -19.31 | 0.7139 | -0.0252 | |||
| FNF / Fidelity National Financial, Inc. | 0.00 | -7.85 | 0.23 | -22.03 | 0.7024 | -0.0473 | |||
| LPX / Louisiana-Pacific Corporation | 0.00 | -7.92 | 0.23 | -16.79 | 0.6944 | -0.0023 | |||
| LEG / Leggett & Platt, Incorporated | 0.03 | -7.83 | 0.23 | -8.80 | 0.6942 | 0.0578 | |||
| COMP / Compass, Inc. | 0.04 | -7.83 | 0.23 | -39.52 | 0.6872 | -0.2596 | |||
| RYN / Rayonier Inc. | 0.01 | -7.85 | 0.22 | -17.34 | 0.6819 | -0.0086 | |||
| BLD / TopBuild Corp. | 0.00 | -7.85 | 0.22 | -14.94 | 0.6774 | 0.0128 | |||
| CFG / Citizens Financial Group, Inc. | 0.01 | -7.87 | 0.22 | -18.75 | 0.6725 | -0.0188 | |||
| MHK / Mohawk Industries, Inc. | 0.00 | -7.81 | 0.22 | -21.15 | 0.6719 | -0.0393 | |||
| MFA / MFA Financial, Inc. | 0.02 | -7.83 | 0.22 | -19.33 | 0.6618 | -0.0240 | |||
| PNC / The PNC Financial Services Group, Inc. | 0.00 | -7.93 | 0.22 | -16.60 | 0.6573 | -0.0008 | |||
| IBP / Installed Building Products, Inc. | 0.00 | -7.83 | 0.22 | -14.34 | 0.6565 | 0.0174 | |||
| FAF / First American Financial Corporation | 0.00 | -7.83 | 0.22 | -21.82 | 0.6553 | -0.0434 | |||
| TFC / Truist Financial Corporation | 0.01 | -7.86 | 0.21 | -21.61 | 0.6542 | -0.0413 | |||
| WHR / Whirlpool Corporation | 0.00 | -7.90 | 0.21 | -29.43 | 0.6429 | -0.1167 | |||
| Z / Zillow Group, Inc. | 0.00 | -7.87 | 0.21 | -19.31 | 0.6362 | -0.0223 | |||
| OC / Owens Corning | 0.00 | -8.02 | 0.20 | -19.92 | 0.6121 | -0.0268 | |||
| FBHS / Fortune Brands Home & Security Inc | 0.00 | -7.83 | 0.20 | -28.32 | 0.6105 | -0.0995 | |||
| RLGY / Realogy Holdings Corp | 0.06 | -7.83 | 0.20 | -7.48 | 0.6038 | 0.0600 | |||
| FND / Floor & Decor Holdings, Inc. | 0.00 | -7.92 | 0.19 | -31.93 | 0.5931 | -0.1317 | |||
| DFH / Dream Finders Homes, Inc. | 0.01 | -7.82 | 0.19 | -19.58 | 0.5889 | -0.0224 | |||
| FGXXX / First American Funds Inc - First American Government Obligations Fund Class X | 0.19 | 26.53 | 0.19 | 26.49 | 0.5841 | 0.1987 | |||
| EXP / Eagle Materials Inc. | 0.00 | -8.16 | 0.19 | -18.26 | 0.5746 | -0.0097 | |||
| SKY / Champion Homes, Inc. | 0.00 | -7.88 | 0.19 | -41.25 | 0.5725 | -0.2406 | |||
| UWMC / UWM Holdings Corporation | 0.04 | -7.83 | 0.18 | -37.02 | 0.5552 | -0.1793 | |||
| MBC / MasterBrand, Inc. | 0.02 | -7.83 | 0.18 | -32.84 | 0.5497 | -0.1332 | |||
| BLDR / Builders FirstSource, Inc. | 0.00 | -7.89 | 0.18 | -28.63 | 0.5389 | -0.0916 | |||
| BZH / Beazer Homes USA, Inc. | 0.01 | -7.84 | 0.18 | -15.38 | 0.5372 | 0.0084 | |||
| AMWD / American Woodmark Corporation | 0.00 | -7.94 | 0.18 | -16.59 | 0.5370 | 0.0007 | |||
| CCS / Century Communities, Inc. | 0.00 | -7.90 | 0.17 | -31.33 | 0.5225 | -0.1115 | |||
| ABR / Arbor Realty Trust, Inc. | 0.02 | -7.83 | 0.17 | -28.45 | 0.5218 | -0.0870 | |||
| RH / RH | 0.00 | -7.90 | 0.15 | -48.44 | 0.4563 | -0.2792 | |||
| RMAX / RE/MAX Holdings, Inc. | 0.02 | -7.84 | 0.15 | -22.11 | 0.4532 | -0.0296 | |||
| LGIH / LGI Homes, Inc. | 0.00 | -7.90 | 0.14 | -37.10 | 0.4230 | -0.1390 | |||
| MRP / Millrose Properties, Inc. | 0.00 | -10.52 | 0.05 | 9.09 | 0.1472 | 0.0346 |