Statistik Asas
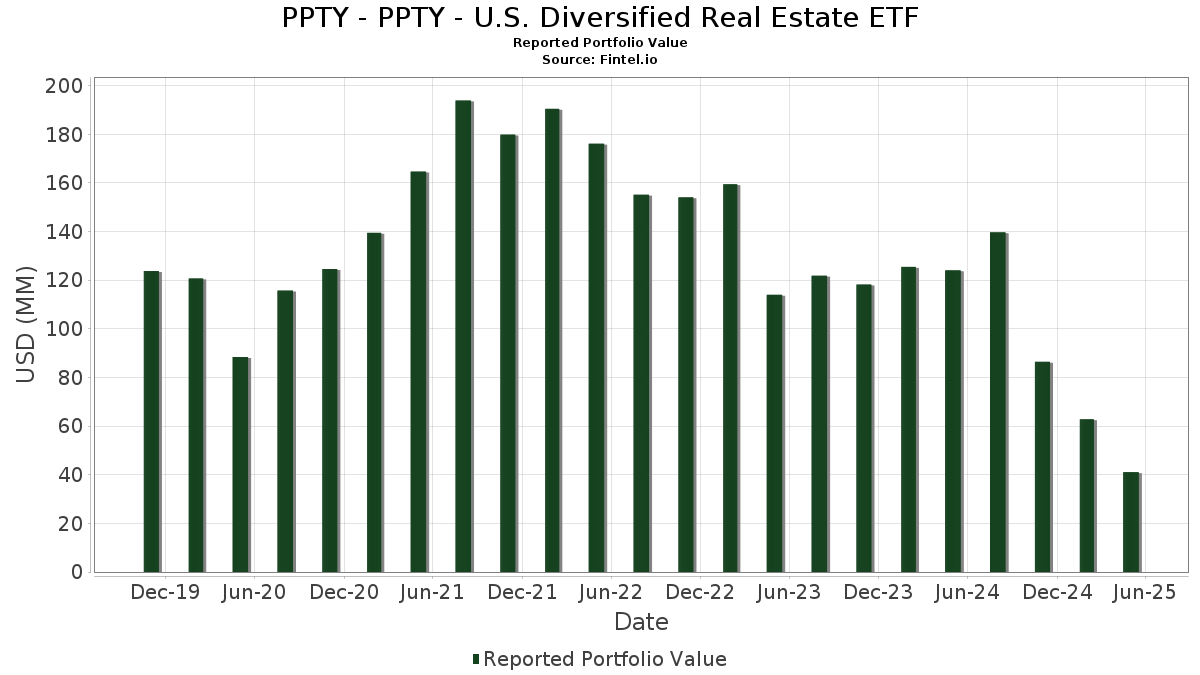
| Nilai Portfolio | $ 41,051,625 |
| Kedudukan Semasa | 91 |
Pegangan Terkini, Prestasi, AUM (dari 13F, 13D)
PPTY - PPTY - U.S. Diversified Real Estate ETF telah mendedahkan 91 jumlah pegangan dalam pemfailan SEC terkini mereka. Nilai portfolio terkini dikira sebagai $ 41,051,625 USD. Aset Sebenar Di Bawah Pengurusan (AUM) ialah nilai ini ditambah dengan tunai (yang tidak didedahkan). Pegangan teratas PPTY - PPTY - U.S. Diversified Real Estate ETF ialah Equinix, Inc. (US:EQIX) , AvalonBay Communities, Inc. (US:AVB) , Four Corners Property Trust, Inc. (US:FCPT) , Digital Realty Trust, Inc. (US:DLR) , and Prologis, Inc. (US:PLD) . Kedudukan baharu PPTY - PPTY - U.S. Diversified Real Estate ETF termasuk Easterly Government Properties, Inc. (US:DEA) , .
Kenaikan Teratas Suku Tahun Ini
Kami menggunakan perubahan dalam peruntukan portfolio kerana ini adalah metrik yang paling bermakna. Perubahan boleh disebabkan oleh perdagangan atau perubahan dalam harga saham.
| Sekuriti | Saham (MM) |
Nilai (MM$) |
Portfolio % | ΔPortfolio % |
|---|---|---|---|---|
| 0.05 | 1.04 | 2.5429 | 2.5429 | |
| 0.01 | 1.60 | 3.9003 | 0.6191 | |
| 0.19 | 0.19 | 0.4696 | 0.3638 | |
| 0.03 | 1.12 | 2.7186 | 0.2646 | |
| 0.00 | 1.69 | 4.1163 | 0.2530 | |
| 0.01 | 1.23 | 2.9958 | 0.2447 | |
| 0.03 | 0.86 | 2.1035 | 0.1990 | |
| 0.06 | 1.62 | 3.9444 | 0.1529 | |
| 0.02 | 0.87 | 2.1244 | 0.1414 | |
| 0.02 | 0.63 | 1.5449 | 0.1406 |
Penurunan Teratas Suku Tahun Ini
Kami menggunakan perubahan dalam peruntukan portfolio kerana ini adalah metrik yang paling bermakna. Perubahan boleh disebabkan oleh perdagangan atau perubahan dalam harga saham.
| Sekuriti | Saham (MM) |
Nilai (MM$) |
Portfolio % | ΔPortfolio % |
|---|---|---|---|---|
| 0.01 | 0.91 | 2.2136 | -0.7635 | |
| 0.03 | 0.55 | 1.3385 | -0.3714 | |
| 0.01 | 0.53 | 1.3023 | -0.2640 | |
| 0.07 | 0.49 | 1.1901 | -0.2589 | |
| 0.02 | 0.91 | 2.2256 | -0.2440 | |
| 0.01 | 1.57 | 3.8300 | -0.2045 | |
| 0.04 | 0.72 | 1.7493 | -0.1443 | |
| 0.01 | 0.97 | 2.3597 | -0.1257 | |
| 0.02 | 0.38 | 0.9256 | -0.0974 | |
| 0.00 | 0.17 | 0.4055 | -0.0838 |
13F dan Pemfailan Dana
Borang ini telah difailkan pada 2025-07-30 untuk tempoh pelaporan 2025-05-31. Klik ikon pautan untuk melihat sejarah transaksi penuh.
Tingkatkan untuk membuka data premium dan eksport ke Excel ![]() .
.
| Sekuriti | Jenis | Purata Harga Saham | Saham (MM) |
ΔSaham (%) |
ΔSaham (%) |
Nilai ($MM) |
Portfolio (%) |
ΔPortfolio (%) |
|
|---|---|---|---|---|---|---|---|---|---|
| EQIX / Equinix, Inc. | 0.00 | -29.11 | 1.69 | -30.37 | 4.1163 | 0.2530 | |||
| AVB / AvalonBay Communities, Inc. | 0.01 | -29.17 | 1.62 | -35.25 | 3.9456 | -0.0380 | |||
| FCPT / Four Corners Property Trust, Inc. | 0.06 | -29.18 | 1.62 | -32.00 | 3.9444 | 0.1529 | |||
| DLR / Digital Realty Trust, Inc. | 0.01 | -29.18 | 1.60 | -22.32 | 3.9003 | 0.6191 | |||
| PLD / Prologis, Inc. | 0.01 | -29.19 | 1.57 | -37.96 | 3.8300 | -0.2045 | |||
| EQR / Equity Residential | 0.02 | -29.18 | 1.31 | -33.04 | 3.1837 | 0.0762 | |||
| WELL / Welltower Inc. | 0.01 | -29.17 | 1.23 | -28.82 | 2.9958 | 0.2447 | |||
| AMH / American Homes 4 Rent | 0.03 | -29.19 | 1.12 | -27.58 | 2.7186 | 0.2646 | |||
| DEA / Easterly Government Properties, Inc. | 0.05 | 1.04 | 2.5429 | 2.5429 | |||||
| SPG / Simon Property Group, Inc. | 0.01 | -29.17 | 0.97 | -37.92 | 2.3597 | -0.1257 | |||
| TRNO / Terreno Realty Corporation | 0.02 | -29.18 | 0.91 | -41.07 | 2.2256 | -0.2440 | |||
| ARE / Alexandria Real Estate Equities, Inc. | 0.01 | -29.19 | 0.91 | -51.39 | 2.2136 | -0.7635 | |||
| UDR / UDR, Inc. | 0.02 | -29.18 | 0.90 | -35.10 | 2.1815 | -0.0145 | |||
| ESS / Essex Property Trust, Inc. | 0.00 | -29.18 | 0.89 | -35.49 | 2.1609 | -0.0282 | |||
| STAG / STAG Industrial, Inc. | 0.02 | -29.18 | 0.87 | -29.96 | 2.1244 | 0.1414 | |||
| HIW / Highwoods Properties, Inc. | 0.03 | -29.18 | 0.86 | -27.84 | 2.1035 | 0.1990 | |||
| MAA / Mid-America Apartment Communities, Inc. | 0.01 | -29.20 | 0.86 | -34.00 | 2.0849 | 0.0190 | |||
| KRC / Kilroy Realty Corporation | 0.03 | -29.18 | 0.84 | -36.10 | 2.0430 | -0.0479 | |||
| MAR / Marriott International, Inc. | 0.00 | -29.17 | 0.83 | -33.36 | 2.0139 | 0.0381 | |||
| IRT / Independence Realty Trust, Inc. | 0.04 | -29.18 | 0.72 | -39.61 | 1.7493 | -0.1443 | |||
| CPT / Camden Property Trust | 0.01 | -29.17 | 0.70 | -32.95 | 1.7162 | 0.0436 | |||
| HLT / Hilton Worldwide Holdings Inc. | 0.00 | -29.18 | 0.70 | -33.62 | 1.7137 | 0.0268 | |||
| EGP / EastGroup Properties, Inc. | 0.00 | -29.19 | 0.69 | -34.39 | 1.6695 | 0.0073 | |||
| OFC / Corporate Office Properties Trust | 0.02 | -29.18 | 0.63 | -28.12 | 1.5449 | 0.1406 | |||
| WPC / W. P. Carey Inc. | 0.01 | -29.18 | 0.58 | -30.81 | 1.4225 | 0.0791 | |||
| CUZ / Cousins Properties Incorporated | 0.02 | -29.18 | 0.58 | -34.55 | 1.4049 | 0.0037 | |||
| VNO / Vornado Realty Trust | 0.01 | -29.19 | 0.56 | -36.50 | 1.3514 | -0.0410 | |||
| COLD / Americold Realty Trust, Inc. | 0.03 | -29.18 | 0.55 | -48.88 | 1.3385 | -0.3714 | |||
| REG / Regency Centers Corporation | 0.01 | -29.19 | 0.54 | -33.42 | 1.3209 | 0.0245 | |||
| VTR / Ventas, Inc. | 0.01 | -29.17 | 0.54 | -34.15 | 1.3102 | 0.0087 | |||
| IIPR / Innovative Industrial Properties, Inc. | 0.01 | -29.18 | 0.53 | -45.73 | 1.3023 | -0.2640 | |||
| FRT / Federal Realty Investment Trust | 0.01 | -29.19 | 0.49 | -35.96 | 1.1905 | -0.0230 | |||
| AHH / Armada Hoffler Properties, Inc. | 0.07 | -29.18 | 0.49 | -46.37 | 1.1901 | -0.2589 | |||
| FR / First Industrial Realty Trust, Inc. | 0.01 | -29.19 | 0.46 | -38.80 | 1.1199 | -0.0739 | |||
| BXP / Boston Properties, Inc. | 0.01 | -29.18 | 0.45 | -32.83 | 1.0923 | 0.0300 | |||
| INVH / Invitation Homes Inc. | 0.01 | -29.18 | 0.44 | -29.82 | 1.0726 | 0.0734 | |||
| SUI / Sun Communities, Inc. | 0.00 | -29.20 | 0.42 | -35.79 | 1.0186 | -0.0188 | |||
| KIM / Kimco Realty Corporation | 0.02 | -29.18 | 0.42 | -31.80 | 1.0134 | 0.0410 | |||
| PSA / Public Storage | 0.00 | -29.18 | 0.40 | -28.08 | 0.9680 | 0.0884 | |||
| AKR / Acadia Realty Trust | 0.02 | -29.18 | 0.38 | -40.81 | 0.9256 | -0.0974 | |||
| BRX / Brixmor Property Group Inc. | 0.01 | -29.18 | 0.38 | -35.67 | 0.9195 | -0.0144 | |||
| ELS / Equity LifeStyle Properties, Inc. | 0.00 | -29.18 | 0.31 | -34.38 | 0.7636 | 0.0031 | |||
| PECO / Phillips Edison & Company, Inc. | 0.01 | -29.18 | 0.31 | -32.39 | 0.7525 | 0.0238 | |||
| EXR / Extra Space Storage Inc. | 0.00 | -29.14 | 0.29 | -29.83 | 0.7177 | 0.0494 | |||
| DOC / Healthpeak Properties, Inc. | 0.02 | -29.18 | 0.29 | -39.79 | 0.7124 | -0.0604 | |||
| KRG / Kite Realty Group Trust | 0.01 | -29.18 | 0.29 | -31.69 | 0.7094 | 0.0306 | |||
| ADC / Agree Realty Corporation | 0.00 | -29.12 | 0.28 | -27.91 | 0.6815 | 0.0655 | |||
| OHI / Omega Healthcare Investors, Inc. | 0.01 | -29.17 | 0.26 | -28.73 | 0.6407 | 0.0519 | |||
| SKT / Tanger Inc. | 0.01 | -29.18 | 0.26 | -40.55 | 0.6363 | -0.0624 | |||
| O / Realty Income Corporation | 0.00 | -29.16 | 0.25 | -29.78 | 0.6109 | 0.0431 | |||
| ESRT / Empire State Realty Trust, Inc. | 0.03 | -29.18 | 0.25 | -41.55 | 0.6070 | -0.0711 | |||
| HST / Host Hotels & Resorts, Inc. | 0.02 | -29.19 | 0.25 | -32.23 | 0.6014 | 0.0233 | |||
| GTY / Getty Realty Corp. | 0.01 | -29.18 | 0.24 | -33.88 | 0.5943 | 0.0056 | |||
| DEI / Douglas Emmett, Inc. | 0.02 | -29.18 | 0.24 | -41.77 | 0.5781 | -0.0707 | |||
| UE / Urban Edge Properties | 0.01 | -29.18 | 0.23 | -37.53 | 0.5676 | -0.0267 | |||
| H / Hyatt Hotels Corporation | 0.00 | -29.17 | 0.23 | -33.82 | 0.5542 | 0.0081 | |||
| DBRG / DigitalBridge Group, Inc. | 0.02 | -29.18 | 0.22 | -31.01 | 0.5317 | 0.0272 | |||
| AHR / American Healthcare REIT, Inc. | 0.01 | -29.19 | 0.20 | -16.94 | 0.4903 | 0.1044 | |||
| SLG / SL Green Realty Corp. | 0.00 | -29.21 | 0.20 | -37.69 | 0.4875 | -0.0243 | |||
| U.S. Bank Money Market Deposit Account / STIV (8AMMF0A84) | 0.19 | 190.05 | 0.19 | 190.91 | 0.4696 | 0.3638 | |||
| RHP / Ryman Hospitality Properties, Inc. | 0.00 | -29.14 | 0.19 | -30.55 | 0.4663 | 0.0282 | |||
| CHH / Choice Hotels International, Inc. | 0.00 | -29.12 | 0.17 | -37.45 | 0.4078 | -0.0176 | |||
| WH / Wyndham Hotels & Resorts, Inc. | 0.00 | -29.11 | 0.17 | -45.93 | 0.4055 | -0.0838 | |||
| CTRE / CareTrust REIT, Inc. | 0.01 | -29.16 | 0.16 | -21.26 | 0.3979 | 0.0676 | |||
| NTST / NETSTREIT Corp. | 0.01 | -29.18 | 0.16 | -24.06 | 0.3938 | 0.0560 | |||
| NHI / National Health Investors, Inc. | 0.00 | -29.17 | 0.16 | -28.64 | 0.3845 | 0.0337 | |||
| SBRA / Sabra Health Care REIT, Inc. | 0.01 | -29.19 | 0.16 | -25.59 | 0.3844 | 0.0472 | |||
| CUBE / CubeSmart | 0.00 | -29.16 | 0.15 | -27.00 | 0.3574 | 0.0390 | |||
| IVT / InvenTrust Properties Corp. | 0.00 | -29.17 | 0.14 | -33.33 | 0.3327 | 0.0072 | |||
| LTC / LTC Properties, Inc. | 0.00 | -29.18 | 0.13 | -28.49 | 0.3256 | 0.0293 | |||
| SILA / Sila Realty Trust, Inc. | 0.01 | -29.17 | 0.13 | -30.81 | 0.3128 | 0.0183 | |||
| APLE / Apple Hospitality REIT, Inc. | 0.01 | -29.19 | 0.12 | -44.89 | 0.3038 | -0.0546 | |||
| NHC / National HealthCare Corporation | 0.00 | -29.13 | 0.12 | -20.51 | 0.3023 | 0.0528 | |||
| SHO / Sunstone Hotel Investors, Inc. | 0.01 | -29.18 | 0.12 | -39.58 | 0.2841 | -0.0226 | |||
| UMH / UMH Properties, Inc. | 0.01 | -29.18 | 0.11 | -37.64 | 0.2723 | -0.0111 | |||
| DRH / DiamondRock Hospitality Company | 0.01 | -29.18 | 0.09 | -34.29 | 0.2251 | 0.0013 | |||
| ALEX / Alexander & Baldwin, Inc. | 0.00 | -29.17 | 0.07 | -30.19 | 0.1813 | 0.0121 | |||
| LXP / LXP Industrial Trust | 0.01 | -29.17 | 0.07 | -32.32 | 0.1642 | 0.0059 | |||
| JBGS / JBG SMITH Properties | 0.00 | -29.14 | 0.05 | -22.22 | 0.1217 | 0.0210 | |||
| ELME / Elme Communities | 0.00 | -29.13 | 0.05 | -35.21 | 0.1135 | 0.0001 | |||
| NNN / NNN REIT, Inc. | 0.00 | -29.24 | 0.05 | -30.77 | 0.1112 | 0.0068 | |||
| CSR / Centerspace | 0.00 | -29.08 | 0.05 | -31.82 | 0.1105 | 0.0047 | |||
| EPRT / Essential Properties Realty Trust, Inc. | 0.00 | -29.18 | 0.04 | -30.16 | 0.1085 | 0.0077 | |||
| BNL / Broadstone Net Lease, Inc. | 0.00 | -29.17 | 0.04 | -32.81 | 0.1058 | 0.0024 | |||
| NSA / National Storage Affiliates Trust | 0.00 | -29.12 | 0.04 | -36.51 | 0.0977 | -0.0035 | |||
| BFS / Saul Centers, Inc. | 0.00 | -29.16 | 0.04 | -37.10 | 0.0970 | -0.0025 | |||
| REXR / Rexford Industrial Realty, Inc. | 0.00 | -29.20 | 0.04 | -40.32 | 0.0916 | -0.0076 | |||
| HR / Healthcare Realty Trust Incorporated | 0.00 | -29.18 | 0.04 | -40.32 | 0.0913 | -0.0083 | |||
| XHR / Xenia Hotels & Resorts, Inc. | 0.00 | -29.18 | 0.04 | -36.36 | 0.0867 | -0.0012 | |||
| CHCT / Community Healthcare Trust Incorporated | 0.00 | -29.11 | 0.04 | -37.50 | 0.0853 | -0.0049 | |||
| MAC / The Macerich Company | 0.00 | -29.11 | 0.03 | -35.85 | 0.0834 | -0.0024 |