Statistik Asas
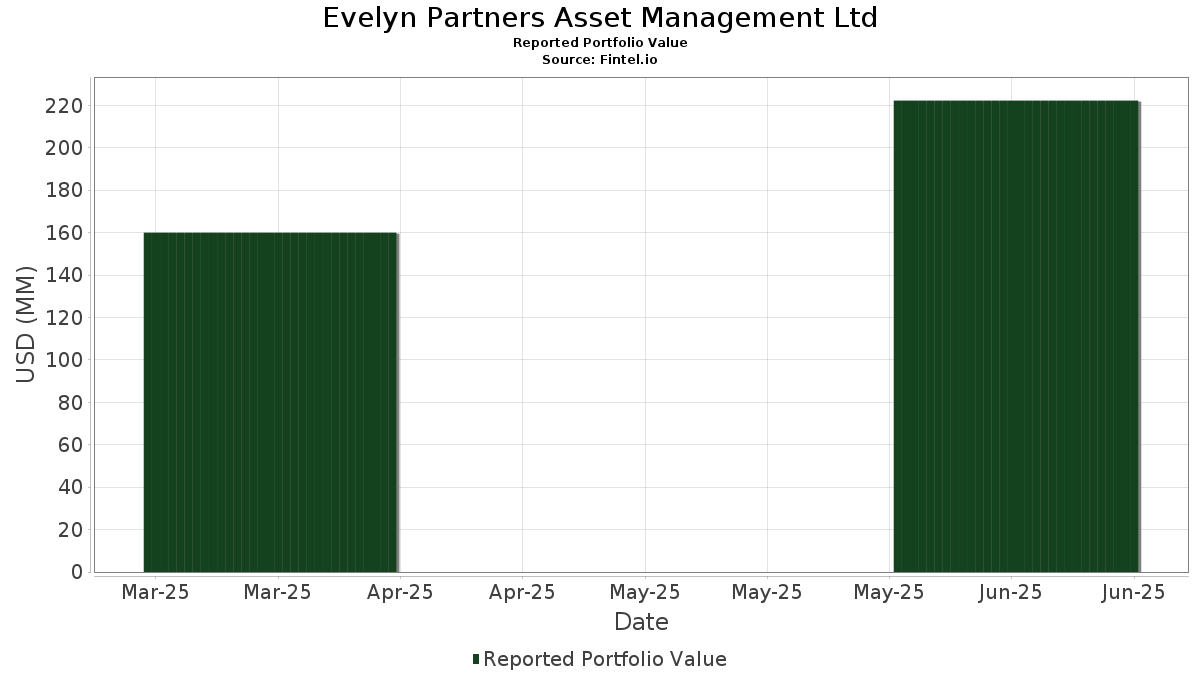
| Nilai Portfolio | $ 222,265,111 |
| Kedudukan Semasa | 136 |
Pegangan Terkini, Prestasi, AUM (dari 13F, 13D)
Evelyn Partners Asset Management Ltd telah mendedahkan 136 jumlah pegangan dalam pemfailan SEC terkini mereka. Nilai portfolio terkini dikira sebagai $ 222,265,111 USD. Aset Sebenar Di Bawah Pengurusan (AUM) ialah nilai ini ditambah dengan tunai (yang tidak didedahkan). Pegangan teratas Evelyn Partners Asset Management Ltd ialah Microsoft Corporation (US:MSFT) , Amazon.com, Inc. (US:AMZN) , Alphabet Inc. (US:GOOGL) , Visa Inc. (US:V) , and Stryker Corporation (US:SYK) . Kedudukan baharu Evelyn Partners Asset Management Ltd termasuk PayPal Holdings, Inc. (US:PYPL) , RELX PLC - Depositary Receipt (Common Stock) (US:RELX) , ASML Holding N.V. - Depositary Receipt (Common Stock) (US:ASML) , Novo Nordisk A/S - Depositary Receipt (Common Stock) (US:NVO) , and Unilever PLC - Depositary Receipt (Common Stock) (US:UL) .
Kenaikan Teratas Suku Tahun Ini
Kami menggunakan perubahan dalam peruntukan portfolio kerana ini adalah metrik yang paling bermakna. Perubahan boleh disebabkan oleh perdagangan atau perubahan dalam harga saham.
| Sekuriti | Saham (MM) |
Nilai (MM$) |
Portfolio % | ΔPortfolio % |
|---|---|---|---|---|
| 0.17 | 6.27 | 2.8209 | 2.8209 | |
| 0.16 | 10.25 | 3.5202 | 2.7809 | |
| 0.21 | 5.81 | 2.6159 | 2.6159 | |
| 0.01 | 5.78 | 2.5996 | 2.5996 | |
| 0.08 | 5.56 | 2.5036 | 2.5036 | |
| 0.09 | 5.40 | 2.4309 | 2.4309 | |
| 0.05 | 3.92 | 1.7630 | 1.7630 | |
| 0.01 | 3.01 | 1.3538 | 1.3538 | |
| 0.02 | 1.55 | 0.6958 | 0.6958 | |
| 0.01 | 1.29 | 0.5814 | 0.5814 |
Penurunan Teratas Suku Tahun Ini
Kami menggunakan perubahan dalam peruntukan portfolio kerana ini adalah metrik yang paling bermakna. Perubahan boleh disebabkan oleh perdagangan atau perubahan dalam harga saham.
| Sekuriti | Saham (MM) |
Nilai (MM$) |
Portfolio % | ΔPortfolio % |
|---|---|---|---|---|
| 0.05 | 8.23 | 2.8246 | -3.5379 | |
| 0.11 | 11.27 | 3.8699 | -3.4886 | |
| 0.07 | 12.51 | 4.2954 | -3.4164 | |
| 0.03 | 10.70 | 3.6741 | -2.8014 | |
| 0.06 | 11.32 | 3.8867 | -2.7583 | |
| 0.03 | 9.23 | 3.1693 | -2.4677 | |
| 0.01 | 8.44 | 2.8993 | -2.4290 | |
| 0.04 | 6.29 | 2.1604 | -2.1432 | |
| 0.01 | 1.34 | 0.4592 | -1.3395 | |
| 0.20 | 14.68 | 5.0415 | -1.3072 |
13F dan Pemfailan Dana
Borang ini telah difailkan pada 2025-08-12 untuk tempoh pelaporan 2025-06-30. Klik ikon pautan untuk melihat sejarah transaksi penuh.
Tingkatkan untuk membuka data premium dan eksport ke Excel ![]() .
.
| Sekuriti | Jenis | Purata Harga Saham | Saham (MM) |
ΔSaham (%) |
ΔSaham (%) |
Nilai ($MM) |
Portfolio (%) |
ΔPortfolio (%) |
|
|---|---|---|---|---|---|---|---|---|---|
| MSFT / Microsoft Corporation | 0.08 | 124,819.40 | 20.82 | 32.28 | 9.3652 | -0.4702 | |||
| AMZN / Amazon.com, Inc. | 0.20 | 354.96 | 14.68 | 44.54 | 5.0415 | -1.3072 | |||
| GOOGL / Alphabet Inc. | 0.16 | 139,381.74 | 14.13 | 45.24 | 4.8536 | -1.2287 | |||
| V / Visa Inc. | 0.07 | 102.98 | 12.51 | 1.38 | 4.2954 | -3.4164 | |||
| SYK / Stryker Corporation | 0.06 | 2,368.80 | 11.32 | 6.45 | 3.8867 | -2.7583 | |||
| ADP / Automatic Data Processing, Inc. | 0.11 | 17,429.60 | 11.27 | -4.28 | 3.8699 | -3.4886 | |||
| INTU / Intuit Inc. | 0.03 | 2,039.21 | 10.70 | 3.27 | 3.6741 | -2.8014 | |||
| DIS / The Walt Disney Company | 0.16 | 343.06 | 10.25 | 767.26 | 3.5202 | 2.7809 | |||
| MA / Mastercard Incorporated | 0.03 | 110.52 | 9.23 | 2.33 | 3.1693 | -2.4677 | |||
| AZO / AutoZone, Inc. | 0.01 | 581.90 | 8.44 | -0.96 | 2.8993 | -2.4290 | |||
| WAT / Waters Corporation | 0.05 | 329.49 | 8.23 | -19.20 | 2.8246 | -3.5379 | |||
| ADBE / Adobe Inc. | 0.04 | 8,662.73 | 7.46 | 23.25 | 2.5612 | -1.2211 | |||
| ZTS / Zoetis Inc. | 0.04 | -10.47 | 6.29 | -8.63 | 2.1604 | -2.1432 | |||
| PYPL / PayPal Holdings, Inc. | 0.17 | 6.27 | 2.8209 | 2.8209 | |||||
| RELX / RELX PLC - Depositary Receipt (Common Stock) | 0.21 | 5.81 | 2.6159 | 2.6159 | |||||
| ASML / ASML Holding N.V. - Depositary Receipt (Common Stock) | 0.01 | 5.78 | 2.5996 | 2.5996 | |||||
| NVO / Novo Nordisk A/S - Depositary Receipt (Common Stock) | 0.08 | 5.56 | 2.5036 | 2.5036 | |||||
| UL / Unilever PLC - Depositary Receipt (Common Stock) | 0.09 | 5.40 | 2.4309 | 2.4309 | |||||
| BRK.B / Berkshire Hathaway Inc. | 0.02 | 1,492.63 | 4.09 | 14.86 | 1.4044 | -0.8208 | |||
| PG / The Procter & Gamble Company | 0.05 | 3.92 | 1.7630 | 1.7630 | |||||
| META / Meta Platforms, Inc. | 0.00 | 28.34 | 3.11 | 32.02 | 1.0663 | -0.4038 | |||
| TSM / Taiwan Semiconductor Manufacturing Company Limited - Depositary Receipt (Common Stock) | 0.01 | 3.01 | 1.3538 | 1.3538 | |||||
| ANET / Arista Networks Inc | 0.05 | 361.41 | 2.65 | 105.74 | 0.9116 | 0.1052 | |||
| NVDA / NVIDIA Corporation | 0.02 | 65.59 | 2.49 | 47.98 | 0.8540 | -0.1961 | |||
| DEO / Diageo plc - Depositary Receipt (Common Stock) | 0.02 | 19,423.58 | 2.09 | -24.34 | 0.7166 | -1.0065 | |||
| JNJ / Johnson & Johnson | 0.01 | 594.51 | 1.89 | -4.10 | 0.6503 | -0.5841 | |||
| CL / Colgate-Palmolive Company | 0.02 | 1,450.11 | 1.87 | -6.36 | 0.6421 | -0.6055 | |||
| ISRG / Intuitive Surgical, Inc. | 0.00 | -69.77 | 1.71 | 16.42 | 0.5869 | -0.3312 | |||
| BKNG / Booking Holdings Inc. | 0.00 | -92.77 | 1.68 | 30.64 | 0.5785 | -0.2277 | |||
| MDLZ / Mondelez International, Inc. | 0.02 | 111.70 | 1.57 | 2.75 | 0.5400 | -0.4163 | |||
| AZN / AstraZeneca PLC - Depositary Receipt (Common Stock) | 0.02 | 1.55 | 0.6958 | 0.6958 | |||||
| MCD / McDonald's Corporation | 0.00 | -2.80 | 1.34 | -3.39 | 0.4603 | -0.4069 | |||
| AAPL / Apple Inc. | 0.01 | -71.97 | 1.34 | -53.53 | 0.4592 | -1.3395 | |||
| PEP / PepsiCo, Inc. | 0.01 | 1.29 | 0.5814 | 0.5814 | |||||
| GS / The Goldman Sachs Group, Inc. | 0.00 | 681.96 | 1.07 | 655.63 | 0.3687 | 0.2799 | |||
| RIO / Rio Tinto Group - Depositary Receipt (Common Stock) | 0.02 | 7,163.26 | 0.91 | 2.59 | 0.3128 | -0.2422 | |||
| BAC / Bank of America Corporation | 0.02 | 3,097.98 | 0.90 | 8.83 | 0.3092 | -0.2081 | |||
| CSCO / Cisco Systems, Inc. | 0.01 | 7.22 | 0.89 | 9.53 | 0.3983 | -0.1069 | |||
| TMO / Thermo Fisher Scientific Inc. | 0.00 | -87.91 | 0.60 | 0.50 | 0.2070 | -0.1677 | |||
| GOOG / Alphabet Inc. | 0.00 | 4,395.83 | 0.57 | -70.53 | 0.1972 | -1.0204 | |||
| CTVA / Corteva, Inc. | 0.01 | 16.68 | 0.57 | 18.46 | 0.1964 | -0.1054 | |||
| MU / Micron Technology, Inc. | 0.00 | -69.28 | 0.57 | 40.15 | 0.1955 | -0.0586 | |||
| KO / The Coca-Cola Company | 0.01 | -56.98 | 0.52 | -1.14 | 0.1787 | -0.1506 | |||
| XOM / Exxon Mobil Corporation | 0.00 | 79.07 | 0.48 | -9.42 | 0.1653 | -0.1666 | |||
| SNY / Sanofi - Depositary Receipt (Common Stock) | 0.01 | 24.53 | 0.43 | 10.82 | 0.1477 | -0.0950 | |||
| NEE / NextEra Energy, Inc. | 0.00 | -1.25 | 0.30 | -4.43 | 0.1037 | -0.0942 | |||
| NFLX / Netflix, Inc. | 0.00 | -91.47 | 0.28 | 44.10 | 0.0966 | -0.0258 | |||
| ABBV / AbbVie Inc. | 0.00 | -83.45 | 0.28 | -11.25 | 0.0948 | -0.1000 | |||
| MATX / Matson, Inc. | 0.00 | 0.26 | 0.1152 | 0.1152 | |||||
| TTWO / Take-Two Interactive Software, Inc. | 0.00 | 0.25 | 0.1146 | 0.1146 | |||||
| NOW / ServiceNow, Inc. | 0.00 | -88.88 | 0.21 | 29.09 | 0.0734 | -0.0301 | |||
| JPM / JPMorgan Chase & Co. | 0.00 | 21.61 | 0.21 | 18.50 | 0.0706 | -0.0381 | |||
| NKE / NIKE, Inc. | 0.00 | -89.28 | 0.20 | 9.09 | 0.0702 | -0.0472 | |||
| RTX / RTX Corporation | 0.00 | -82.40 | 0.19 | 10.34 | 0.0660 | -0.0430 | |||
| DD / DuPont de Nemours, Inc. | 0.00 | 1.45 | 0.17 | -8.51 | 0.0594 | -0.0583 | |||
| BX / Blackstone Inc. | 0.00 | -75.11 | 0.14 | 6.98 | 0.0475 | -0.0333 | |||
| AEP / American Electric Power Company, Inc. | 0.00 | -0.08 | 0.13 | -5.15 | 0.0445 | -0.0408 | |||
| COST / Costco Wholesale Corporation | 0.00 | -0.79 | 0.12 | 4.24 | 0.0425 | -0.0314 | |||
| DOW / Dow Inc. | 0.00 | -94.55 | 0.12 | -24.05 | 0.0413 | -0.0578 | |||
| VRSK / Verisk Analytics, Inc. | 0.00 | 0.00 | 0.12 | 5.31 | 0.0410 | -0.0303 | |||
| MS / Morgan Stanley | 0.00 | -98.58 | 0.09 | 19.74 | 0.0316 | -0.0160 | |||
| CRM / Salesforce, Inc. | 0.00 | 195.28 | 0.09 | 2.41 | 0.0293 | -0.0232 | |||
| ICE / Intercontinental Exchange, Inc. | 0.00 | -18.17 | 0.08 | 6.41 | 0.0287 | -0.0204 | |||
| EA / Electronic Arts Inc. | 0.00 | -97.81 | 0.08 | 10.96 | 0.0280 | -0.0181 | |||
| BDX / Becton, Dickinson and Company | 0.00 | -49.77 | 0.08 | -90.45 | 0.0263 | -0.4716 | |||
| HD / The Home Depot, Inc. | 0.00 | -98.88 | 0.07 | 0.00 | 0.0242 | -0.0198 | |||
| AMT / American Tower Corporation | 0.00 | 925.00 | 0.06 | 1.61 | 0.0218 | -0.0172 | |||
| MPWR / Monolithic Power Systems, Inc. | 0.00 | 0.06 | 0.0276 | 0.0276 | |||||
| OTIS / Otis Worldwide Corporation | 0.00 | 0.06 | 0.0267 | 0.0267 | |||||
| WMT / Walmart Inc. | 0.00 | -96.33 | 0.06 | 12.24 | 0.0189 | -0.0120 | |||
| KMB / Kimberly-Clark Corporation | 0.00 | 1.25 | 0.05 | -8.77 | 0.0179 | -0.0181 | |||
| TXN / Texas Instruments Incorporated | 0.00 | 0.05 | 0.0230 | 0.0230 | |||||
| UNH / UnitedHealth Group Incorporated | 0.00 | -96.53 | 0.05 | -96.20 | 0.0167 | -0.7728 | |||
| GBX / The Greenbrier Companies, Inc. | 0.00 | 0.05 | 0.0213 | 0.0213 | |||||
| TSCO / Tractor Supply Company | 0.00 | 0.05 | 0.0208 | 0.0208 | |||||
| L / Loews Corporation | 0.00 | 0.05 | 0.0207 | 0.0207 | |||||
| SBUX / Starbucks Corporation | 0.00 | -98.97 | 0.04 | -6.67 | 0.0146 | -0.0139 | |||
| MTZ / MasTec, Inc. | 0.00 | 0.04 | 0.0192 | 0.0192 | |||||
| EQIX / Equinix, Inc. | 0.00 | 0.04 | 0.0175 | 0.0175 | |||||
| ABT / Abbott Laboratories | 0.00 | -98.76 | 0.04 | 2.70 | 0.0134 | -0.0104 | |||
| CC / The Chemours Company | 0.00 | 0.04 | 0.0165 | 0.0165 | |||||
| ON / ON Semiconductor Corporation | 0.00 | 0.03 | 0.0157 | 0.0157 | |||||
| NDAQ / Nasdaq, Inc. | 0.00 | 268.57 | 0.03 | 17.24 | 0.0119 | -0.0065 | |||
| MNST / Monster Beverage Corporation | 0.00 | 3.69 | 0.03 | 6.45 | 0.0115 | -0.0080 | |||
| FHTX / Foghorn Therapeutics Inc. | 0.01 | 0.03 | 0.0150 | 0.0150 | |||||
| SCHW / The Charles Schwab Corporation | 0.00 | 0.03 | 0.0149 | 0.0149 | |||||
| PFE / Pfizer Inc. | 0.00 | 0.03 | 0.0147 | 0.0147 | |||||
| CBRE / CBRE Group, Inc. | 0.00 | 0.03 | 0.0144 | 0.0144 | |||||
| NOC / Northrop Grumman Corporation | 0.00 | -94.05 | 0.03 | -3.12 | 0.0108 | -0.0093 | |||
| ADSK / Autodesk, Inc. | 0.00 | -93.97 | 0.03 | 20.00 | 0.0105 | -0.0057 | |||
| CMCSA / Comcast Corporation | 0.00 | -9.10 | 0.03 | -3.33 | 0.0103 | -0.0091 | |||
| DHI / D.R. Horton, Inc. | 0.00 | 7.44 | 0.03 | 0.00 | 0.0102 | -0.0081 | |||
| ANSS / ANSYS, Inc. | 0.00 | -94.70 | 0.03 | 8.70 | 0.0088 | -0.0056 | |||
| ALEX / Alexander & Baldwin, Inc. | 0.00 | 0.03 | 0.0113 | 0.0113 | |||||
| SBAC / SBA Communications Corporation | 0.00 | -55.27 | 0.02 | 4.35 | 0.0085 | -0.0060 | |||
| CSX / CSX Corporation | 0.00 | 87.03 | 0.02 | 9.09 | 0.0084 | -0.0054 | |||
| HON / Honeywell International Inc. | 0.00 | -41.34 | 0.02 | 9.09 | 0.0084 | -0.0055 | |||
| CNC / Centene Corporation | 0.00 | -1.93 | 0.02 | -8.33 | 0.0099 | -0.0055 | |||
| DHR / Danaher Corporation | 0.00 | -97.99 | 0.02 | -4.76 | 0.0072 | -0.0064 | |||
| SHEL / Shell plc - Depositary Receipt (Common Stock) | 0.00 | -63.20 | 0.02 | -69.84 | 0.0067 | -0.0330 | |||
| CHKP / Check Point Software Technologies Ltd. | 0.00 | 0.02 | 0.0086 | 0.0086 | |||||
| RQI / Cohen & Steers Quality Income Realty Fund, Inc. | 0.00 | 0.02 | 0.0072 | 0.0072 | |||||
| IGR / CBRE Global Real Estate Income Fund | 0.00 | 0.01 | 0.0067 | 0.0067 | |||||
| AMAT / Applied Materials, Inc. | 0.00 | 0.01 | 0.0059 | 0.0059 | |||||
| APH / Amphenol Corporation | 0.00 | -92.05 | 0.01 | 50.00 | 0.0042 | -0.0009 | |||
| FLO / Flowers Foods, Inc. | 0.00 | 0.01 | 0.0052 | 0.0052 | |||||
| PJT / PJT Partners Inc. | 0.00 | 0.01 | 0.0048 | 0.0048 | |||||
| TSLA / Tesla, Inc. | 0.00 | 25.00 | 0.01 | 28.57 | 0.0043 | -0.0006 | |||
| ORLY / O'Reilly Automotive, Inc. | 0.00 | 0.01 | 0.0036 | 0.0036 | |||||
| QCOM / QUALCOMM Incorporated | 0.00 | 0.01 | 0.0036 | 0.0036 | |||||
| BP / BP p.l.c. - Depositary Receipt (Common Stock) | 0.00 | 0.01 | 0.0035 | 0.0035 | |||||
| IDXX / IDEXX Laboratories, Inc. | 0.00 | 0.00 | 0.01 | 40.00 | 0.0026 | -0.0011 | |||
| CAT / Caterpillar Inc. | 0.00 | -99.15 | 0.01 | 16.67 | 0.0025 | -0.0014 | |||
| GPN / Global Payments Inc. | 0.00 | 0.01 | 0.0033 | 0.0033 | |||||
| DE / Deere & Company | 0.00 | -92.47 | 0.01 | 16.67 | 0.0024 | -0.0017 | |||
| FCX / Freeport-McMoRan Inc. | 0.00 | 16.79 | 0.01 | 0.00 | 0.0024 | -0.0014 | |||
| ECL / Ecolab Inc. | 0.00 | -99.17 | 0.01 | 0.00 | 0.0023 | -0.0016 | |||
| SPGI / S&P Global Inc. | 0.00 | 9.09 | 0.01 | 0.00 | 0.0022 | -0.0016 | |||
| ADI / Analog Devices, Inc. | 0.00 | 13.04 | 0.01 | 20.00 | 0.0021 | -0.0012 | |||
| AVGO / Broadcom Inc. | 0.00 | -100.00 | 0.01 | 66.67 | 0.0020 | -0.0002 | |||
| HCA / HCA Healthcare, Inc. | 0.00 | -50.00 | 0.01 | 0.00 | 0.0020 | -0.0013 | |||
| BALL / Ball Corporation | 0.00 | -91.62 | 0.00 | 0.00 | 0.0017 | -0.0012 | |||
| MCO / Moody's Corporation | 0.00 | -99.77 | 0.00 | 0.00 | 0.0016 | -0.0011 | |||
| VRTX / Vertex Pharmaceuticals Incorporated | 0.00 | -64.00 | 0.00 | 0.00 | 0.0014 | -0.0014 | |||
| LLY / Eli Lilly and Company | 0.00 | 0.00 | 0.0018 | 0.0018 | |||||
| CME / CME Group Inc. | 0.00 | 0.00 | 0.00 | 0.00 | 0.0013 | -0.0010 | |||
| LOW / Lowe's Companies, Inc. | 0.00 | -99.38 | 0.00 | 0.00 | 0.0013 | -0.0012 | |||
| VLTO / Veralto Corporation | 0.00 | 8.82 | 0.00 | 0.00 | 0.0013 | -0.0010 | |||
| FANG / Diamondback Energy, Inc. | 0.00 | -11.11 | 0.00 | 0.00 | 0.0008 | -0.0008 | |||
| LNG / Cheniere Energy, Inc. | 0.00 | 0.00 | 0.00 | 0.00 | 0.0008 | -0.0005 | |||
| COP / ConocoPhillips | 0.00 | -8.33 | 0.00 | -50.00 | 0.0007 | -0.0008 | |||
| DBRG / DigitalBridge Group, Inc. | 0.00 | 0.00 | 0.0008 | 0.0008 | |||||
| ELV / Elevance Health, Inc. | 0.00 | 0.00 | 0.0007 | 0.0007 | |||||
| OXY / Occidental Petroleum Corporation | 0.00 | 0.00 | 0.0006 | 0.0006 | |||||
| HUM / Humana Inc. | 0.00 | -99.74 | 0.00 | 0.00 | 0.0004 | -0.0004 | |||
| HAL / Halliburton Company | 0.00 | 0.00 | 0.0004 | 0.0004 | |||||
| UPS / United Parcel Service, Inc. | 0.00 | -100.00 | 0.00 | 0.0000 | |||||
| MRK / Merck & Co., Inc. | 0.00 | -100.00 | 0.00 | 0.0000 | |||||
| IP / International Paper Company | 0.00 | -100.00 | 0.00 | 0.0000 | |||||
| RMD / ResMed Inc. | 0.00 | -100.00 | 0.00 | 0.0000 | |||||
| RSG / Republic Services, Inc. | 0.00 | -100.00 | 0.00 | 0.0000 | |||||
| BA / The Boeing Company | 0.00 | -100.00 | 0.00 | 0.0000 | |||||
| MKL / Markel Group Inc. | 0.00 | -100.00 | 0.00 | 0.0000 |