Statistik Asas
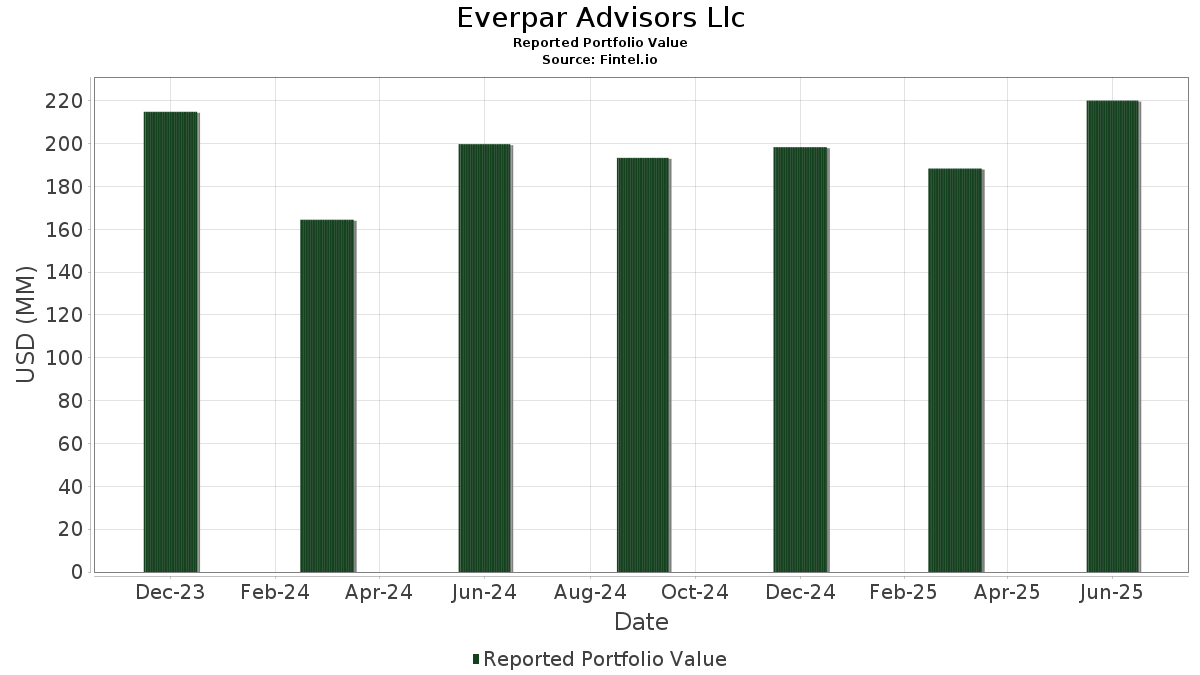
| Nilai Portfolio | $ 220,077,085 |
| Kedudukan Semasa | 266 |
Pegangan Terkini, Prestasi, AUM (dari 13F, 13D)
Everpar Advisors Llc telah mendedahkan 266 jumlah pegangan dalam pemfailan SEC terkini mereka. Nilai portfolio terkini dikira sebagai $ 220,077,085 USD. Aset Sebenar Di Bawah Pengurusan (AUM) ialah nilai ini ditambah dengan tunai (yang tidak didedahkan). Pegangan teratas Everpar Advisors Llc ialah Microsoft Corporation (US:MSFT) , JPMorgan Chase & Co. (US:JPM) , iShares Trust - iShares Core S&P 500 ETF (US:IVV) , NVIDIA Corporation (US:NVDA) , and Apple Inc. (US:AAPL) . Kedudukan baharu Everpar Advisors Llc termasuk Gilead Sciences, Inc. (US:GILD) , iShares Trust - iShares Core Dividend Growth ETF (US:DGRO) , Flutter Entertainment plc (US:PDYPF) , Vistra Corp. (US:VST) , and Vanguard Bond Index Funds - Vanguard Total Bond Market ETF (US:BND) .
Kenaikan Teratas Suku Tahun Ini
Kami menggunakan perubahan dalam peruntukan portfolio kerana ini adalah metrik yang paling bermakna. Perubahan boleh disebabkan oleh perdagangan atau perubahan dalam harga saham.
| Sekuriti | Saham (MM) |
Nilai (MM$) |
Portfolio % | ΔPortfolio % |
|---|---|---|---|---|
| 0.05 | 8.58 | 3.8964 | 1.1539 | |
| 0.01 | 9.20 | 4.1782 | 0.9874 | |
| 0.02 | 10.19 | 4.6295 | 0.9456 | |
| 0.01 | 3.60 | 1.6357 | 0.5489 | |
| 0.11 | 4.32 | 1.9611 | 0.4123 | |
| 0.01 | 2.58 | 1.1716 | 0.3100 | |
| 0.10 | 3.88 | 1.7645 | 0.2599 | |
| 0.00 | 2.49 | 1.1324 | 0.2397 | |
| 0.01 | 4.56 | 2.0720 | 0.1959 | |
| 0.01 | 2.12 | 0.9619 | 0.1876 |
Penurunan Teratas Suku Tahun Ini
Kami menggunakan perubahan dalam peruntukan portfolio kerana ini adalah metrik yang paling bermakna. Perubahan boleh disebabkan oleh perdagangan atau perubahan dalam harga saham.
| Sekuriti | Saham (MM) |
Nilai (MM$) |
Portfolio % | ΔPortfolio % |
|---|---|---|---|---|
| 0.03 | 6.89 | 3.1322 | -0.7888 | |
| 0.05 | 4.10 | 1.8610 | -0.7878 | |
| 0.06 | 3.55 | 1.6136 | -0.5293 | |
| 0.01 | 1.69 | 0.7686 | -0.3444 | |
| 0.00 | 1.75 | 0.7938 | -0.3033 | |
| 0.01 | 1.41 | 0.6400 | -0.2573 | |
| 0.02 | 1.12 | 0.5103 | -0.2430 | |
| 0.08 | 1.49 | 0.6776 | -0.1797 | |
| 0.01 | 2.36 | 1.0717 | -0.1747 | |
| 0.01 | 1.63 | 0.7403 | -0.1599 |
13F dan Pemfailan Dana
Borang ini telah difailkan pada 2025-07-08 untuk tempoh pelaporan 2025-06-30. Klik ikon pautan untuk melihat sejarah transaksi penuh.
Tingkatkan untuk membuka data premium dan eksport ke Excel ![]() .
.
| Sekuriti | Jenis | Purata Harga Saham | Saham (MM) |
ΔSaham (%) |
ΔSaham (%) |
Nilai ($MM) |
Portfolio (%) |
ΔPortfolio (%) |
|
|---|---|---|---|---|---|---|---|---|---|
| MSFT / Microsoft Corporation | 0.02 | 10.81 | 10.19 | 46.84 | 4.6295 | 0.9456 | |||
| JPM / JPMorgan Chase & Co. | 0.03 | 1.45 | 9.52 | 19.90 | 4.3259 | 0.1103 | |||
| IVV / iShares Trust - iShares Core S&P 500 ETF | 0.01 | 38.46 | 9.20 | 53.02 | 4.1782 | 0.9874 | |||
| NVDA / NVIDIA Corporation | 0.05 | 13.88 | 8.58 | 66.02 | 3.8964 | 1.1539 | |||
| AAPL / Apple Inc. | 0.03 | 1.05 | 6.89 | -6.66 | 3.1322 | -0.7888 | |||
| AMZN / Amazon.com, Inc. | 0.02 | 2.67 | 5.00 | 18.39 | 2.2699 | 0.0296 | |||
| META / Meta Platforms, Inc. | 0.01 | 0.77 | 4.56 | 29.04 | 2.0720 | 0.1959 | |||
| CGGR / Capital Group Growth ETF | 0.11 | 24.65 | 4.32 | 47.93 | 1.9611 | 0.4123 | |||
| OKE / ONEOK, Inc. | 0.05 | -0.22 | 4.10 | -17.92 | 1.8610 | -0.7878 | |||
| CGDV / Capital Group Dividend Value ETF | 0.10 | 23.67 | 3.88 | 37.06 | 1.7645 | 0.2599 | |||
| AVGO / Broadcom Inc. | 0.01 | 6.81 | 3.60 | 75.90 | 1.6357 | 0.5489 | |||
| TSN / Tyson Foods, Inc. | 0.06 | 0.36 | 3.55 | -12.02 | 1.6136 | -0.5293 | |||
| IJH / iShares Trust - iShares Core S&P Mid-Cap ETF | 0.05 | 24.82 | 3.23 | 32.66 | 1.4692 | 0.1752 | |||
| TSLA / Tesla, Inc. | 0.01 | 8.41 | 2.90 | 32.92 | 1.3174 | 0.1590 | |||
| ORCL / Oracle Corporation | 0.01 | 1.60 | 2.58 | 58.94 | 1.1716 | 0.3100 | |||
| NFLX / Netflix, Inc. | 0.00 | 3.22 | 2.49 | 48.25 | 1.1324 | 0.2397 | |||
| GOOG / Alphabet Inc. | 0.01 | -11.52 | 2.36 | 0.47 | 1.0717 | -0.1747 | |||
| WMT / Walmart Inc. | 0.02 | 10.12 | 2.17 | 22.62 | 0.9855 | 0.0467 | |||
| QUAL / iShares Trust - iShares MSCI USA Quality Factor ETF | 0.01 | 35.68 | 2.12 | 45.13 | 0.9619 | 0.1876 | |||
| SPY / SPDR S&P 500 ETF | 0.00 | 6.73 | 1.94 | 17.86 | 0.8818 | 0.0078 | |||
| GOOG / Alphabet Inc. | 0.01 | 8.66 | 1.87 | 23.82 | 0.8483 | 0.0478 | |||
| LLY / Eli Lilly and Company | 0.00 | -10.43 | 1.75 | -15.49 | 0.7938 | -0.3033 | |||
| MA / Mastercard Incorporated | 0.00 | -4.19 | 1.71 | -1.72 | 0.7775 | -0.1473 | |||
| CVX / Chevron Corporation | 0.01 | -5.73 | 1.69 | -19.32 | 0.7686 | -0.3444 | |||
| CSCO / Cisco Systems, Inc. | 0.02 | -1.15 | 1.64 | 11.12 | 0.7451 | -0.0383 | |||
| SHW / The Sherwin-Williams Company | 0.00 | 0.53 | 1.63 | -1.15 | 0.7405 | -0.1348 | |||
| JNJ / Johnson & Johnson | 0.01 | 4.32 | 1.63 | -3.89 | 0.7403 | -0.1599 | |||
| SFNC / Simmons First National Corporation | 0.08 | 0.00 | 1.49 | -7.62 | 0.6776 | -0.1797 | |||
| VTI / Vanguard Index Funds - Vanguard Total Stock Market ETF | 0.00 | 9.72 | 1.42 | 21.32 | 0.6441 | 0.0238 | |||
| XOM / Exxon Mobil Corporation | 0.01 | -8.06 | 1.41 | -16.69 | 0.6400 | -0.2573 | |||
| GWW / W.W. Grainger, Inc. | 0.00 | 0.38 | 1.36 | 5.67 | 0.6183 | -0.0651 | |||
| V / Visa Inc. | 0.00 | 6.97 | 1.31 | 8.42 | 0.5971 | -0.0467 | |||
| AEP / American Electric Power Company, Inc. | 0.01 | 0.24 | 1.21 | -4.79 | 0.5508 | -0.1253 | |||
| OUSM / ALPS ETF Trust - ALPS | O'Shares U.S. Small-Cap Quality Dividend ETF | 0.03 | 36.86 | 1.21 | 40.72 | 0.5484 | 0.0931 | |||
| KO / The Coca-Cola Company | 0.02 | -19.87 | 1.12 | -20.80 | 0.5103 | -0.2430 | |||
| RTX / RTX Corporation | 0.01 | -0.62 | 1.03 | 9.56 | 0.4688 | -0.0312 | |||
| BRK.B / Berkshire Hathaway Inc. | 0.00 | 5.48 | 1.00 | -3.85 | 0.4543 | -0.0974 | |||
| PG / The Procter & Gamble Company | 0.01 | -4.49 | 1.00 | -10.74 | 0.4533 | -0.1398 | |||
| IVW / iShares Trust - iShares S&P 500 Growth ETF | 0.01 | 31.71 | 0.99 | 56.31 | 0.4507 | 0.1136 | |||
| HD / The Home Depot, Inc. | 0.00 | 11.88 | 0.95 | 11.87 | 0.4330 | -0.0190 | |||
| QCOM / QUALCOMM Incorporated | 0.01 | -9.47 | 0.94 | -6.17 | 0.4289 | -0.1050 | |||
| COP / ConocoPhillips | 0.01 | 138.72 | 0.93 | 103.93 | 0.4246 | 0.1814 | |||
| WMB / The Williams Companies, Inc. | 0.01 | -0.54 | 0.91 | 4.48 | 0.4134 | -0.0486 | |||
| UBER / Uber Technologies, Inc. | 0.01 | 33.73 | 0.90 | 71.24 | 0.4086 | 0.1298 | |||
| ABBV / AbbVie Inc. | 0.00 | 1.30 | 0.90 | -10.21 | 0.4077 | -0.1231 | |||
| PH / Parker-Hannifin Corporation | 0.00 | -0.72 | 0.86 | 14.13 | 0.3926 | -0.0095 | |||
| IBKR / Interactive Brokers Group, Inc. | 0.02 | 231.87 | 0.86 | 11.07 | 0.3925 | -0.0205 | |||
| BXSL / Blackstone Secured Lending Fund | 0.03 | 0.00 | 0.85 | -4.90 | 0.3881 | -0.0891 | |||
| MDLZ / Mondelez International, Inc. | 0.01 | 2.25 | 0.85 | 1.68 | 0.3858 | -0.0578 | |||
| VZ / Verizon Communications Inc. | 0.02 | -2.98 | 0.84 | -7.47 | 0.3827 | -0.1004 | |||
| BA / The Boeing Company | 0.00 | -8.79 | 0.84 | 12.02 | 0.3815 | -0.0163 | |||
| LPLA / LPL Financial Holdings Inc. | 0.00 | -0.50 | 0.83 | 14.11 | 0.3750 | -0.0092 | |||
| BAC / Bank of America Corporation | 0.02 | 10.14 | 0.81 | 25.04 | 0.3699 | 0.0238 | |||
| TJX / The TJX Companies, Inc. | 0.01 | -7.50 | 0.81 | -6.23 | 0.3698 | -0.0909 | |||
| MRK / Merck & Co., Inc. | 0.01 | -7.44 | 0.81 | -18.35 | 0.3683 | -0.1589 | |||
| BKNG / Booking Holdings Inc. | 0.00 | -1.42 | 0.80 | 23.88 | 0.3656 | 0.0208 | |||
| WRB / W. R. Berkley Corporation | 0.01 | 1.16 | 0.80 | 4.55 | 0.3654 | -0.0434 | |||
| PM / Philip Morris International Inc. | 0.00 | -0.35 | 0.79 | 14.39 | 0.3578 | -0.0078 | |||
| NSC / Norfolk Southern Corporation | 0.00 | 5.20 | 0.77 | 13.70 | 0.3509 | -0.0097 | |||
| COF / Capital One Financial Corporation | 0.00 | 8.74 | 0.76 | 28.86 | 0.3453 | 0.0326 | |||
| TDY / Teledyne Technologies Incorporated | 0.00 | 7.32 | 0.76 | 10.50 | 0.3448 | -0.0199 | |||
| LOW / Lowe's Companies, Inc. | 0.00 | 0.09 | 0.75 | -4.82 | 0.3416 | -0.0776 | |||
| MCD / McDonald's Corporation | 0.00 | 0.59 | 0.75 | -5.93 | 0.3389 | -0.0820 | |||
| ETN / Eaton Corporation plc | 0.00 | 7.82 | 0.74 | 41.52 | 0.3379 | 0.0591 | |||
| VUG / Vanguard Index Funds - Vanguard Growth ETF | 0.00 | 32.67 | 0.73 | 56.90 | 0.3308 | 0.0844 | |||
| INTU / Intuit Inc. | 0.00 | 12.29 | 0.73 | 44.05 | 0.3303 | 0.0624 | |||
| PLTR / Palantir Technologies Inc. | 0.01 | 42.82 | 0.70 | 131.02 | 0.3184 | 0.1571 | |||
| VV / Vanguard Index Funds - Vanguard Large-Cap ETF | 0.00 | 0.00 | 0.70 | 10.97 | 0.3176 | -0.0167 | |||
| ISRG / Intuitive Surgical, Inc. | 0.00 | 2.01 | 0.69 | 11.87 | 0.3128 | -0.0137 | |||
| AIG / American International Group, Inc. | 0.01 | 2.05 | 0.69 | 0.44 | 0.3124 | -0.0509 | |||
| CTVA / Corteva, Inc. | 0.01 | -15.48 | 0.68 | 0.15 | 0.3096 | -0.0518 | |||
| PNC / The PNC Financial Services Group, Inc. | 0.00 | -2.38 | 0.68 | 3.51 | 0.3087 | -0.0397 | |||
| WFC / Wells Fargo & Company | 0.01 | 16.43 | 0.68 | 29.89 | 0.3082 | 0.0311 | |||
| VIVA.X / Vanguard Index Funds - Vanguard Value ETF | 0.00 | -4.96 | 0.67 | -2.76 | 0.3049 | -0.0614 | |||
| DYNF / BlackRock ETF Trust - iShares U.S. Equity Factor Rotation Active ETF | 0.01 | 34.07 | 0.67 | 49.66 | 0.3030 | 0.0666 | |||
| AMGN / Amgen Inc. | 0.00 | 6.93 | 0.66 | -4.22 | 0.2994 | -0.0656 | |||
| BX / Blackstone Inc. | 0.00 | -7.25 | 0.65 | -0.77 | 0.2937 | -0.0521 | |||
| DIS / The Walt Disney Company | 0.01 | 3.22 | 0.64 | 29.61 | 0.2908 | 0.0288 | |||
| COST / Costco Wholesale Corporation | 0.00 | 17.67 | 0.64 | 23.12 | 0.2906 | 0.0149 | |||
| PSX / Phillips 66 | 0.01 | 41.20 | 0.64 | 36.40 | 0.2898 | 0.0416 | |||
| ANET / Arista Networks Inc | 0.01 | -10.73 | 0.64 | 17.78 | 0.2893 | 0.0025 | |||
| ITW / Illinois Tool Works Inc. | 0.00 | -1.40 | 0.63 | -1.57 | 0.2845 | -0.0537 | |||
| CGUS / Capital Group Core Equity ETF | 0.02 | -0.18 | 0.62 | 10.48 | 0.2829 | -0.0166 | |||
| CAT / Caterpillar Inc. | 0.00 | 14.68 | 0.62 | 34.93 | 0.2812 | 0.0378 | |||
| PANW / Palo Alto Networks, Inc. | 0.00 | -1.76 | 0.62 | 17.94 | 0.2810 | 0.0023 | |||
| AMAT / Applied Materials, Inc. | 0.00 | 22.11 | 0.61 | 53.94 | 0.2752 | 0.0665 | |||
| AMP / Ameriprise Financial, Inc. | 0.00 | -6.08 | 0.60 | 3.61 | 0.2736 | -0.0351 | |||
| ABT / Abbott Laboratories | 0.00 | 10.96 | 0.60 | 13.83 | 0.2733 | -0.0074 | |||
| LII / Lennox International Inc. | 0.00 | -22.57 | 0.59 | -20.94 | 0.2680 | -0.1277 | |||
| BSY / Bentley Systems, Incorporated | 0.01 | -1.68 | 0.58 | 34.87 | 0.2656 | 0.0355 | |||
| ROL / Rollins, Inc. | 0.01 | 0.10 | 0.58 | 4.68 | 0.2645 | -0.0312 | |||
| IYW / iShares Trust - iShares U.S. Technology ETF | 0.00 | 41.91 | 0.58 | 75.45 | 0.2631 | 0.0875 | |||
| ATO / Atmos Energy Corporation | 0.00 | 6.61 | 0.57 | 6.30 | 0.2608 | -0.0259 | |||
| USB / U.S. Bancorp | 0.01 | 1.13 | 0.56 | 8.25 | 0.2566 | -0.0200 | |||
| CRWD / CrowdStrike Holdings, Inc. | 0.00 | 0.00 | 0.56 | 44.56 | 0.2539 | 0.0485 | |||
| BSCU / Invesco Exchange-Traded Self-Indexed Fund Trust - Invesco BulletShares 2030 Corporate Bond ETF | 0.03 | 67.61 | 0.56 | 69.51 | 0.2528 | 0.0786 | |||
| MDT / Medtronic plc | 0.01 | 1.35 | 0.56 | -1.60 | 0.2524 | -0.0476 | |||
| BSCT / Invesco Exchange-Traded Self-Indexed Fund Trust - Invesco BulletShares 2029 Corporate Bond ETF | 0.03 | 68.15 | 0.55 | 69.88 | 0.2489 | 0.0775 | |||
| BSCS / Invesco Exchange-Traded Self-Indexed Fund Trust - Invesco BulletShares 2028 Corporate Bond ETF | 0.03 | 67.06 | 0.55 | 68.00 | 0.2485 | 0.0759 | |||
| FTI / TechnipFMC plc | 0.02 | -1.92 | 0.55 | 6.64 | 0.2483 | -0.0239 | |||
| GD / General Dynamics Corporation | 0.00 | 7.78 | 0.55 | 15.22 | 0.2480 | -0.0033 | |||
| OGS / ONE Gas, Inc. | 0.01 | 0.00 | 0.54 | -5.06 | 0.2475 | -0.0567 | |||
| BSCR / Invesco Exchange-Traded Self-Indexed Fund Trust - Invesco BulletShares 2027 Corporate Bond ETF | 0.03 | 67.66 | 0.54 | 68.11 | 0.2471 | 0.0754 | |||
| BSCQ / Invesco Exchange-Traded Self-Indexed Fund Trust - Invesco BulletShares 2026 Corporate Bond ETF | 0.03 | 68.07 | 0.54 | 68.22 | 0.2457 | 0.0752 | |||
| GE / General Electric Company | 0.00 | 12.43 | 0.54 | 44.77 | 0.2454 | 0.0471 | |||
| MSDL / Morgan Stanley Direct Lending Fund | 0.03 | -20.59 | 0.54 | -25.59 | 0.2433 | -0.1384 | |||
| ECL / Ecolab Inc. | 0.00 | 1.33 | 0.53 | 7.69 | 0.2422 | -0.0206 | |||
| ADP / Automatic Data Processing, Inc. | 0.00 | 0.70 | 0.53 | 1.54 | 0.2403 | -0.0359 | |||
| GSCE / GS Connect S&P GSCI Enhanced Commodity Total Return ETN | 0.00 | -9.23 | 0.53 | 17.59 | 0.2402 | 0.0015 | |||
| JKHY / Jack Henry & Associates, Inc. | 0.00 | -1.83 | 0.52 | -2.97 | 0.2377 | -0.0490 | |||
| GEV / GE Vernova Inc. | 0.00 | 16.86 | 0.52 | 102.33 | 0.2366 | 0.1001 | |||
| BSCP / Invesco Exchange-Traded Self-Indexed Fund Trust - Invesco BulletShares 2025 Corporate Bond ETF | 0.03 | 68.98 | 0.52 | 69.06 | 0.2361 | 0.0728 | |||
| IBM / International Business Machines Corporation | 0.00 | 1.75 | 0.51 | 20.66 | 0.2339 | 0.0073 | |||
| BMY / Bristol-Myers Squibb Company | 0.01 | -3.38 | 0.51 | -26.57 | 0.2336 | -0.1386 | |||
| AZN / AstraZeneca PLC - Depositary Receipt (Common Stock) | 0.01 | -1.80 | 0.50 | -6.51 | 0.2286 | -0.0575 | |||
| BSCV / Invesco Exchange-Traded Self-Indexed Fund Trust - Invesco BulletShares 2031 Corporate Bond ETF | 0.03 | 78.59 | 0.50 | 81.23 | 0.2285 | 0.0810 | |||
| ALL / The Allstate Corporation | 0.00 | -0.16 | 0.50 | -2.90 | 0.2281 | -0.0465 | |||
| ADBE / Adobe Inc. | 0.00 | 13.11 | 0.50 | 14.16 | 0.2275 | -0.0055 | |||
| CRM / Salesforce, Inc. | 0.00 | -9.90 | 0.49 | -8.61 | 0.2222 | -0.0614 | |||
| SONY / Sony Group Corporation - Depositary Receipt (Common Stock) | 0.02 | -0.47 | 0.49 | 2.09 | 0.2220 | -0.0322 | |||
| IGM / iShares Trust - iShares Expanded Tech Sector ETF | 0.00 | 27.61 | 0.48 | 58.22 | 0.2187 | 0.0571 | |||
| BKLN / Invesco Exchange-Traded Fund Trust II - Invesco Senior Loan ETF | 0.02 | 0.96 | 0.48 | 2.12 | 0.2187 | -0.0317 | |||
| PGR / The Progressive Corporation | 0.00 | -15.66 | 0.48 | -20.37 | 0.2168 | -0.1017 | |||
| T / AT&T Inc. | 0.02 | 9.19 | 0.47 | 11.56 | 0.2154 | -0.0098 | |||
| MMC / Marsh & McLennan Companies, Inc. | 0.00 | 6.05 | 0.47 | -5.08 | 0.2126 | -0.0489 | |||
| TXN / Texas Instruments Incorporated | 0.00 | -15.20 | 0.47 | -2.10 | 0.2121 | -0.0408 | |||
| ANSS / ANSYS, Inc. | 0.00 | -2.79 | 0.47 | 7.89 | 0.2115 | -0.0176 | |||
| C / Citigroup Inc. | 0.01 | 5.52 | 0.46 | 26.50 | 0.2108 | 0.0161 | |||
| GLW / Corning Incorporated | 0.01 | 1.85 | 0.46 | 17.22 | 0.2105 | 0.0003 | |||
| ACN / Accenture plc | 0.00 | 38.04 | 0.46 | 32.38 | 0.2100 | 0.0244 | |||
| AMT / American Tower Corporation | 0.00 | -2.38 | 0.45 | -0.88 | 0.2061 | -0.0368 | |||
| BJ / BJ's Wholesale Club Holdings, Inc. | 0.00 | -2.56 | 0.45 | -7.96 | 0.2053 | -0.0552 | |||
| MLM / Martin Marietta Materials, Inc. | 0.00 | 4.19 | 0.45 | 19.68 | 0.2048 | 0.0048 | |||
| FICO / Fair Isaac Corporation | 0.00 | 0.41 | 0.45 | -0.45 | 0.2035 | -0.0354 | |||
| VGT / Vanguard World Fund - Vanguard Information Technology ETF | 0.00 | 5.65 | 0.45 | 29.28 | 0.2028 | 0.0194 | |||
| LEN / Lennar Corporation | 0.00 | -1.61 | 0.45 | -5.12 | 0.2023 | -0.0470 | |||
| ZWS / Zurn Elkay Water Solutions Corporation | 0.01 | -3.31 | 0.44 | 7.26 | 0.2014 | -0.0181 | |||
| ZBRA / Zebra Technologies Corporation | 0.00 | -4.82 | 0.44 | 3.79 | 0.1992 | -0.0249 | |||
| EFX / Equifax Inc. | 0.00 | -0.06 | 0.44 | 6.33 | 0.1988 | -0.0195 | |||
| IVE / iShares Trust - iShares S&P 500 Value ETF | 0.00 | 15.97 | 0.44 | 19.07 | 0.1986 | 0.0035 | |||
| ALLE / Allegion plc | 0.00 | 40.89 | 0.43 | 55.76 | 0.1970 | 0.0491 | |||
| BR / Broadridge Financial Solutions, Inc. | 0.00 | 0.63 | 0.43 | 0.95 | 0.1942 | -0.0308 | |||
| POOL / Pool Corporation | 0.00 | -15.97 | 0.42 | -23.19 | 0.1931 | -0.1001 | |||
| MTUM / iShares Trust - iShares MSCI USA Momentum Factor ETF | 0.00 | 30.16 | 0.42 | 55.31 | 0.1927 | 0.0472 | |||
| DE / Deere & Company | 0.00 | 66.87 | 0.42 | 81.03 | 0.1908 | 0.0675 | |||
| SNPS / Synopsys, Inc. | 0.00 | 4.35 | 0.42 | 24.78 | 0.1901 | 0.0120 | |||
| MS / Morgan Stanley | 0.00 | 4.84 | 0.41 | 26.46 | 0.1870 | 0.0144 | |||
| WSO / Watsco, Inc. | 0.00 | -1.69 | 0.41 | -14.58 | 0.1864 | -0.0686 | |||
| CME / CME Group Inc. | 0.00 | -10.19 | 0.40 | -6.57 | 0.1810 | -0.0457 | |||
| ICE / Intercontinental Exchange, Inc. | 0.00 | 30.73 | 0.40 | 39.08 | 0.1798 | 0.0287 | |||
| TT / Trane Technologies plc | 0.00 | 14.74 | 0.39 | 49.24 | 0.1779 | 0.0384 | |||
| IFRA / iShares Trust - iShares U.S. Infrastructure ETF | 0.01 | 34.85 | 0.39 | 47.33 | 0.1757 | 0.0362 | |||
| BFAM / Bright Horizons Family Solutions Inc. | 0.00 | -2.10 | 0.39 | -4.69 | 0.1754 | -0.0398 | |||
| APD / Air Products and Chemicals, Inc. | 0.00 | -8.12 | 0.38 | -12.18 | 0.1739 | -0.0573 | |||
| NDSN / Nordson Corporation | 0.00 | 10.65 | 0.38 | 17.50 | 0.1710 | 0.0011 | |||
| COO / The Cooper Companies, Inc. | 0.01 | -23.17 | 0.38 | -35.12 | 0.1705 | -0.1368 | |||
| XEL / Xcel Energy Inc. | 0.01 | 1.62 | 0.37 | -2.35 | 0.1704 | -0.0333 | |||
| MUFG / Mitsubishi UFJ Financial Group, Inc. - Depositary Receipt (Common Stock) | 0.03 | -2.41 | 0.37 | -1.84 | 0.1699 | -0.0322 | |||
| OLED / Universal Display Corporation | 0.00 | -5.07 | 0.37 | 5.37 | 0.1696 | -0.0189 | |||
| SHOP / Shopify Inc. | 0.00 | -8.14 | 0.37 | 10.84 | 0.1675 | -0.0088 | |||
| PWR / Quanta Services, Inc. | 0.00 | 2.31 | 0.37 | 52.70 | 0.1673 | 0.0389 | |||
| PEP / PepsiCo, Inc. | 0.00 | -21.27 | 0.37 | -30.74 | 0.1661 | -0.1138 | |||
| UNH / UnitedHealth Group Incorporated | 0.00 | 29.38 | 0.36 | -22.88 | 0.1654 | -0.0854 | |||
| APH / Amphenol Corporation | 0.00 | 5.29 | 0.36 | 58.52 | 0.1652 | 0.0434 | |||
| MPC / Marathon Petroleum Corporation | 0.00 | 18.85 | 0.36 | 35.71 | 0.1642 | 0.0226 | |||
| MMM / 3M Company | 0.00 | 9.68 | 0.36 | 13.56 | 0.1638 | -0.0045 | |||
| MCK / McKesson Corporation | 0.00 | 14.86 | 0.36 | 24.91 | 0.1622 | 0.0107 | |||
| NEE / NextEra Energy, Inc. | 0.01 | 7.93 | 0.36 | 5.65 | 0.1615 | -0.0170 | |||
| CTRA / Coterra Energy Inc. | 0.01 | -0.43 | 0.35 | -12.59 | 0.1611 | -0.0542 | |||
| EMR / Emerson Electric Co. | 0.00 | -8.11 | 0.35 | 11.71 | 0.1605 | -0.0073 | |||
| OLLI / Ollie's Bargain Outlet Holdings, Inc. | 0.00 | -1.76 | 0.35 | 11.36 | 0.1604 | -0.0081 | |||
| VRTX / Vertex Pharmaceuticals Incorporated | 0.00 | 5.88 | 0.35 | -2.76 | 0.1602 | -0.0323 | |||
| DASH / DoorDash, Inc. | 0.00 | 2.44 | 0.35 | 38.19 | 0.1598 | 0.0247 | |||
| YUM / Yum! Brands, Inc. | 0.00 | 2.46 | 0.35 | -3.57 | 0.1597 | -0.0337 | |||
| CVS / CVS Health Corporation | 0.01 | -7.17 | 0.35 | -5.66 | 0.1595 | -0.0377 | |||
| LDP / Cohen & Steers Limited Duration Preferred and Income Fund, Inc. | 0.02 | -4.05 | 0.35 | -1.14 | 0.1579 | -0.0287 | |||
| CMCSA / Comcast Corporation | 0.01 | 15.90 | 0.34 | 12.17 | 0.1552 | -0.0066 | |||
| TTE / TotalEnergies SE - Depositary Receipt (Common Stock) | 0.01 | -14.29 | 0.34 | -18.80 | 0.1535 | -0.0670 | |||
| RCL / Royal Caribbean Cruises Ltd. | 0.00 | 4.96 | 0.34 | 59.72 | 0.1535 | 0.0414 | |||
| UNP / Union Pacific Corporation | 0.00 | 6.20 | 0.33 | 3.41 | 0.1521 | -0.0197 | |||
| MO / Altria Group, Inc. | 0.01 | 12.94 | 0.33 | 10.23 | 0.1521 | -0.0090 | |||
| GILD / Gilead Sciences, Inc. | 0.00 | 0.33 | 0.1517 | 0.1517 | |||||
| ADSK / Autodesk, Inc. | 0.00 | 1.80 | 0.33 | 20.65 | 0.1514 | 0.0044 | |||
| NOW / ServiceNow, Inc. | 0.00 | 0.33 | 0.1504 | 0.1504 | |||||
| CFR / Cullen/Frost Bankers, Inc. | 0.00 | -1.64 | 0.33 | 0.92 | 0.1504 | -0.0236 | |||
| MCHP / Microchip Technology Incorporated | 0.00 | 6.51 | 0.33 | 55.19 | 0.1496 | 0.0367 | |||
| BLK / BlackRock, Inc. | 0.00 | 10.25 | 0.33 | 22.47 | 0.1488 | 0.0065 | |||
| COR / Cencora, Inc. | 0.00 | 5.84 | 0.33 | 14.39 | 0.1482 | -0.0035 | |||
| FCX / Freeport-McMoRan Inc. | 0.01 | 1.36 | 0.33 | 16.43 | 0.1482 | -0.0010 | |||
| RPM / RPM International Inc. | 0.00 | -2.89 | 0.32 | -7.95 | 0.1475 | -0.0394 | |||
| DHR / Danaher Corporation | 0.00 | -10.13 | 0.32 | -13.37 | 0.1473 | -0.0514 | |||
| TSM / Taiwan Semiconductor Manufacturing Company Limited - Depositary Receipt (Common Stock) | 0.00 | -1.47 | 0.32 | 34.60 | 0.1452 | 0.0190 | |||
| CNC / Centene Corporation | 0.01 | -3.83 | 0.32 | -14.09 | 0.1444 | -0.0518 | |||
| SRE / Sempra | 0.00 | 5.44 | 0.32 | 12.01 | 0.1441 | -0.0063 | |||
| LH / Labcorp Holdings Inc. | 0.00 | 12.91 | 0.32 | 27.42 | 0.1440 | 0.0119 | |||
| TMO / Thermo Fisher Scientific Inc. | 0.00 | 1.57 | 0.31 | -17.41 | 0.1426 | -0.0587 | |||
| SYK / Stryker Corporation | 0.00 | -4.59 | 0.31 | 1.63 | 0.1418 | -0.0216 | |||
| LIN / Linde plc | 0.00 | -0.76 | 0.31 | 0.00 | 0.1401 | -0.0236 | |||
| HDV / iShares Trust - iShares Core High Dividend ETF | 0.00 | 40.65 | 0.31 | 36.16 | 0.1389 | 0.0196 | |||
| AWK / American Water Works Company, Inc. | 0.00 | 7.52 | 0.30 | 1.68 | 0.1373 | -0.0209 | |||
| SLV / iShares Silver Trust | 0.01 | 0.00 | 0.30 | 5.61 | 0.1372 | -0.0142 | |||
| MCO / Moody's Corporation | 0.00 | -5.10 | 0.30 | 2.05 | 0.1358 | -0.0194 | |||
| SCHW / The Charles Schwab Corporation | 0.00 | 8.32 | 0.30 | 26.27 | 0.1355 | 0.0101 | |||
| TRV / The Travelers Companies, Inc. | 0.00 | 5.62 | 0.30 | 6.86 | 0.1347 | -0.0126 | |||
| CB / Chubb Limited | 0.00 | 39.95 | 0.30 | 34.55 | 0.1347 | 0.0175 | |||
| AXP / American Express Company | 0.00 | 17.24 | 0.29 | 39.05 | 0.1331 | 0.0212 | |||
| ALC / Alcon Inc. | 0.00 | -2.18 | 0.29 | -9.03 | 0.1330 | -0.0378 | |||
| SPOT / Spotify Technology S.A. | 0.00 | 2.47 | 0.29 | 43.00 | 0.1304 | 0.0238 | |||
| CHH / Choice Hotels International, Inc. | 0.00 | -4.86 | 0.28 | -9.32 | 0.1286 | -0.0367 | |||
| TTWO / Take-Two Interactive Software, Inc. | 0.00 | 1.32 | 0.28 | 18.64 | 0.1275 | 0.0020 | |||
| NVO / Novo Nordisk A/S - Depositary Receipt (Common Stock) | 0.00 | -1.68 | 0.28 | -2.11 | 0.1269 | -0.0248 | |||
| MET / MetLife, Inc. | 0.00 | -1.71 | 0.28 | -1.42 | 0.1259 | -0.0235 | |||
| REGN / Regeneron Pharmaceuticals, Inc. | 0.00 | 15.92 | 0.27 | -3.90 | 0.1233 | -0.0268 | |||
| THO / THOR Industries, Inc. | 0.00 | -4.47 | 0.27 | 11.98 | 0.1233 | -0.0054 | |||
| MNST / Monster Beverage Corporation | 0.00 | 1.65 | 0.27 | 8.47 | 0.1226 | -0.0091 | |||
| CI / The Cigna Group | 0.00 | -11.34 | 0.27 | -10.96 | 0.1221 | -0.0381 | |||
| SBUX / Starbucks Corporation | 0.00 | -24.21 | 0.27 | -29.37 | 0.1217 | -0.0792 | |||
| DGRO / iShares Trust - iShares Core Dividend Growth ETF | 0.00 | 0.27 | 0.1208 | 0.1208 | |||||
| NKE / NIKE, Inc. | 0.00 | 0.27 | 0.1206 | 0.1206 | |||||
| STZ / Constellation Brands, Inc. | 0.00 | -14.67 | 0.26 | -24.21 | 0.1195 | -0.0651 | |||
| ZTS / Zoetis Inc. | 0.00 | 11.58 | 0.26 | 5.67 | 0.1188 | -0.0126 | |||
| LMT / Lockheed Martin Corporation | 0.00 | 11.11 | 0.26 | 15.11 | 0.1178 | -0.0017 | |||
| NTRA / Natera, Inc. | 0.00 | -1.54 | 0.26 | 17.73 | 0.1178 | 0.0008 | |||
| PDYPF / Flutter Entertainment plc | 0.00 | 0.26 | 0.1176 | 0.1176 | |||||
| VRP / Invesco Exchange-Traded Fund Trust II - Invesco Variable Rate Preferred ETF | 0.01 | 0.00 | 0.26 | 0.78 | 0.1172 | -0.0186 | |||
| FDS / FactSet Research Systems Inc. | 0.00 | 14.08 | 0.25 | 12.44 | 0.1152 | -0.0047 | |||
| SNOW / Snowflake Inc. | 0.00 | 0.25 | 0.1137 | 0.1137 | |||||
| SAIA / Saia, Inc. | 0.00 | -6.87 | 0.25 | -27.06 | 0.1130 | -0.0678 | |||
| DUK / Duke Energy Corporation | 0.00 | -1.13 | 0.25 | -4.25 | 0.1129 | -0.0250 | |||
| VST / Vistra Corp. | 0.00 | 0.25 | 0.1126 | 0.1126 | |||||
| BND / Vanguard Bond Index Funds - Vanguard Total Bond Market ETF | 0.00 | 0.25 | 0.1115 | 0.1115 | |||||
| CSX / CSX Corporation | 0.01 | -25.48 | 0.24 | -17.63 | 0.1108 | -0.0459 | |||
| 0TCU / Howmet Aerospace Inc. | 0.00 | 0.24 | 0.1098 | 0.1098 | |||||
| VO / Vanguard Index Funds - Vanguard Mid-Cap ETF | 0.00 | 0.00 | 0.24 | 8.11 | 0.1092 | -0.0087 | |||
| HON / Honeywell International Inc. | 0.00 | 0.24 | 0.1088 | 0.1088 | |||||
| PAYX / Paychex, Inc. | 0.00 | 0.24 | 0.1085 | 0.1085 | |||||
| DAL / Delta Air Lines, Inc. | 0.00 | 0.24 | 0.1074 | 0.1074 | |||||
| ON / ON Semiconductor Corporation | 0.00 | 0.24 | 0.1073 | 0.1073 | |||||
| CARR / Carrier Global Corporation | 0.00 | 0.23 | 0.1064 | 0.1064 | |||||
| AZO / AutoZone, Inc. | 0.00 | -8.70 | 0.23 | -11.41 | 0.1063 | -0.0334 | |||
| FPE / First Trust Exchange-Traded Fund III - First Trust Preferred Securities and Income ETF | 0.01 | 2.26 | 0.23 | 3.56 | 0.1059 | -0.0137 | |||
| INTC / Intel Corporation | 0.01 | -5.71 | 0.23 | -7.20 | 0.1058 | -0.0271 | |||
| CHE / Chemed Corporation | 0.00 | -1.44 | 0.23 | -22.15 | 0.1058 | -0.0527 | |||
| THC / Tenet Healthcare Corporation | 0.00 | 0.23 | 0.1052 | 0.1052 | |||||
| AMD / Advanced Micro Devices, Inc. | 0.00 | 0.23 | 0.1032 | 0.1032 | |||||
| EOG / EOG Resources, Inc. | 0.00 | -5.21 | 0.23 | -11.72 | 0.1029 | -0.0331 | |||
| AME / AMETEK, Inc. | 0.00 | -7.50 | 0.22 | -2.62 | 0.1015 | -0.0205 | |||
| FLEX / Flex Ltd. | 0.00 | 0.22 | 0.1009 | 0.1009 | |||||
| IQV / IQVIA Holdings Inc. | 0.00 | 4.62 | 0.22 | -6.36 | 0.1005 | -0.0251 | |||
| ABNB / Airbnb, Inc. | 0.00 | 0.22 | 0.1004 | 0.1004 | |||||
| USMV / iShares Trust - iShares MSCI USA Min Vol Factor ETF | 0.00 | 0.22 | 0.1001 | 0.1001 | |||||
| BOKF / BOK Financial Corporation | 0.00 | -0.04 | 0.22 | -6.47 | 0.0990 | -0.0244 | |||
| GLD / SPDR Gold Trust | 0.00 | 0.00 | 0.22 | 5.88 | 0.0983 | -0.0103 | |||
| KMI / Kinder Morgan, Inc. | 0.01 | 0.22 | 0.0979 | 0.0979 | |||||
| NOC / Northrop Grumman Corporation | 0.00 | 7.29 | 0.21 | 4.93 | 0.0970 | -0.0112 | |||
| TEL / TE Connectivity plc | 0.00 | 0.21 | 0.0967 | 0.0967 | |||||
| OSK / Oshkosh Corporation | 0.00 | 0.21 | 0.0946 | 0.0946 | |||||
| PCG / PG&E Corporation | 0.01 | -3.99 | 0.21 | -22.05 | 0.0933 | -0.0466 | |||
| CCL / Carnival Corporation & plc | 0.01 | -40.69 | 0.20 | -14.64 | 0.0931 | -0.0343 | |||
| O / Realty Income Corporation | 0.00 | 0.20 | 0.0930 | 0.0930 | |||||
| PYPL / PayPal Holdings, Inc. | 0.00 | -26.05 | 0.20 | -15.70 | 0.0927 | -0.0359 | |||
| SITE / SiteOne Landscape Supply, Inc. | 0.00 | -2.78 | 0.20 | -2.87 | 0.0923 | -0.0191 | |||
| MINT / PIMCO ETF Trust - PIMCO Enhanced Short Maturity Active Exchange-Traded Fund | 0.00 | 0.00 | 0.20 | 0.00 | 0.0911 | -0.0154 | |||
| TRU / TransUnion | 0.00 | 0.20 | 0.0910 | 0.0910 | |||||
| AES / The AES Corporation | 0.02 | 29.36 | 0.17 | 9.74 | 0.0771 | -0.0051 | |||
| NGL / NGL Energy Partners LP - Limited Partnership | 0.02 | 0.00 | 0.10 | -5.77 | 0.0446 | -0.0108 | |||
| TER / Teradyne, Inc. | 0.00 | -100.00 | 0.00 | 0.0000 | |||||
| CPRT / Copart, Inc. | 0.00 | -100.00 | 0.00 | 0.0000 | |||||
| AMLP / ALPS ETF Trust - Alerian MLP ETF | 0.00 | -100.00 | 0.00 | 0.0000 | |||||
| ELV / Elevance Health, Inc. | 0.00 | -100.00 | 0.00 | 0.0000 | |||||
| HUBS / HubSpot, Inc. | 0.00 | -100.00 | 0.00 | 0.0000 | |||||
| XYL / Xylem Inc. | 0.00 | -100.00 | 0.00 | 0.0000 | |||||
| ELS / Equity LifeStyle Properties, Inc. | 0.00 | -100.00 | 0.00 | 0.0000 | |||||
| CRL / Charles River Laboratories International, Inc. | 0.00 | -100.00 | 0.00 | 0.0000 | |||||
| SMG / The Scotts Miracle-Gro Company | 0.00 | -100.00 | 0.00 | 0.0000 | |||||
| EXPO / Exponent, Inc. | 0.00 | -100.00 | 0.00 | 0.0000 |