Statistik Asas
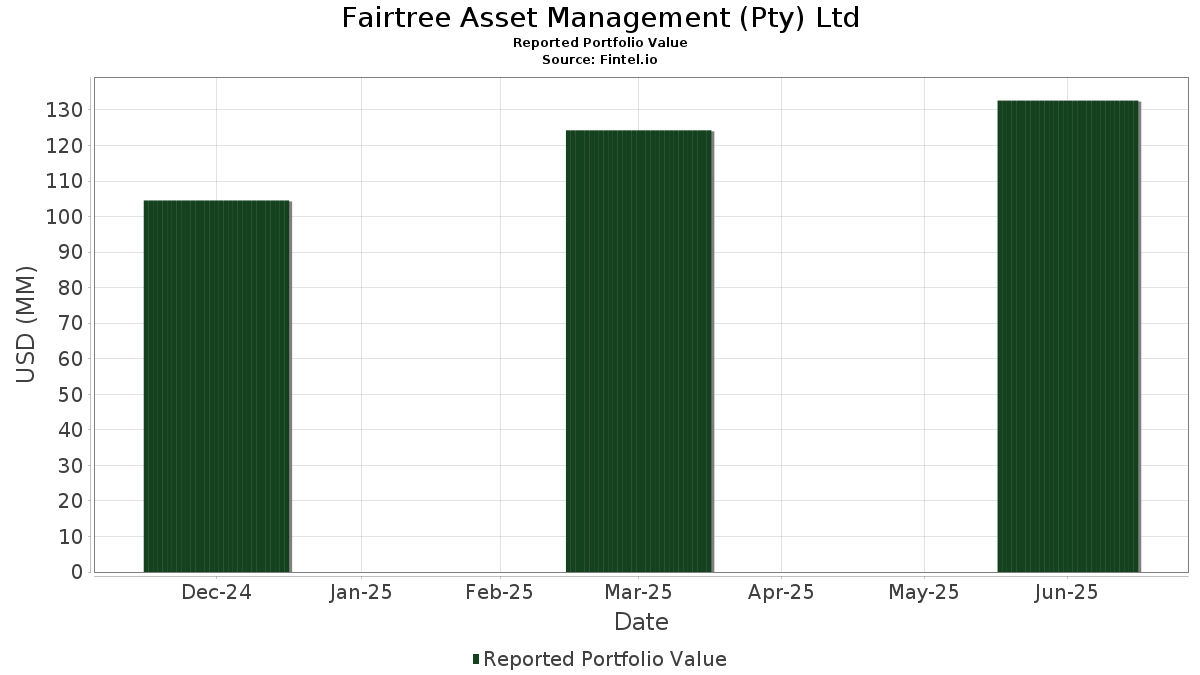
| Nilai Portfolio | $ 132,638,222 |
| Kedudukan Semasa | 93 |
Pegangan Terkini, Prestasi, AUM (dari 13F, 13D)
Fairtree Asset Management (Pty) Ltd telah mendedahkan 93 jumlah pegangan dalam pemfailan SEC terkini mereka. Nilai portfolio terkini dikira sebagai $ 132,638,222 USD. Aset Sebenar Di Bawah Pengurusan (AUM) ialah nilai ini ditambah dengan tunai (yang tidak didedahkan). Pegangan teratas Fairtree Asset Management (Pty) Ltd ialah Joint Stock Company Kaspi.kz - Depositary Receipt (Common Stock) (US:KSPI) , Microsoft Corporation (US:MSFT) , Alphabet Inc. (US:GOOG) , iShares Trust - iShares U.S. Treasury Bond ETF (US:GOVT) , and JD.com, Inc. - Depositary Receipt (Common Stock) (US:JD) . Kedudukan baharu Fairtree Asset Management (Pty) Ltd termasuk Barrick Mining Corporation (US:B) , Nu Holdings Ltd. (US:NU) , Alexandria Real Estate Equities, Inc. (US:ARE) , The Progressive Corporation (US:PGR) , and Lowe's Companies, Inc. (US:LOW) .
Kenaikan Teratas Suku Tahun Ini
Kami menggunakan perubahan dalam peruntukan portfolio kerana ini adalah metrik yang paling bermakna. Perubahan boleh disebabkan oleh perdagangan atau perubahan dalam harga saham.
| Sekuriti | Saham (MM) |
Nilai (MM$) |
Portfolio % | ΔPortfolio % |
|---|---|---|---|---|
| 0.11 | 2.27 | 1.7083 | 1.7083 | |
| 0.04 | 7.64 | 5.7595 | 1.4348 | |
| 0.11 | 1.52 | 1.1484 | 1.1484 | |
| 0.01 | 2.38 | 1.7929 | 1.0070 | |
| 0.05 | 1.27 | 0.9603 | 0.9603 | |
| 0.02 | 7.98 | 6.0156 | 0.9489 | |
| 0.06 | 1.66 | 1.2490 | 0.8719 | |
| 0.02 | 1.10 | 0.8294 | 0.8294 | |
| 0.02 | 3.74 | 2.8189 | 0.8175 | |
| 0.00 | 1.01 | 0.7597 | 0.7597 |
Penurunan Teratas Suku Tahun Ini
Kami menggunakan perubahan dalam peruntukan portfolio kerana ini adalah metrik yang paling bermakna. Perubahan boleh disebabkan oleh perdagangan atau perubahan dalam harga saham.
| Sekuriti | Saham (MM) |
Nilai (MM$) |
Portfolio % | ΔPortfolio % |
|---|---|---|---|---|
| 0.03 | 3.26 | 2.4594 | -2.7627 | |
| 0.00 | 0.08 | 0.0604 | -1.0324 | |
| 0.01 | 0.42 | 0.3197 | -0.5778 | |
| 0.04 | 4.92 | 3.7072 | -0.4513 | |
| 0.00 | 0.58 | 0.4374 | -0.4423 | |
| 0.19 | 6.15 | 4.6338 | -0.4330 | |
| 0.01 | 0.57 | 0.4325 | -0.2807 | |
| 0.11 | 9.30 | 7.0085 | -0.2748 | |
| 0.00 | 0.05 | 0.0349 | -0.1535 | |
| 0.01 | 0.66 | 0.4940 | -0.1529 |
13F dan Pemfailan Dana
Borang ini telah difailkan pada 2025-08-13 untuk tempoh pelaporan 2025-06-30. Klik ikon pautan untuk melihat sejarah transaksi penuh.
Tingkatkan untuk membuka data premium dan eksport ke Excel ![]() .
.
| Sekuriti | Jenis | Purata Harga Saham | Saham (MM) |
ΔSaham (%) |
ΔSaham (%) |
Nilai ($MM) |
Portfolio (%) |
ΔPortfolio (%) |
|
|---|---|---|---|---|---|---|---|---|---|
| KSPI / Joint Stock Company Kaspi.kz - Depositary Receipt (Common Stock) | 0.11 | 12.34 | 9.30 | 2.70 | 7.0085 | -0.2748 | |||
| MSFT / Microsoft Corporation | 0.02 | -4.36 | 7.98 | 26.72 | 6.0156 | 0.9489 | |||
| GOOG / Alphabet Inc. | 0.04 | 25.19 | 7.64 | 42.15 | 5.7595 | 1.4348 | |||
| GOVT / iShares Trust - iShares U.S. Treasury Bond ETF | 0.28 | 9.60 | 6.42 | 9.59 | 4.8434 | 0.1257 | |||
| JD / JD.com, Inc. - Depositary Receipt (Common Stock) | 0.19 | 22.97 | 6.15 | -2.38 | 4.6338 | -0.4330 | |||
| BABA / Alibaba Group Holding Limited - Depositary Receipt (Common Stock) | 0.04 | 10.94 | 4.92 | -4.84 | 3.7072 | -0.4513 | |||
| AMZN / Amazon.com, Inc. | 0.02 | 0.52 | 4.05 | 15.93 | 3.0565 | 0.2420 | |||
| NVDA / NVIDIA Corporation | 0.02 | 3.12 | 3.74 | 50.30 | 2.8189 | 0.8175 | |||
| PDD / PDD Holdings Inc. - Depositary Receipt (Common Stock) | 0.03 | -43.16 | 3.26 | -49.73 | 2.4594 | -2.7627 | |||
| META / Meta Platforms, Inc. | 0.00 | 8.89 | 3.17 | 39.43 | 2.3867 | 0.5598 | |||
| AAPL / Apple Inc. | 0.01 | 37.88 | 2.95 | 27.33 | 2.2240 | 0.3601 | |||
| QCOM / QUALCOMM Incorporated | 0.02 | 15.92 | 2.53 | 20.22 | 1.9101 | 0.2138 | |||
| AMAT / Applied Materials, Inc. | 0.01 | 93.02 | 2.38 | 143.65 | 1.7929 | 1.0070 | |||
| B / Barrick Mining Corporation | 0.11 | 2.27 | 1.7083 | 1.7083 | |||||
| TMO / Thermo Fisher Scientific Inc. | 0.01 | 45.24 | 2.24 | 18.35 | 1.6920 | 0.1660 | |||
| ADBE / Adobe Inc. | 0.01 | 19.26 | 2.21 | 20.32 | 1.6655 | 0.1878 | |||
| CROX / Crocs, Inc. | 0.02 | 12.15 | 1.72 | 6.97 | 1.2972 | 0.0026 | |||
| BP / BP p.l.c. - Depositary Receipt (Common Stock) | 0.06 | 299.06 | 1.66 | 253.85 | 1.2490 | 0.8719 | |||
| SNPS / Synopsys, Inc. | 0.00 | 10.05 | 1.63 | 31.61 | 1.2276 | 0.2317 | |||
| AVGO / Broadcom Inc. | 0.01 | -25.59 | 1.57 | 22.46 | 1.1806 | 0.1520 | |||
| NU / Nu Holdings Ltd. | 0.11 | 1.52 | 1.1484 | 1.1484 | |||||
| PLD / Prologis, Inc. | 0.01 | 0.00 | 1.47 | -6.00 | 1.1104 | -0.1500 | |||
| TOL / Toll Brothers, Inc. | 0.01 | 114.71 | 1.31 | 132.21 | 0.9844 | 0.5317 | |||
| ORCL / Oracle Corporation | 0.01 | -5.42 | 1.30 | 47.90 | 0.9806 | 0.2729 | |||
| DHI / D.R. Horton, Inc. | 0.01 | 142.17 | 1.27 | 145.95 | 0.9606 | 0.5431 | |||
| GFI / Gold Fields Limited - Depositary Receipt (Common Stock) | 0.05 | 1.27 | 0.9603 | 0.9603 | |||||
| JNJ / Johnson & Johnson | 0.01 | 104.82 | 1.27 | 88.58 | 0.9588 | 0.4164 | |||
| KLAC / KLA Corporation | 0.00 | 0.00 | 1.22 | 31.78 | 0.9164 | 0.1741 | |||
| BKNG / Booking Holdings Inc. | 0.00 | 0.00 | 1.16 | 25.62 | 0.8729 | 0.1315 | |||
| MRK / Merck & Co., Inc. | 0.01 | 75.08 | 1.11 | 54.38 | 0.8371 | 0.2585 | |||
| ARE / Alexandria Real Estate Equities, Inc. | 0.02 | 1.10 | 0.8294 | 0.8294 | |||||
| LLY / Eli Lilly and Company | 0.00 | 174.90 | 1.08 | 159.95 | 0.8175 | 0.4812 | |||
| CNC / Centene Corporation | 0.02 | 3.40 | 1.06 | -7.50 | 0.7992 | -0.1235 | |||
| CRM / Salesforce, Inc. | 0.00 | 136.34 | 1.05 | 140.50 | 0.7930 | 0.4405 | |||
| EME / EMCOR Group, Inc. | 0.00 | 0.00 | 1.05 | 44.77 | 0.7924 | 0.2080 | |||
| BRK.B / Berkshire Hathaway Inc. | 0.00 | 126.48 | 1.04 | 106.75 | 0.7863 | 0.3800 | |||
| O / Realty Income Corporation | 0.02 | 0.00 | 1.04 | -0.67 | 0.7826 | -0.0585 | |||
| MCK / McKesson Corporation | 0.00 | 14.62 | 1.01 | 24.81 | 0.7624 | 0.1104 | |||
| MA / Mastercard Incorporated | 0.00 | 23.37 | 1.01 | 26.47 | 0.7605 | 0.1187 | |||
| PGR / The Progressive Corporation | 0.00 | 1.01 | 0.7597 | 0.7597 | |||||
| LOW / Lowe's Companies, Inc. | 0.00 | 0.99 | 0.7437 | 0.7437 | |||||
| ELV / Elevance Health, Inc. | 0.00 | 0.00 | 0.98 | -10.53 | 0.7366 | -0.1426 | |||
| JPM / JPMorgan Chase & Co. | 0.00 | 0.00 | 0.95 | 18.22 | 0.7198 | 0.0697 | |||
| MSCI / MSCI Inc. | 0.00 | 0.00 | 0.94 | 1.95 | 0.7109 | -0.0331 | |||
| AMD / Advanced Micro Devices, Inc. | 0.01 | 0.00 | 0.91 | 38.11 | 0.6836 | 0.1553 | |||
| EQIX / Equinix, Inc. | 0.00 | 132.04 | 0.90 | 126.57 | 0.6819 | 0.3604 | |||
| SPGI / S&P Global Inc. | 0.00 | 0.00 | 0.89 | 3.71 | 0.6746 | -0.0192 | |||
| V / Visa Inc. | 0.00 | 93.66 | 0.87 | 96.60 | 0.6537 | 0.2981 | |||
| CPT / Camden Property Trust | 0.01 | 0.00 | 0.86 | -7.92 | 0.6488 | -0.1027 | |||
| IQV / IQVIA Holdings Inc. | 0.01 | 0.00 | 0.82 | -10.65 | 0.6201 | -0.1203 | |||
| MU / Micron Technology, Inc. | 0.01 | 14.23 | 0.82 | 62.25 | 0.6192 | 0.2113 | |||
| ENSG / The Ensign Group, Inc. | 0.01 | 70.62 | 0.79 | 103.36 | 0.5937 | 0.2822 | |||
| XPRO / Expro Group Holdings N.V. | 0.00 | 0.79 | 0.5934 | 0.5934 | |||||
| RJF / Raymond James Financial, Inc. | 0.01 | 0.00 | 0.78 | 10.53 | 0.5859 | 0.0195 | |||
| MELI / MercadoLibre, Inc. | 0.00 | 0.00 | 0.78 | 34.02 | 0.5852 | 0.1190 | |||
| ELS / Equity LifeStyle Properties, Inc. | 0.01 | 0.77 | 0.5801 | 0.5801 | |||||
| CUBE / CubeSmart | 0.02 | 0.00 | 0.76 | -0.52 | 0.5743 | -0.0417 | |||
| RMD / ResMed Inc. | 0.00 | 0.00 | 0.72 | 15.29 | 0.5464 | 0.0404 | |||
| ZTS / Zoetis Inc. | 0.00 | 0.71 | 0.5364 | 0.5364 | |||||
| KIM / Kimco Realty Corporation | 0.03 | 0.00 | 0.71 | -0.98 | 0.5318 | -0.0418 | |||
| ABNB / Airbnb, Inc. | 0.01 | 0.00 | 0.70 | 10.74 | 0.5290 | 0.0193 | |||
| DOC / Healthpeak Properties, Inc. | 0.04 | 0.00 | 0.70 | -13.42 | 0.5262 | -0.1224 | |||
| FTNT / Fortinet, Inc. | 0.01 | 14.34 | 0.70 | 25.68 | 0.5245 | 0.0787 | |||
| COR / Cencora, Inc. | 0.00 | 28.35 | 0.69 | 38.40 | 0.5220 | 0.1194 | |||
| AOS / A. O. Smith Corporation | 0.01 | 56.94 | 0.69 | 57.47 | 0.5167 | 0.1664 | |||
| HCA / HCA Healthcare, Inc. | 0.00 | 0.00 | 0.67 | 10.73 | 0.5066 | 0.0189 | |||
| UTHR / United Therapeutics Corporation | 0.00 | 26.22 | 0.66 | 17.73 | 0.5007 | 0.0465 | |||
| DECK / Deckers Outdoor Corporation | 0.01 | 0.66 | 0.4995 | 0.4995 | |||||
| EW / Edwards Lifesciences Corporation | 0.01 | -24.46 | 0.66 | -18.43 | 0.4940 | -0.1529 | |||
| TCOM / Trip.com Group Limited - Depositary Receipt (Common Stock) | 0.01 | 50.12 | 0.65 | 38.46 | 0.4892 | 0.1121 | |||
| EPAM / EPAM Systems, Inc. | 0.00 | 64.92 | 0.64 | 73.12 | 0.4856 | 0.1855 | |||
| FRT / Federal Realty Investment Trust | 0.01 | 0.64 | 0.4804 | 0.4804 | |||||
| DLR / Digital Realty Trust, Inc. | 0.00 | -56.38 | 0.58 | -46.94 | 0.4374 | -0.4423 | |||
| KO / The Coca-Cola Company | 0.01 | -34.48 | 0.57 | -35.33 | 0.4325 | -0.2807 | |||
| AXP / American Express Company | 0.00 | 0.00 | 0.57 | 18.58 | 0.4288 | 0.0428 | |||
| GPN / Global Payments Inc. | 0.01 | 0.00 | 0.54 | -18.28 | 0.4084 | -0.1249 | |||
| ADC / Agree Realty Corporation | 0.01 | 0.43 | 0.3215 | 0.3215 | |||||
| REXR / Rexford Industrial Realty, Inc. | 0.01 | -58.15 | 0.42 | -62.06 | 0.3197 | -0.5778 | |||
| INFY / Infosys Limited - Depositary Receipt (Common Stock) | 0.02 | 80.46 | 0.38 | 83.17 | 0.2874 | 0.1200 | |||
| KSA / iShares Trust - iShares MSCI Saudi Arabia ETF | 0.01 | 93.77 | 0.37 | 80.58 | 0.2809 | 0.1148 | |||
| GLPI / Gaming and Leisure Properties, Inc. | 0.01 | 0.00 | 0.37 | -8.46 | 0.2782 | -0.0456 | |||
| BIDU / Baidu, Inc. - Depositary Receipt (Common Stock) | 0.00 | 138.28 | 0.35 | 122.78 | 0.2656 | 0.1379 | |||
| EWT / iShares, Inc. - iShares MSCI Taiwan ETF | 0.01 | 74.38 | 0.32 | 111.11 | 0.2436 | 0.1203 | |||
| TSM / Taiwan Semiconductor Manufacturing Company Limited - Depositary Receipt (Common Stock) | 0.00 | 2.11 | 0.30 | 39.15 | 0.2230 | 0.0522 | |||
| AFYA / Afya Limited | 0.01 | 0.24 | 0.1842 | 0.1842 | |||||
| XP / XP Inc. | 0.01 | 0.24 | 0.1827 | 0.1827 | |||||
| PAGS / PagSeguro Digital Ltd. | 0.02 | 0.24 | 0.1801 | 0.1801 | |||||
| FMX / Fomento Económico Mexicano, S.A.B. de C.V. - Depositary Receipt (Common Stock) | 0.00 | -4.88 | 0.23 | 0.44 | 0.1724 | -0.0109 | |||
| INDA / iShares Trust - iShares MSCI India ETF | 0.00 | 0.00 | 0.23 | 8.10 | 0.1719 | 0.0023 | |||
| HDB / HDFC Bank Limited - Depositary Receipt (Common Stock) | 0.00 | 0.00 | 0.18 | 15.09 | 0.1384 | 0.0104 | |||
| UNH / UnitedHealth Group Incorporated | 0.00 | -90.09 | 0.08 | -94.11 | 0.0604 | -1.0324 | |||
| EWY / iShares, Inc. - iShares MSCI South Korea ETF | 0.00 | -85.13 | 0.05 | -80.34 | 0.0349 | -0.1535 | |||
| EPU / iShares Trust - iShares MSCI Peru and Global Exposure ETF | 0.00 | 0.00 | 0.00 | 0.00 | 0.0037 | 0.0001 | |||
| SKX / Skechers U.S.A., Inc. | 0.00 | -100.00 | 0.00 | 0.0000 | |||||
| ROST / Ross Stores, Inc. | 0.00 | -100.00 | 0.00 | 0.0000 | |||||
| FCX / Freeport-McMoRan Inc. | 0.00 | -100.00 | 0.00 | 0.0000 | |||||
| BNL / Broadstone Net Lease, Inc. | 0.00 | -100.00 | 0.00 | 0.0000 | |||||
| VRT / Vertiv Holdings Co | 0.00 | -100.00 | 0.00 | 0.0000 | |||||
| PG / The Procter & Gamble Company | 0.00 | -100.00 | 0.00 | 0.0000 | |||||
| BRX / Brixmor Property Group Inc. | 0.00 | -100.00 | 0.00 | 0.0000 | |||||
| VALE / Vale S.A. - Depositary Receipt (Common Stock) | 0.00 | -100.00 | 0.00 | 0.0000 | |||||
| DPZ / Domino's Pizza, Inc. | 0.00 | -100.00 | 0.00 | 0.0000 | |||||
| BXP / Boston Properties, Inc. | 0.00 | -100.00 | 0.00 | 0.0000 | |||||
| PBR / Petróleo Brasileiro S.A. - Petrobras - Depositary Receipt (Common Stock) | 0.00 | -100.00 | 0.00 | 0.0000 | |||||
| MAC / The Macerich Company | 0.00 | -100.00 | 0.00 | 0.0000 | |||||
| SYY / Sysco Corporation | 0.00 | -100.00 | 0.00 | 0.0000 | |||||
| GOLD / Barrick Mining Corporation | 0.00 | -100.00 | 0.00 | 0.0000 | |||||
| ULTA / Ulta Beauty, Inc. | 0.00 | -100.00 | 0.00 | 0.0000 | |||||
| EXR / Extra Space Storage Inc. | 0.00 | -100.00 | 0.00 | 0.0000 | |||||
| DIS / The Walt Disney Company | 0.00 | -100.00 | 0.00 | 0.0000 | |||||
| NDAQ / Nasdaq, Inc. | 0.00 | -100.00 | 0.00 | 0.0000 | |||||
| CAT / Caterpillar Inc. | 0.00 | -100.00 | 0.00 | 0.0000 | |||||
| LPLA / LPL Financial Holdings Inc. | 0.00 | -100.00 | 0.00 | 0.0000 | |||||
| FERG / Ferguson Enterprises Inc. | 0.00 | -100.00 | 0.00 | 0.0000 | |||||
| KRC / Kilroy Realty Corporation | 0.00 | -100.00 | 0.00 | 0.0000 | |||||
| ATKR / Atkore Inc. | 0.00 | -100.00 | 0.00 | 0.0000 | |||||
| EQR / Equity Residential | 0.00 | -100.00 | 0.00 | 0.0000 | |||||
| EIDO / iShares Trust - iShares MSCI Indonesia ETF | 0.00 | -100.00 | 0.00 | 0.0000 |