Statistik Asas
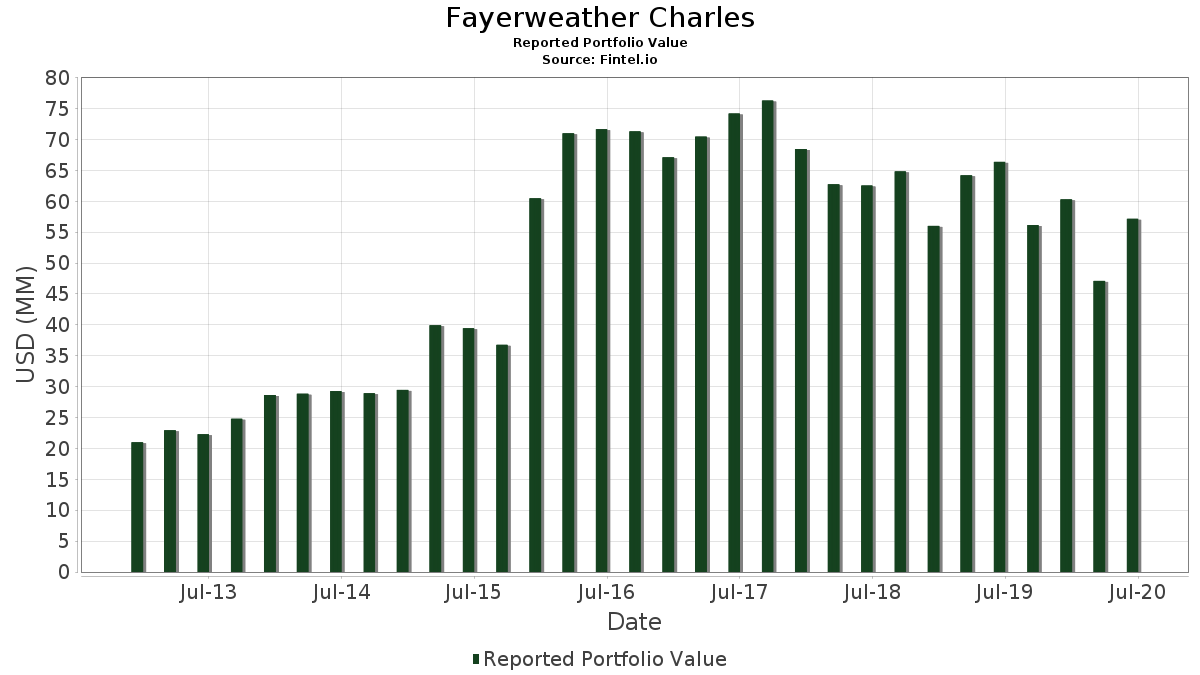
| Nilai Portfolio | $ 57,157,000 |
| Kedudukan Semasa | 52 |
Pegangan Terkini, Prestasi, AUM (dari 13F, 13D)
Fayerweather Charles telah mendedahkan 52 jumlah pegangan dalam pemfailan SEC terkini mereka. Nilai portfolio terkini dikira sebagai $ 57,157,000 USD. Aset Sebenar Di Bawah Pengurusan (AUM) ialah nilai ini ditambah dengan tunai (yang tidak didedahkan). Pegangan teratas Fayerweather Charles ialah Apple Inc. (US:AAPL) , Mastercard Incorporated (US:MA) , Danaher Corporation (US:DHR) , Canadian National Railway Company (US:CNI) , and The Procter & Gamble Company (US:PG) . Kedudukan baharu Fayerweather Charles termasuk The TJX Companies, Inc. (US:TJX) , NIKE, Inc. (US:NKE) , .
Kenaikan Teratas Suku Tahun Ini
Kami menggunakan perubahan dalam peruntukan portfolio kerana ini adalah metrik yang paling bermakna. Perubahan boleh disebabkan oleh perdagangan atau perubahan dalam harga saham.
| Sekuriti | Saham (MM) |
Nilai (MM$) |
Portfolio % | ΔPortfolio % |
|---|---|---|---|---|
| 0.01 | 4.17 | 7.3009 | 1.0215 | |
| 0.00 | 0.51 | 0.8923 | 0.8923 | |
| 0.01 | 1.22 | 2.1415 | 0.7977 | |
| 0.01 | 0.26 | 0.4479 | 0.4479 | |
| 0.01 | 1.35 | 2.3602 | 0.4347 | |
| 0.00 | 0.25 | 0.4339 | 0.4339 | |
| 0.00 | 0.23 | 0.4041 | 0.4041 | |
| 0.00 | 0.23 | 0.3972 | 0.3972 | |
| 0.00 | 0.22 | 0.3884 | 0.3884 | |
| 0.01 | 1.67 | 2.9253 | 0.3566 |
Penurunan Teratas Suku Tahun Ini
Kami menggunakan perubahan dalam peruntukan portfolio kerana ini adalah metrik yang paling bermakna. Perubahan boleh disebabkan oleh perdagangan atau perubahan dalam harga saham.
| Sekuriti | Saham (MM) |
Nilai (MM$) |
Portfolio % | ΔPortfolio % |
|---|---|---|---|---|
| 0.00 | 0.00 | -0.9128 | ||
| 0.02 | 0.97 | 1.6936 | -0.6946 | |
| 0.02 | 1.83 | 3.2087 | -0.5679 | |
| 0.02 | 2.13 | 3.7318 | -0.5288 | |
| 0.02 | 2.19 | 3.8385 | -0.4964 | |
| 0.01 | 2.07 | 3.6216 | -0.4777 | |
| 0.02 | 1.79 | 3.1352 | -0.4312 | |
| 0.01 | 1.80 | 3.1440 | -0.3482 | |
| 0.01 | 0.80 | 1.3962 | -0.2894 | |
| 0.02 | 2.11 | 3.6951 | -0.2641 |
13F dan Pemfailan Dana
Borang ini telah difailkan pada 2020-07-28 untuk tempoh pelaporan 2020-06-30. Klik ikon pautan untuk melihat sejarah transaksi penuh.
Tingkatkan untuk membuka data premium dan eksport ke Excel ![]() .
.
| Sekuriti | Jenis | Purata Harga Saham | Saham (MM) |
ΔSaham (%) |
ΔSaham (%) |
Nilai ($MM) |
Portfolio (%) |
ΔPortfolio (%) |
|
|---|---|---|---|---|---|---|---|---|---|
| AAPL / Apple Inc. | 0.01 | -1.66 | 4.17 | 41.08 | 7.3009 | 1.0215 | |||
| MA / Mastercard Incorporated | 0.01 | 0.21 | 2.63 | 22.64 | 4.6066 | 0.0488 | |||
| DHR / Danaher Corporation | 0.01 | -2.02 | 2.32 | 25.22 | 4.0660 | 0.1259 | |||
| CNI / Canadian National Railway Company | 0.03 | 0.75 | 2.24 | 14.84 | 3.9120 | -0.2212 | |||
| PG / The Procter & Gamble Company | 0.02 | -1.13 | 2.19 | 7.44 | 3.8385 | -0.4964 | |||
| NSRGY / Nestlé S.A. - Depositary Receipt (Common Stock) | 0.02 | -0.93 | 2.13 | 6.28 | 3.7318 | -0.5288 | |||
| ABT / Abbott Laboratories | 0.02 | -2.20 | 2.11 | 13.24 | 3.6951 | -0.2641 | |||
| JNJ / Johnson & Johnson | 0.01 | -0.09 | 2.07 | 7.20 | 3.6216 | -0.4777 | |||
| GOOGL / Alphabet Inc. | 0.00 | 0.57 | 2.02 | 22.95 | 3.5341 | 0.0462 | |||
| ATR / AptarGroup, Inc. | 0.02 | 1.02 | 1.92 | 13.73 | 3.3627 | -0.2250 | |||
| FISV / Fiserv, Inc. | 0.02 | 0.31 | 1.83 | 3.09 | 3.2087 | -0.5679 | |||
| ADP / Automatic Data Processing, Inc. | 0.01 | 0.22 | 1.80 | 9.24 | 3.1440 | -0.3482 | |||
| NVS / Novartis AG - Depositary Receipt (Common Stock) | 0.02 | 0.70 | 1.79 | 6.67 | 3.1352 | -0.4312 | |||
| ADI / Analog Devices, Inc. | 0.01 | 1.02 | 1.67 | 38.18 | 2.9253 | 0.3566 | |||
| MSFT / Microsoft Corporation | 0.01 | -0.18 | 1.58 | 28.95 | 2.7591 | 0.1628 | |||
| ROK / Rockwell Automation, Inc. | 0.01 | 5.46 | 1.35 | 48.73 | 2.3602 | 0.4347 | |||
| NVZMF / Novozymes A/S | 0.02 | -2.04 | 1.32 | 23.87 | 2.3059 | 0.0472 | |||
| PYPL / PayPal Holdings, Inc. | 0.01 | 6.05 | 1.22 | 93.36 | 2.1415 | 0.7977 | |||
| XLNX / Xilinx, Inc. | 0.01 | 12.42 | 1.19 | 41.82 | 2.0767 | 0.2999 | |||
| CVS / CVS Health Corporation | 0.02 | 2.41 | 1.18 | 12.11 | 2.0575 | -0.1694 | |||
| UL / Unilever PLC - Depositary Receipt (Common Stock) | 0.02 | 3.38 | 1.17 | 12.20 | 2.0435 | -0.1664 | |||
| CB / Chubb Limited | 0.01 | -0.19 | 1.15 | 13.12 | 2.0068 | -0.1458 | |||
| BDX / Becton, Dickinson and Company | 0.00 | 14.97 | 1.09 | 19.96 | 1.9140 | -0.0220 | |||
| HD / The Home Depot, Inc. | 0.00 | -2.52 | 1.08 | 30.74 | 1.8825 | 0.1354 | |||
| DIS / The Walt Disney Company | 0.01 | 8.97 | 1.05 | 25.57 | 1.8388 | 0.0620 | |||
| AMZN / Amazon.com, Inc. | 0.00 | 3.04 | 1.03 | 46.16 | 1.8003 | 0.3058 | |||
| RTX / RTX Corporation | 0.02 | 31.94 | 0.97 | -13.96 | 1.6936 | -0.6946 | |||
| PEP / PepsiCo, Inc. | 0.01 | -1.02 | 0.96 | 8.97 | 1.6796 | -0.1907 | |||
| MMM / 3M Company | 0.01 | 0.00 | 0.93 | 14.30 | 1.6218 | -0.0998 | |||
| INTC / Intel Corporation | 0.01 | -9.02 | 0.80 | 0.50 | 1.3962 | -0.2894 | |||
| XYL / Xylem Inc. | 0.01 | 13.42 | 0.66 | 13.13 | 1.1460 | -0.0832 | |||
| NVO / Novo Nordisk A/S - Depositary Receipt (Common Stock) | 0.01 | 0.00 | 0.55 | 8.91 | 0.9623 | -0.1098 | |||
| DOGEF / Ørsted A/S | 0.00 | 1.63 | 0.54 | 19.33 | 0.9395 | -0.0158 | |||
| UNH / UnitedHealth Group Incorporated | 0.00 | 96.02 | 0.51 | 131.82 | 0.8923 | 0.8923 | |||
| MKC / McCormick & Company, Incorporated | 0.00 | -0.88 | 0.50 | 25.81 | 0.8783 | 0.0313 | |||
| CVX / Chevron Corporation | 0.01 | 19.48 | 0.49 | 47.16 | 0.8625 | 0.1514 | |||
| RHHBY / Roche Holding AG - Depositary Receipt (Common Stock) | 0.01 | -0.18 | 0.47 | 6.77 | 0.8275 | -0.1129 | |||
| ILMN / Illumina, Inc. | 0.00 | 10.91 | 0.41 | 50.36 | 0.7208 | 0.1392 | |||
| FAST / Fastenal Company | 0.01 | 0.00 | 0.38 | 37.28 | 0.6701 | 0.0778 | |||
| EOG / EOG Resources, Inc. | 0.01 | 15.30 | 0.36 | 61.54 | 0.6246 | 0.1554 | |||
| FDS / FactSet Research Systems Inc. | 0.00 | -8.51 | 0.35 | 15.36 | 0.6176 | -0.0320 | |||
| GILD / Gilead Sciences, Inc. | 0.00 | 0.00 | 0.33 | 3.12 | 0.5791 | -0.1023 | |||
| CL / Colgate-Palmolive Company | 0.00 | 0.00 | 0.33 | 10.51 | 0.5704 | -0.0559 | |||
| TFX / Teleflex Incorporated | 0.00 | 0.00 | 0.31 | 24.10 | 0.5406 | 0.0120 | |||
| V / Visa Inc. | 0.00 | -11.11 | 0.31 | 6.55 | 0.5406 | -0.0750 | |||
| QCOM / QUALCOMM Incorporated | 0.00 | 0.00 | 0.29 | 34.74 | 0.5021 | 0.0500 | |||
| TJX / The TJX Companies, Inc. | 0.01 | 0.26 | 0.4479 | 0.4479 | |||||
| NKE / NIKE, Inc. | 0.00 | 0.25 | 0.4339 | 0.4339 | |||||
| ABBV / AbbVie Inc. | 0.00 | 0.23 | 0.4041 | 0.4041 | |||||
| ITW / Illinois Tool Works Inc. | 0.00 | 0.23 | 0.3972 | 0.3972 | |||||
| XOM / Exxon Mobil Corporation | 0.01 | -21.74 | 0.23 | -7.02 | 0.3937 | -0.1201 | |||
| CHD / Church & Dwight Co., Inc. | 0.00 | 0.22 | 0.3884 | 0.3884 | |||||
| FTV / Fortive Corporation | 0.00 | -100.00 | 0.00 | -100.00 | -0.9128 |