Statistik Asas
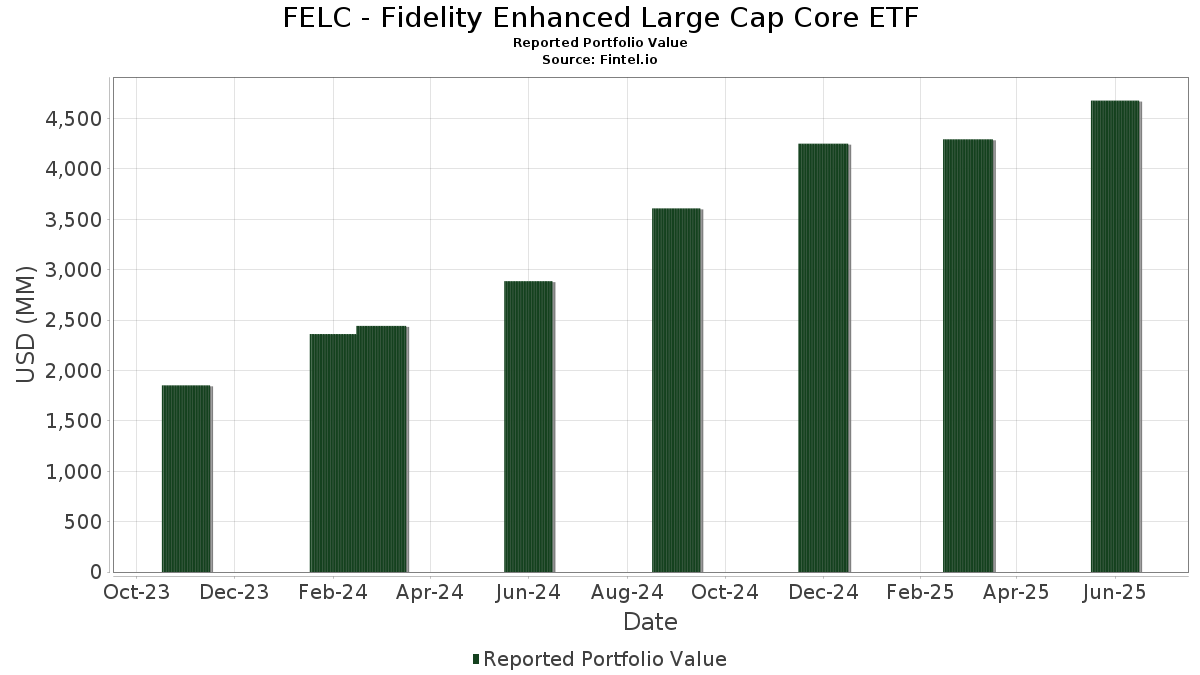
| Nilai Portfolio | $ 4,678,851,479 |
| Kedudukan Semasa | 199 |
Pegangan Terkini, Prestasi, AUM (dari 13F, 13D)
FELC - Fidelity Enhanced Large Cap Core ETF telah mendedahkan 199 jumlah pegangan dalam pemfailan SEC terkini mereka. Nilai portfolio terkini dikira sebagai $ 4,678,851,479 USD. Aset Sebenar Di Bawah Pengurusan (AUM) ialah nilai ini ditambah dengan tunai (yang tidak didedahkan). Pegangan teratas FELC - Fidelity Enhanced Large Cap Core ETF ialah NVIDIA Corporation (US:NVDA) , Microsoft Corporation (US:MSFT) , Apple Inc. (US:AAPL) , Amazon.com, Inc. (US:AMZN) , and Meta Platforms, Inc. (US:META) . Kedudukan baharu FELC - Fidelity Enhanced Large Cap Core ETF termasuk Honeywell International Inc. (US:HON) , The Williams Companies, Inc. (US:WMB) , Autodesk, Inc. (US:ADSK) , Intercontinental Exchange, Inc. (US:ICE) , and Western Digital Corporation (US:WDC) .
Kenaikan Teratas Suku Tahun Ini
Kami menggunakan perubahan dalam peruntukan portfolio kerana ini adalah metrik yang paling bermakna. Perubahan boleh disebabkan oleh perdagangan atau perubahan dalam harga saham.
| Sekuriti | Saham (MM) |
Nilai (MM$) |
Portfolio % | ΔPortfolio % |
|---|---|---|---|---|
| 2.32 | 366.62 | 7.8366 | 1.8031 | |
| 0.62 | 309.85 | 6.6232 | 1.2835 | |
| 0.50 | 138.92 | 2.9695 | 1.0186 | |
| 0.45 | 41.97 | 0.8972 | 0.8969 | |
| 0.15 | 34.21 | 0.7312 | 0.7312 | |
| 0.35 | 37.56 | 0.8028 | 0.6931 | |
| 0.49 | 30.62 | 0.6546 | 0.6546 | |
| 0.15 | 24.39 | 0.5213 | 0.4574 | |
| 0.55 | 96.81 | 2.0695 | 0.4443 | |
| 0.21 | 66.82 | 1.4283 | 0.4375 |
Penurunan Teratas Suku Tahun Ini
Kami menggunakan perubahan dalam peruntukan portfolio kerana ini adalah metrik yang paling bermakna. Perubahan boleh disebabkan oleh perdagangan atau perubahan dalam harga saham.
| Sekuriti | Saham (MM) |
Nilai (MM$) |
Portfolio % | ΔPortfolio % |
|---|---|---|---|---|
| 1.43 | 294.12 | 6.2869 | -1.2330 | |
| 0.18 | 19.65 | 0.4201 | -1.2268 | |
| 0.04 | 11.30 | 0.2415 | -1.1786 | |
| 0.36 | 12.77 | 0.2730 | -0.5577 | |
| 0.03 | 2.12 | 0.0453 | -0.4825 | |
| 0.00 | 3.06 | 0.0655 | -0.4534 | |
| 0.06 | 10.86 | 0.2322 | -0.4374 | |
| 0.01 | 3.42 | 0.0731 | -0.4354 | |
| 0.21 | 100.80 | 2.1546 | -0.4339 | |
| 0.00 | 1.85 | 0.0396 | -0.3905 |
13F dan Pemfailan Dana
Borang ini telah difailkan pada 2025-08-22 untuk tempoh pelaporan 2025-06-30. Klik ikon pautan untuk melihat sejarah transaksi penuh.
Tingkatkan untuk membuka data premium dan eksport ke Excel ![]() .
.
| Sekuriti | Jenis | Purata Harga Saham | Saham (MM) |
ΔSaham (%) |
ΔSaham (%) |
Nilai ($MM) |
Portfolio (%) |
ΔPortfolio (%) |
|
|---|---|---|---|---|---|---|---|---|---|
| NVDA / NVIDIA Corporation | 2.32 | -2.95 | 366.62 | 41.47 | 7.8366 | 1.8031 | |||
| MSFT / Microsoft Corporation | 0.62 | 1.96 | 309.85 | 35.10 | 6.6232 | 1.2835 | |||
| AAPL / Apple Inc. | 1.43 | -1.41 | 294.12 | -8.94 | 6.2869 | -1.2330 | |||
| AMZN / Amazon.com, Inc. | 0.90 | -6.09 | 196.65 | 8.29 | 4.2035 | -0.0246 | |||
| META / Meta Platforms, Inc. | 0.19 | -18.24 | 140.12 | 4.70 | 2.9952 | -0.1208 | |||
| AVGO / Broadcom Inc. | 0.50 | 0.70 | 138.92 | 65.79 | 2.9695 | 1.0186 | |||
| BRK.B / Berkshire Hathaway Inc. | 0.21 | -0.60 | 100.80 | -9.34 | 2.1546 | -0.4339 | |||
| GOOG / Alphabet Inc. | 0.55 | 22.16 | 96.81 | 38.70 | 2.0695 | 0.4443 | |||
| GOOGL / Alphabet Inc. | 0.51 | -1.88 | 90.45 | 11.82 | 1.9335 | 0.0502 | |||
| JPM / JPMorgan Chase & Co. | 0.30 | -2.62 | 87.31 | 15.09 | 1.8663 | 0.1001 | |||
| NFLX / Netflix, Inc. | 0.06 | -6.25 | 76.84 | 34.63 | 1.6425 | 0.3137 | |||
| TSLA / Tesla, Inc. | 0.21 | 28.10 | 66.82 | 57.02 | 1.4283 | 0.4375 | |||
| MA / Mastercard Incorporated | 0.11 | 5.87 | 63.63 | 8.54 | 1.3601 | -0.0047 | |||
| HD / The Home Depot, Inc. | 0.15 | 17.16 | 55.27 | 17.21 | 1.1814 | 0.0836 | |||
| ABBV / AbbVie Inc. | 0.28 | 2.96 | 51.19 | -8.78 | 1.0941 | -0.2123 | |||
| PM / Philip Morris International Inc. | 0.27 | 36.04 | 48.78 | 56.09 | 1.0426 | 0.3151 | |||
| CRM / Salesforce, Inc. | 0.17 | 41.52 | 46.12 | 43.81 | 0.9859 | 0.2392 | |||
| DIS / The Walt Disney Company | 0.36 | -4.74 | 44.35 | 19.69 | 0.9481 | 0.0853 | |||
| BAC / Bank of America Corporation | 0.90 | -11.45 | 42.53 | 0.41 | 0.9092 | -0.0771 | |||
| UBER / Uber Technologies, Inc. | 0.45 | 234,209.38 | 41.97 | 322,769.23 | 0.8972 | 0.8969 | |||
| US31635A1051 / Fidelity Cash Central Fund | 40.23 | 20.94 | 40.24 | 20.94 | 0.8601 | 0.0855 | |||
| MRK / Merck & Co., Inc. | 0.51 | 6.78 | 40.14 | -5.83 | 0.8580 | -0.1344 | |||
| QCOM / QUALCOMM Incorporated | 0.25 | 0.60 | 39.51 | 4.30 | 0.8446 | -0.0374 | |||
| AMAT / Applied Materials, Inc. | 0.21 | -1.22 | 38.69 | 24.61 | 0.8269 | 0.1041 | |||
| WMT / Walmart Inc. | 0.39 | -3.10 | 38.60 | 7.92 | 0.8251 | -0.0076 | |||
| V / Visa Inc. | 0.11 | 24.34 | 38.37 | 25.97 | 0.8201 | 0.1110 | |||
| BSX / Boston Scientific Corporation | 0.35 | 648.38 | 37.56 | 696.88 | 0.8028 | 0.6931 | |||
| ADBE / Adobe Inc. | 0.10 | 4.13 | 37.37 | 5.04 | 0.7988 | -0.0295 | |||
| PGR / The Progressive Corporation | 0.14 | 3.32 | 36.23 | -2.58 | 0.7744 | -0.0914 | |||
| GILD / Gilead Sciences, Inc. | 0.31 | -0.37 | 34.89 | -1.42 | 0.7458 | -0.0782 | |||
| SCHW / The Charles Schwab Corporation | 0.38 | -13.78 | 34.50 | 0.49 | 0.7375 | -0.0619 | |||
| HON / Honeywell International Inc. | 0.15 | 34.21 | 0.7312 | 0.7312 | |||||
| COST / Costco Wholesale Corporation | 0.03 | 41.20 | 33.72 | 47.80 | 0.7209 | 0.1896 | |||
| TT / Trane Technologies plc | 0.08 | -11.22 | 33.03 | 15.27 | 0.7061 | 0.0389 | |||
| PFE / Pfizer Inc. | 1.33 | 31.98 | 32.36 | 26.25 | 0.6917 | 0.0949 | |||
| DASH / DoorDash, Inc. | 0.13 | 13.57 | 32.33 | 53.17 | 0.6910 | 0.1996 | |||
| CSCO / Cisco Systems, Inc. | 0.46 | 20.57 | 32.09 | 35.55 | 0.6858 | 0.1347 | |||
| LLY / Eli Lilly and Company | 0.04 | -23.12 | 31.30 | -27.44 | 0.6691 | -0.3353 | |||
| GS / The Goldman Sachs Group, Inc. | 0.04 | 32.15 | 30.80 | 71.21 | 0.6585 | 0.2396 | |||
| WMB / The Williams Companies, Inc. | 0.49 | 30.62 | 0.6546 | 0.6546 | |||||
| PG / The Procter & Gamble Company | 0.19 | -25.37 | 30.29 | -30.23 | 0.6474 | -0.3633 | |||
| CTAS / Cintas Corporation | 0.14 | -8.37 | 30.18 | -0.64 | 0.6450 | -0.0621 | |||
| LMT / Lockheed Martin Corporation | 0.06 | -1.44 | 29.87 | 2.19 | 0.6384 | -0.0421 | |||
| ECL / Ecolab Inc. | 0.11 | -1.45 | 29.66 | 4.74 | 0.6340 | -0.0253 | |||
| BMY / Bristol-Myers Squibb Company | 0.64 | 48.89 | 29.53 | 13.00 | 0.6313 | 0.0228 | |||
| GE / General Electric Company | 0.11 | 26.99 | 29.13 | 63.31 | 0.6226 | 0.2074 | |||
| EOG / EOG Resources, Inc. | 0.24 | 14.33 | 29.11 | 6.63 | 0.6223 | -0.0134 | |||
| MS / Morgan Stanley | 0.19 | -33.60 | 27.37 | -19.83 | 0.5851 | -0.2098 | |||
| FDX / FedEx Corporation | 0.12 | 40.76 | 27.34 | 31.25 | 0.5844 | 0.0994 | |||
| HUM / Humana Inc. | 0.11 | 370.41 | 26.37 | 334.64 | 0.5638 | 0.4225 | |||
| NEE / NextEra Energy, Inc. | 0.38 | 14.27 | 26.21 | 11.90 | 0.5603 | 0.0149 | |||
| LDOS / Leidos Holdings, Inc. | 0.16 | -14.59 | 24.62 | -0.14 | 0.5263 | -0.0478 | |||
| CAH / Cardinal Health, Inc. | 0.15 | 531.55 | 24.39 | 797.28 | 0.5213 | 0.4574 | |||
| EXPE / Expedia Group, Inc. | 0.14 | 189.40 | 24.32 | 190.42 | 0.5199 | 0.3249 | |||
| UNP / Union Pacific Corporation | 0.10 | 0.85 | 23.97 | -1.78 | 0.5123 | -0.0558 | |||
| T / AT&T Inc. | 0.82 | 16.52 | 23.78 | 19.24 | 0.5083 | 0.0440 | |||
| VEEV / Veeva Systems Inc. | 0.08 | 301.25 | 23.75 | 398.93 | 0.5077 | 0.3968 | |||
| LYFT / Lyft, Inc. | 1.50 | -10.59 | 23.66 | 18.71 | 0.5056 | 0.0417 | |||
| LNG / Cheniere Energy, Inc. | 0.10 | 18.99 | 23.42 | 25.22 | 0.5006 | 0.0652 | |||
| CME / CME Group Inc. | 0.08 | 20.87 | 22.68 | 25.58 | 0.4849 | 0.0643 | |||
| ALL / The Allstate Corporation | 0.11 | 23.08 | 22.08 | 19.66 | 0.4719 | 0.0423 | |||
| SPGI / S&P Global Inc. | 0.04 | -11.85 | 21.53 | -8.52 | 0.4602 | -0.0877 | |||
| TJX / The TJX Companies, Inc. | 0.17 | 1.78 | 21.02 | 3.19 | 0.4492 | -0.0249 | |||
| EA / Electronic Arts Inc. | 0.13 | 859.81 | 20.56 | 960.78 | 0.4394 | 0.3943 | |||
| PYPL / PayPal Holdings, Inc. | 0.28 | -19.27 | 20.46 | -8.05 | 0.4374 | -0.0807 | |||
| JNJ / Johnson & Johnson | 0.13 | -22.61 | 19.90 | -28.72 | 0.4254 | -0.2246 | |||
| CSX / CSX Corporation | 0.60 | -31.49 | 19.67 | -24.04 | 0.4204 | -0.1824 | |||
| XOM / Exxon Mobil Corporation | 0.18 | -69.35 | 19.65 | -72.22 | 0.4201 | -1.2268 | |||
| GWW / W.W. Grainger, Inc. | 0.02 | 127.68 | 19.30 | 124.70 | 0.4125 | 0.2106 | |||
| ZM / Zoom Communications Inc. | 0.25 | 30.18 | 19.24 | 37.62 | 0.4113 | 0.0858 | |||
| SYF / Synchrony Financial | 0.28 | 18.89 | 0.4038 | 0.4038 | |||||
| NEM / Newmont Corporation | 0.31 | 193.98 | 18.13 | 254.77 | 0.3875 | 0.2685 | |||
| MSI / Motorola Solutions, Inc. | 0.04 | -31.30 | 17.97 | -34.02 | 0.3841 | -0.2500 | |||
| PNC / The PNC Financial Services Group, Inc. | 0.10 | 17.88 | 0.3821 | 0.3821 | |||||
| ALLE / Allegion plc | 0.12 | -18.85 | 17.73 | -10.35 | 0.3790 | -0.0815 | |||
| AMT / American Tower Corporation | 0.08 | -32.59 | 17.69 | -31.53 | 0.3781 | -0.2234 | |||
| VZ / Verizon Communications Inc. | 0.41 | 41.61 | 17.56 | 35.10 | 0.3754 | 0.0727 | |||
| CRH / CRH plc | 0.19 | 48.39 | 17.37 | 54.85 | 0.3712 | 0.1101 | |||
| MPC / Marathon Petroleum Corporation | 0.10 | 328.83 | 16.41 | 253.54 | 0.3507 | 0.1608 | |||
| ADSK / Autodesk, Inc. | 0.05 | 15.21 | 0.3252 | 0.3252 | |||||
| ADP / Automatic Data Processing, Inc. | 0.05 | -47.32 | 15.06 | -46.82 | 0.3220 | -0.3375 | |||
| GD / General Dynamics Corporation | 0.05 | 427,883.33 | 14.98 | 499,200.00 | 0.3202 | 0.3201 | |||
| LIN / Linde plc | 0.03 | -4.04 | 14.96 | -3.31 | 0.3198 | -0.0405 | |||
| ICE / Intercontinental Exchange, Inc. | 0.08 | 14.66 | 0.3134 | 0.3134 | |||||
| WDC / Western Digital Corporation | 0.23 | 14.59 | 0.3118 | 0.3118 | |||||
| ITRI / Itron, Inc. | 0.11 | 22.18 | 14.19 | 53.52 | 0.3033 | 0.0881 | |||
| ADI / Analog Devices, Inc. | 0.06 | 14.13 | 0.3021 | 0.3021 | |||||
| EQIX / Equinix, Inc. | 0.02 | 348.56 | 14.00 | 337.68 | 0.2992 | 0.2247 | |||
| AMCR / Amcor plc | 1.50 | 13.79 | 0.2947 | 0.2947 | |||||
| CNC / Centene Corporation | 0.24 | 960.98 | 13.16 | 849.13 | 0.2812 | 0.2489 | |||
| MCD / McDonald's Corporation | 0.04 | 741,200.00 | 13.00 | 1,299,400.00 | 0.2778 | 0.2777 | |||
| ELV / Elevance Health, Inc. | 0.03 | -48.53 | 12.99 | -53.97 | 0.2776 | -0.3794 | |||
| HWM / Howmet Aerospace Inc. | 0.07 | 105.18 | 12.95 | 280.96 | 0.2768 | 0.1826 | |||
| CMCSA / Comcast Corporation | 0.36 | -62.99 | 12.77 | -64.21 | 0.2730 | -0.5577 | |||
| TMUS / T-Mobile US, Inc. | 0.05 | -6.30 | 12.61 | -16.30 | 0.2696 | -0.0812 | |||
| CVS / CVS Health Corporation | 0.18 | 378,239.58 | 12.53 | 417,433.33 | 0.2678 | 0.2677 | |||
| AXON / Axon Enterprise, Inc. | 0.01 | 12.23 | 0.2615 | 0.2615 | |||||
| VMI / Valmont Industries, Inc. | 0.04 | -1.42 | 12.22 | 12.81 | 0.2613 | 0.0090 | |||
| TRV / The Travelers Companies, Inc. | 0.05 | 90.10 | 12.22 | 111.14 | 0.2612 | 0.1252 | |||
| RBLX / Roblox Corporation | 0.12 | 1,362.70 | 12.22 | 2,544.81 | 0.2612 | 0.2504 | |||
| CRUS / Cirrus Logic, Inc. | 0.12 | 29.72 | 12.17 | 35.72 | 0.2602 | 0.0514 | |||
| GPN / Global Payments Inc. | 0.15 | 2,306.73 | 12.13 | 1,869.16 | 0.2593 | 0.2449 | |||
| BIIB / Biogen Inc. | 0.09 | 11.19 | 11.33 | 2.04 | 0.2423 | -0.0163 | |||
| UNH / UnitedHealth Group Incorporated | 0.04 | -68.90 | 11.30 | -81.48 | 0.2415 | -1.1786 | |||
| DLR / Digital Realty Trust, Inc. | 0.06 | 11.28 | 0.2412 | 0.2412 | |||||
| BDX / Becton, Dickinson and Company | 0.06 | -49.78 | 10.86 | -62.23 | 0.2322 | -0.4374 | |||
| CVNA / Carvana Co. | 0.03 | -72.26 | 10.75 | -55.30 | 0.2299 | -0.3302 | |||
| F / Ford Motor Company | 0.98 | -61.88 | 10.62 | -58.76 | 0.2270 | -0.3726 | |||
| ALRM / Alarm.com Holdings, Inc. | 0.19 | -1.45 | 10.61 | 0.18 | 0.2268 | -0.0198 | |||
| INCY / Incyte Corporation | 0.15 | -57.21 | 10.54 | -51.88 | 0.2253 | -0.2847 | |||
| FTNT / Fortinet, Inc. | 0.10 | -43.83 | 10.36 | -38.32 | 0.2216 | -0.1696 | |||
| GRMN / Garmin Ltd. | 0.05 | -57.25 | 10.31 | -58.91 | 0.2205 | -0.3639 | |||
| IT / Gartner, Inc. | 0.03 | 10.28 | 0.2198 | 0.2198 | |||||
| AMD / Advanced Micro Devices, Inc. | 0.07 | -40.46 | 10.09 | -17.77 | 0.2157 | -0.0700 | |||
| LOW / Lowe's Companies, Inc. | 0.04 | 9.70 | 0.2074 | 0.2074 | |||||
| FI / Fiserv, Inc. | 0.05 | -27.26 | 9.17 | -43.21 | 0.1959 | -0.1799 | |||
| ABT / Abbott Laboratories | 0.07 | -25.41 | 8.85 | -10.32 | 0.1892 | -0.0428 | |||
| EXEL / Exelixis, Inc. | 0.20 | -58.95 | 8.72 | -50.99 | 0.1865 | -0.2280 | |||
| TROW / T. Rowe Price Group, Inc. | 0.09 | 9.03 | 8.30 | 14.53 | 0.1775 | 0.0087 | |||
| TSN / Tyson Foods, Inc. | 0.15 | 7.15 | 8.25 | -6.06 | 0.1764 | -0.0281 | |||
| GAP / The Gap, Inc. | 0.37 | -35.29 | 8.08 | -31.52 | 0.1726 | -0.1020 | |||
| BBY / Best Buy Co., Inc. | 0.12 | 379.14 | 7.85 | 337.10 | 0.1677 | 0.1259 | |||
| TDC / Teradata Corporation | 0.35 | -15.51 | 7.77 | -16.15 | 0.1661 | -0.0496 | |||
| CTRE / CareTrust REIT, Inc. | 0.25 | -1.08 | 7.66 | 5.92 | 0.1636 | -0.0046 | |||
| MKL / Markel Group Inc. | 0.00 | 7.59 | 0.1622 | 0.1622 | |||||
| CAT / Caterpillar Inc. | 0.02 | -66.85 | 7.17 | -60.98 | 0.1534 | -0.2747 | |||
| BCPC / Balchem Corporation | 0.04 | 114.55 | 7.00 | 105.76 | 0.1496 | 0.0704 | |||
| CCL / Carnival Corporation & plc | 0.23 | -1.45 | 6.58 | 41.90 | 0.1407 | 0.0327 | |||
| SRE / Sempra | 0.08 | 47.60 | 6.23 | 56.72 | 0.1331 | 0.0406 | |||
| BKNG / Booking Holdings Inc. | 0.00 | 0.00 | 6.09 | 25.67 | 0.1302 | 0.0173 | |||
| EXR / Extra Space Storage Inc. | 0.04 | 5.99 | 0.1281 | 0.1281 | |||||
| CINF / Cincinnati Financial Corporation | 0.04 | 67,594.74 | 5.75 | 71,725.00 | 0.1228 | 0.1226 | |||
| CBOE / Cboe Global Markets, Inc. | 0.02 | 256.38 | 5.66 | 267.29 | 0.1210 | 0.0851 | |||
| PRU / Prudential Financial, Inc. | 0.05 | 5.57 | 0.1190 | 0.1190 | |||||
| ORCL / Oracle Corporation | 0.03 | 878.61 | 5.53 | 1,431.86 | 0.1182 | 0.1098 | |||
| BBWI / Bath & Body Works, Inc. | 0.18 | 31.50 | 5.47 | 29.93 | 0.1170 | 0.0189 | |||
| CW / Curtiss-Wright Corporation | 0.01 | 5.37 | 0.1149 | 0.1149 | |||||
| RITM / Rithm Capital Corp. | 0.47 | -54.47 | 5.30 | -55.11 | 0.1133 | -0.1617 | |||
| KD / Kyndryl Holdings, Inc. | 0.12 | 5.16 | 0.1103 | 0.1103 | |||||
| STE / STERIS plc | 0.02 | 4.46 | 0.0954 | 0.0954 | |||||
| THC / Tenet Healthcare Corporation | 0.02 | 4.32 | 0.0924 | 0.0924 | |||||
| HEI / HEICO Corporation | 0.01 | 4.27 | 0.0912 | 0.0912 | |||||
| NTAP / NetApp, Inc. | 0.04 | -10.94 | 4.16 | 8.03 | 0.0889 | -0.0007 | |||
| CCK / Crown Holdings, Inc. | 0.04 | 3.90 | 0.0834 | 0.0834 | |||||
| ULTA / Ulta Beauty, Inc. | 0.01 | 3.80 | 0.0813 | 0.0813 | |||||
| PTCT / PTC Therapeutics, Inc. | 0.08 | 265.66 | 3.76 | 250.51 | 0.0804 | 0.0554 | |||
| SKYW / SkyWest, Inc. | 0.04 | -59.41 | 3.72 | -52.17 | 0.0795 | -0.1015 | |||
| MORN / Morningstar, Inc. | 0.01 | 3.64 | 0.0778 | 0.0778 | |||||
| DNB / Dun & Bradstreet Holdings, Inc. | 0.40 | 3.63 | 0.0776 | 0.0776 | |||||
| PLTR / Palantir Technologies Inc. | 0.03 | 3.47 | 0.0741 | 0.0741 | |||||
| EXC / Exelon Corporation | 0.08 | -59.61 | 3.44 | -61.94 | 0.0734 | -0.1367 | |||
| CI / The Cigna Group | 0.01 | -86.80 | 3.42 | -84.20 | 0.0731 | -0.4354 | |||
| ANF / Abercrombie & Fitch Co. | 0.04 | -61.53 | 3.31 | -58.27 | 0.0708 | -0.1140 | |||
| DBX / Dropbox, Inc. | 0.12 | -39.00 | 3.30 | -34.68 | 0.0706 | -0.0471 | |||
| MMS / Maximus, Inc. | 0.05 | 0.00 | 3.21 | 2.92 | 0.0685 | -0.0040 | |||
| USB / U.S. Bancorp | 0.07 | 3.21 | 0.0685 | 0.0685 | |||||
| COF / Capital One Financial Corporation | 0.01 | 325.52 | 3.10 | 505.07 | 0.0664 | 0.0521 | |||
| KLAC / KLA Corporation | 0.00 | -89.57 | 3.06 | -86.26 | 0.0655 | -0.4534 | |||
| BRSL / Brightstar Lottery PLC | 0.18 | -63.40 | 2.83 | -64.41 | 0.0605 | -0.1246 | |||
| PEP / PepsiCo, Inc. | 0.02 | 34.16 | 2.74 | 18.19 | 0.0585 | 0.0046 | |||
| SPXC / SPX Technologies, Inc. | 0.02 | 2.65 | 0.0566 | 0.0566 | |||||
| GM / General Motors Company | 0.05 | 180.94 | 2.44 | 194.10 | 0.0522 | 0.0328 | |||
| KO / The Coca-Cola Company | 0.03 | 224.09 | 2.31 | 220.06 | 0.0495 | 0.0326 | |||
| WFC / Wells Fargo & Company | 0.03 | -91.62 | 2.12 | -90.66 | 0.0453 | -0.4825 | |||
| GBTG / Global Business Travel Group, Inc. | 0.32 | 736.39 | 1.99 | 626.64 | 0.0426 | 0.0362 | |||
| UST BILLS 0% 07/17/2025 / DBT (US912797PE18) | 1.88 | 0.0401 | 0.0401 | ||||||
| NOW / ServiceNow, Inc. | 0.00 | -92.23 | 1.85 | -89.97 | 0.0396 | -0.3905 | |||
| DVN / Devon Energy Corporation | 0.06 | -82.49 | 1.78 | -82.99 | 0.0380 | -0.2078 | |||
| ISRG / Intuitive Surgical, Inc. | 0.00 | 1.77 | 0.0379 | 0.0379 | |||||
| RUSHA / Rush Enterprises, Inc. | 0.03 | 1.74 | 0.0373 | 0.0373 | |||||
| DD / DuPont de Nemours, Inc. | 0.02 | 1.69 | 0.0361 | 0.0361 | |||||
| STT / State Street Corporation | 0.02 | 1.62 | 0.0346 | 0.0346 | |||||
| US31635A3032 / Fidelity Securities Lending Cash Central Fund | 1.52 | 10.78 | 1.52 | 10.74 | 0.0324 | 0.0005 | |||
| S and P500 EMINI FUT SEP25 ESU5 / DE (N/A) | 1.08 | 0.0231 | 0.0231 | ||||||
| MTG / MGIC Investment Corporation | 0.03 | -72.11 | 0.95 | -60.98 | 0.0203 | -0.0826 | |||
| UST BILLS 0% 07/24/2025 / DBT (US912797PF82) | 0.76 | 0.0162 | 0.0162 | ||||||
| CMC / Commercial Metals Company | 0.02 | 0.76 | 0.0162 | 0.0162 | |||||
| COMP / Compass, Inc. | 0.10 | -87.08 | 0.66 | -90.72 | 0.0141 | -0.1508 | |||
| TOL / Toll Brothers, Inc. | 0.01 | 0.58 | 0.0123 | 0.0123 | |||||
| FTI / TechnipFMC plc | 0.01 | -88.87 | 0.49 | -87.92 | 0.0106 | -0.0846 | |||
| AVA / Avista Corporation | 0.01 | 0.49 | 0.0105 | 0.0105 | |||||
| MTH / Meritage Homes Corporation | 0.01 | -67.06 | 0.46 | -68.88 | 0.0099 | -0.0248 | |||
| IBM / International Business Machines Corporation | 0.00 | 0.42 | 0.0090 | 0.0090 | |||||
| UST BILLS 0% 09/04/2025 / DBT (US912797MH75) | 0.33 | 0.0070 | 0.0070 | ||||||
| UST BILLS 0% 08/21/2025 / DBT (US912797PP64) | 0.29 | 0.0062 | 0.0062 | ||||||
| CRDO / Credo Technology Group Holding Ltd | 0.00 | 0.28 | 0.0059 | 0.0059 | |||||
| BKH / Black Hills Corporation | 0.00 | 11,893.75 | 0.22 | 21,400.00 | 0.0046 | 0.0045 | |||
| OXY / Occidental Petroleum Corporation | 0.00 | 4,056.41 | 0.20 | 3,980.00 | 0.0044 | 0.0042 | |||
| UST BILLS 0% 08/07/2025 / DBT (US912797MG92) | 0.20 | 0.0043 | 0.0043 | ||||||
| UST BILLS 0% 09/18/2025 / DBT (US912797PX98) | 0.16 | 0.0034 | 0.0034 | ||||||
| UST BILLS 0% 09/11/2025 / DBT (US912797PW16) | 0.07 | 0.0015 | 0.0015 | ||||||
| MSCI / MSCI Inc. | 0.00 | -99.86 | 0.01 | -99.88 | 0.0001 | -0.0961 | |||
| ABNB / Airbnb, Inc. | 0.00 | -99.96 | 0.01 | -99.97 | 0.0001 | -0.3364 | |||
| CVLT / Commvault Systems, Inc. | 0.00 | 0.00 | 0.0000 | 0.0000 | |||||
| ANET / Arista Networks Inc | 0.00 | 0.00 | 0.00 | 0.0000 | 0.0000 | ||||
| AXTA / Axalta Coating Systems Ltd. | 0.00 | -99.66 | 0.00 | -100.00 | 0.0000 | -0.0023 | |||
| WM / Waste Management, Inc. | 0.00 | 0.00 | 0.00 | 0.0000 | -0.0000 | ||||
| MHO / M/I Homes, Inc. | 0.00 | -99.95 | 0.00 | -100.00 | 0.0000 | -0.0113 | |||
| LRCX / Lam Research Corporation | 0.00 | -99.98 | 0.00 | -100.00 | 0.0000 | -0.0224 | |||
| COKE / Coca-Cola Consolidated, Inc. | 0.00 | -100.00 | 0.00 | -100.00 | -0.1033 | ||||
| PAYO / Payoneer Global Inc. | 0.00 | -100.00 | 0.00 | -100.00 | -0.0001 | ||||
| WELL / Welltower Inc. | 0.00 | -100.00 | 0.00 | -100.00 | -0.1297 | ||||
| DOCS / Doximity, Inc. | 0.00 | -100.00 | 0.00 | -100.00 | -0.0374 | ||||
| DUOL / Duolingo, Inc. | 0.00 | -100.00 | 0.00 | -100.00 | -0.1134 | ||||
| KMI / Kinder Morgan, Inc. | 0.00 | -100.00 | 0.00 | -100.00 | -0.2120 | ||||
| VICI / VICI Properties Inc. | 0.00 | -100.00 | 0.00 | -100.00 | -0.3312 | ||||
| WAB / Westinghouse Air Brake Technologies Corporation | 0.00 | -100.00 | 0.00 | -100.00 | -0.0594 | ||||
| 1OKTA / Okta, Inc. | 0.00 | -100.00 | 0.00 | -100.00 | -0.0963 | ||||
| CCI / Crown Castle Inc. | 0.00 | -100.00 | 0.00 | -100.00 | -0.0002 |