Statistik Asas
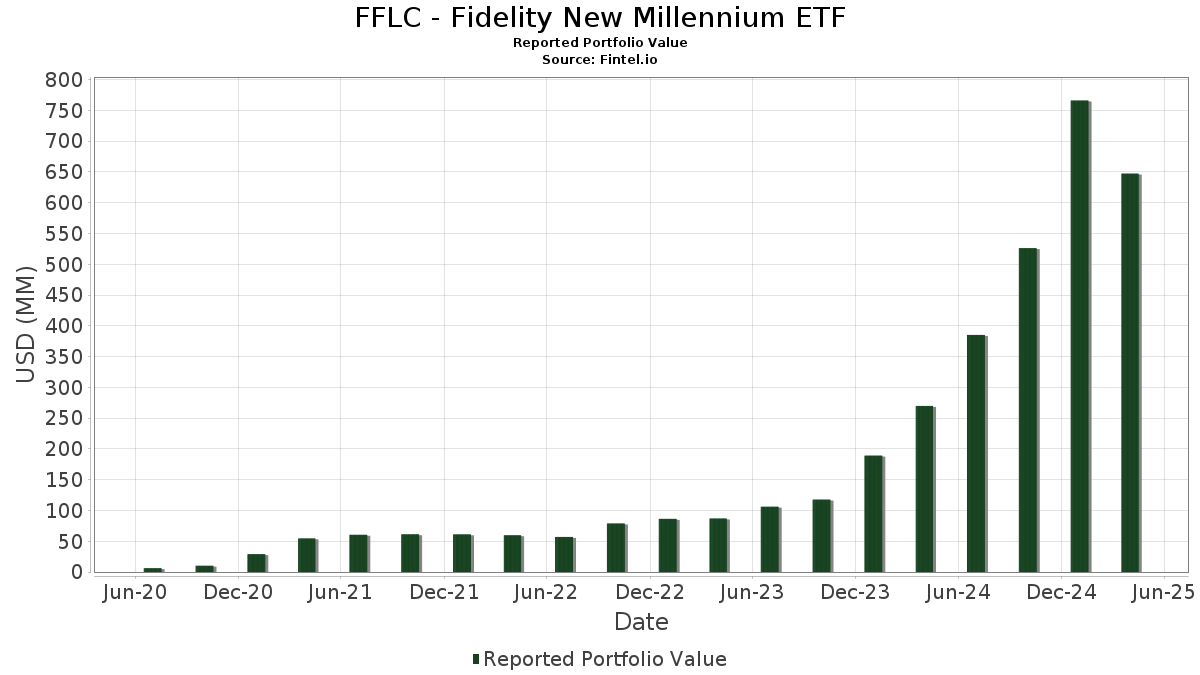
| Nilai Portfolio | $ 647,221,304 |
| Kedudukan Semasa | 107 |
Pegangan Terkini, Prestasi, AUM (dari 13F, 13D)
FFLC - Fidelity New Millennium ETF telah mendedahkan 107 jumlah pegangan dalam pemfailan SEC terkini mereka. Nilai portfolio terkini dikira sebagai $ 647,221,304 USD. Aset Sebenar Di Bawah Pengurusan (AUM) ialah nilai ini ditambah dengan tunai (yang tidak didedahkan). Pegangan teratas FFLC - Fidelity New Millennium ETF ialah Microsoft Corporation (US:MSFT) , NVIDIA Corporation (US:NVDA) , Meta Platforms, Inc. (US:META) , Alphabet Inc. (US:GOOGL) , and Amazon.com, Inc. (US:AMZN) . Kedudukan baharu FFLC - Fidelity New Millennium ETF termasuk The Bank of New York Mellon Corporation (US:BK) , Sempra (US:SRE) , Kyndryl Holdings, Inc. (US:KD) , Philip Morris International Inc. (US:PM) , and Norfolk Southern Corporation (US:NSC) .
Kenaikan Teratas Suku Tahun Ini
Kami menggunakan perubahan dalam peruntukan portfolio kerana ini adalah metrik yang paling bermakna. Perubahan boleh disebabkan oleh perdagangan atau perubahan dalam harga saham.
| Sekuriti | Saham (MM) |
Nilai (MM$) |
Portfolio % | ΔPortfolio % |
|---|---|---|---|---|
| 0.01 | 6.42 | 0.9916 | 0.9916 | |
| 0.10 | 38.96 | 6.0189 | 0.9073 | |
| 0.06 | 5.15 | 0.7951 | 0.7951 | |
| 0.04 | 4.15 | 0.6403 | 0.6403 | |
| 0.05 | 3.84 | 0.5936 | 0.5936 | |
| 0.10 | 3.25 | 0.5024 | 0.5024 | |
| 0.02 | 3.04 | 0.4696 | 0.4696 | |
| 0.05 | 8.89 | 1.3734 | 0.4246 | |
| 0.01 | 13.43 | 2.0746 | 0.3686 | |
| 0.13 | 13.75 | 2.1234 | 0.3235 |
Penurunan Teratas Suku Tahun Ini
Kami menggunakan perubahan dalam peruntukan portfolio kerana ini adalah metrik yang paling bermakna. Perubahan boleh disebabkan oleh perdagangan atau perubahan dalam harga saham.
| Sekuriti | Saham (MM) |
Nilai (MM$) |
Portfolio % | ΔPortfolio % |
|---|---|---|---|---|
| 0.00 | 0.00 | -1.1255 | ||
| 0.17 | 26.25 | 4.0543 | -1.1164 | |
| 0.00 | 0.81 | 0.1253 | -0.8834 | |
| 0.06 | 31.13 | 4.8092 | -0.7060 | |
| 0.06 | 11.49 | 1.7753 | -0.6243 | |
| 0.01 | 0.77 | 0.1183 | -0.4678 | |
| 0.03 | 1.28 | 0.1979 | -0.4601 | |
| 0.05 | 2.66 | 0.4113 | -0.3934 | |
| 0.00 | 0.00 | -0.3878 | ||
| 0.01 | 1.62 | 0.2501 | -0.3444 |
13F dan Pemfailan Dana
Borang ini telah difailkan pada 2025-06-26 untuk tempoh pelaporan 2025-04-30. Klik ikon pautan untuk melihat sejarah transaksi penuh.
Tingkatkan untuk membuka data premium dan eksport ke Excel ![]() .
.
| Sekuriti | Jenis | Purata Harga Saham | Saham (MM) |
ΔSaham (%) |
ΔSaham (%) |
Nilai ($MM) |
Portfolio (%) |
ΔPortfolio (%) |
|
|---|---|---|---|---|---|---|---|---|---|
| MSFT / Microsoft Corporation | 0.10 | 4.47 | 38.96 | -0.51 | 6.0189 | 0.9073 | |||
| NVDA / NVIDIA Corporation | 0.34 | -9.13 | 37.38 | -17.57 | 5.7748 | -0.1442 | |||
| META / Meta Platforms, Inc. | 0.06 | -7.51 | 31.13 | -26.33 | 4.8092 | -0.7060 | |||
| GOOGL / Alphabet Inc. | 0.17 | -14.89 | 26.25 | -33.75 | 4.0543 | -1.1164 | |||
| AMZN / Amazon.com, Inc. | 0.13 | 3.23 | 24.85 | -19.90 | 3.8381 | -0.2104 | |||
| AAPL / Apple Inc. | 0.11 | -6.98 | 24.43 | -16.24 | 3.7746 | -0.0330 | |||
| XOM / Exxon Mobil Corporation | 0.16 | -9.43 | 17.40 | -10.45 | 2.6881 | 0.1519 | |||
| WFC / Wells Fargo & Company | 0.22 | -7.53 | 15.76 | -16.67 | 2.4343 | -0.0341 | |||
| BAC / Bank of America Corporation | 0.37 | -7.54 | 14.64 | -20.36 | 2.2621 | -0.1378 | |||
| BSX / Boston Scientific Corporation | 0.13 | -0.82 | 13.75 | -0.33 | 2.1234 | 0.3235 | |||
| LLY / Eli Lilly and Company | 0.01 | -7.30 | 13.43 | 2.75 | 2.0746 | 0.3686 | |||
| V / Visa Inc. | 0.04 | -7.50 | 12.32 | -6.50 | 1.9031 | 0.1834 | |||
| GE / General Electric Company | 0.06 | -7.48 | 11.97 | -8.40 | 1.8491 | 0.1435 | |||
| AVGO / Broadcom Inc. | 0.06 | -28.14 | 11.49 | -37.49 | 1.7753 | -0.6243 | |||
| SAP / SAP SE - Depositary Receipt (Common Stock) | 0.04 | -7.42 | 10.35 | -2.01 | 1.5990 | 0.2202 | |||
| UNH / UnitedHealth Group Incorporated | 0.02 | -7.97 | 9.70 | -30.20 | 1.4991 | -0.3155 | |||
| FI / Fiserv, Inc. | 0.05 | -7.50 | 9.60 | -20.97 | 1.4827 | -0.1025 | |||
| CMCSA / Comcast Corporation | 0.27 | -10.70 | 9.31 | -9.27 | 1.4379 | 0.0990 | |||
| GEV / GE Vernova Inc. | 0.02 | -7.46 | 9.24 | -7.98 | 1.4275 | 0.1169 | |||
| BA / The Boeing Company | 0.05 | 17.82 | 8.89 | 22.30 | 1.3734 | 0.4246 | |||
| CI / The Cigna Group | 0.03 | -7.43 | 8.51 | 6.99 | 1.3147 | 0.2765 | |||
| CSCO / Cisco Systems, Inc. | 0.15 | -7.53 | 8.41 | -11.91 | 1.2994 | 0.0532 | |||
| MA / Mastercard Incorporated | 0.01 | 1.86 | 7.32 | 0.51 | 1.1308 | 0.1802 | |||
| APH / Amphenol Corporation | 0.09 | -7.53 | 7.22 | 0.53 | 1.1156 | 0.1780 | |||
| KVUE / Kenvue Inc. | 0.30 | -11.79 | 7.20 | -2.21 | 1.1118 | 0.1511 | |||
| SHEL / Shell plc - Depositary Receipt (Common Stock) | 0.11 | -7.51 | 7.15 | -9.44 | 1.1052 | 0.0741 | |||
| RPRX / Royalty Pharma plc | 0.22 | 1.75 | 7.07 | 5.74 | 1.0920 | 0.2195 | |||
| TRV / The Travelers Companies, Inc. | 0.03 | -7.54 | 6.99 | -0.39 | 1.0791 | 0.1638 | |||
| KO / The Coca-Cola Company | 0.09 | -7.53 | 6.77 | 5.69 | 1.0451 | 0.2095 | |||
| KDP / Keurig Dr Pepper Inc. | 0.19 | -7.55 | 6.58 | -0.38 | 1.0169 | 0.1545 | |||
| NFLX / Netflix, Inc. | 0.01 | 6.42 | 0.9916 | 0.9916 | |||||
| PNC / The PNC Financial Services Group, Inc. | 0.04 | -7.46 | 6.25 | -26.01 | 0.9650 | -0.1369 | |||
| LOW / Lowe's Companies, Inc. | 0.03 | -7.52 | 6.20 | -20.50 | 0.9570 | -0.0600 | |||
| USB / U.S. Bancorp | 0.15 | -7.54 | 5.92 | -21.93 | 0.9138 | -0.0752 | |||
| TSM / Taiwan Semiconductor Manufacturing Company Limited - Depositary Receipt (Common Stock) | 0.03 | -21.58 | 5.59 | -37.54 | 0.8629 | -0.3046 | |||
| BK / The Bank of New York Mellon Corporation | 0.06 | 5.15 | 0.7951 | 0.7951 | |||||
| CB / Chubb Limited | 0.02 | 16.76 | 4.98 | 22.86 | 0.7690 | 0.2401 | |||
| APO / Apollo Global Management, Inc. | 0.04 | -7.46 | 4.89 | -26.14 | 0.7561 | -0.1087 | |||
| MTB / M&T Bank Corporation | 0.03 | -7.42 | 4.88 | -21.89 | 0.7540 | -0.0617 | |||
| AJG / Arthur J. Gallagher & Co. | 0.01 | -7.38 | 4.73 | -1.58 | 0.7307 | 0.1033 | |||
| WAB / Westinghouse Air Brake Technologies Corporation | 0.03 | 0.01 | 4.66 | -11.14 | 0.7195 | 0.0354 | |||
| SO / The Southern Company | 0.05 | 36.32 | 4.66 | 49.25 | 0.7191 | 0.3119 | |||
| HRB / H&R Block, Inc. | 0.07 | -7.53 | 4.50 | 0.92 | 0.6954 | 0.1132 | |||
| ALSN / Allison Transmission Holdings, Inc. | 0.05 | 0.00 | 4.46 | -21.52 | 0.6889 | -0.0528 | |||
| HLT / Hilton Worldwide Holdings Inc. | 0.02 | 0.62 | 4.19 | -11.39 | 0.6479 | 0.0301 | |||
| NTRS / Northern Trust Corporation | 0.04 | 4.15 | 0.6403 | 0.6403 | |||||
| CCI / Crown Castle Inc. | 0.04 | -7.46 | 4.12 | 9.62 | 0.6358 | 0.1458 | |||
| GSK / GSK plc - Depositary Receipt (Common Stock) | 0.10 | 1.00 | 4.03 | 14.14 | 0.6225 | 0.1616 | |||
| UPS / United Parcel Service, Inc. | 0.04 | -7.48 | 3.93 | -22.80 | 0.6072 | -0.0574 | |||
| WSO / Watsco, Inc. | 0.01 | -7.43 | 3.93 | -11.05 | 0.6067 | 0.0303 | |||
| SRE / Sempra | 0.05 | 3.84 | 0.5936 | 0.5936 | |||||
| AMT / American Tower Corporation | 0.02 | -2.72 | 3.79 | 18.54 | 0.5857 | 0.1683 | |||
| MOD / Modine Manufacturing Company | 0.05 | -7.53 | 3.73 | -25.59 | 0.5767 | -0.0781 | |||
| MLM / Martin Marietta Materials, Inc. | 0.01 | -7.12 | 3.68 | -10.54 | 0.5690 | 0.0315 | |||
| HLN N / Haleon plc | 0.73 | -7.40 | 3.68 | -0.03 | 0.5682 | 0.0880 | |||
| SGI / Somnigroup International Inc. | 0.06 | 41.30 | 3.54 | 36.62 | 0.5476 | 0.2090 | |||
| MAR / Marriott International, Inc. | 0.01 | 2.26 | 3.48 | -16.05 | 0.5381 | -0.0034 | |||
| GILD / Gilead Sciences, Inc. | 0.03 | -7.48 | 3.36 | 1.39 | 0.5187 | 0.0865 | |||
| DOX / Amdocs Limited | 0.04 | 0.00 | 3.31 | 0.46 | 0.5108 | 0.0811 | |||
| BYDDY / BYD Company Limited - Depositary Receipt (Common Stock) | 0.07 | -18.33 | 3.29 | 11.28 | 0.5077 | 0.1222 | |||
| MELI / MercadoLibre, Inc. | 0.00 | 42.03 | 3.26 | 72.21 | 0.5037 | 0.2566 | |||
| DE / Deere & Company | 0.01 | 15.92 | 3.26 | 12.74 | 0.5033 | 0.1262 | |||
| KD / Kyndryl Holdings, Inc. | 0.10 | 3.25 | 0.5024 | 0.5024 | |||||
| ALNY / Alnylam Pharmaceuticals, Inc. | 0.01 | 75.19 | 3.15 | 69.99 | 0.4867 | 0.2448 | |||
| PCG / PG&E Corporation | 0.19 | -7.53 | 3.11 | -2.39 | 0.4803 | 0.0645 | |||
| PWR / Quanta Services, Inc. | 0.01 | 69.83 | 3.09 | 87.39 | 0.4777 | 0.0492 | |||
| PM / Philip Morris International Inc. | 0.02 | 3.04 | 0.4696 | 0.4696 | |||||
| GFL / GFL Environmental Inc. | 0.06 | -7.39 | 2.91 | 7.13 | 0.4500 | 0.0951 | |||
| CNQ / Canadian Natural Resources Limited | 0.10 | -7.55 | 2.88 | -12.61 | 0.4444 | 0.0148 | |||
| PLD / Prologis, Inc. | 0.03 | 391.61 | 2.86 | 302.96 | 0.4421 | -0.2164 | |||
| MRK / Merck & Co., Inc. | 0.03 | 414.43 | 2.74 | 263.26 | 0.4232 | 0.0290 | |||
| ANET / Arista Networks Inc | 0.03 | -7.55 | 2.72 | -34.01 | 0.4195 | -0.1175 | |||
| EIX / Edison International | 0.05 | -56.42 | 2.66 | -56.81 | 0.4113 | -0.3934 | |||
| ABNB / Airbnb, Inc. | 0.02 | -7.49 | 2.58 | -14.01 | 0.3992 | 0.0070 | |||
| HUM / Humana Inc. | 0.01 | 26.44 | 2.40 | 13.08 | 0.3700 | 0.0935 | |||
| IMO / Imperial Oil Limited | 0.03 | -7.30 | 2.34 | -6.02 | 0.3619 | 0.0366 | |||
| IVN / Ivanhoe Mines Ltd. | 0.26 | 16.55 | 2.28 | -3.67 | 0.3527 | 0.0434 | |||
| FQVLF / First Quantum Minerals Ltd. | 0.17 | 0.00 | 2.25 | 7.30 | 0.3473 | 0.0738 | |||
| IR / Ingersoll Rand Inc. | 0.03 | -7.54 | 2.22 | -25.65 | 0.3430 | -0.0468 | |||
| UCBJY / UCB SA - Depositary Receipt (Common Stock) | 0.01 | -4.41 | 2.22 | -10.61 | 0.3424 | 0.0187 | |||
| MRVL / Marvell Technology, Inc. | 0.03 | -18.87 | 2.04 | -58.04 | 0.3145 | -0.3188 | |||
| SUI / Sun Communities, Inc. | 0.02 | 158.61 | 1.93 | 154.34 | 0.2987 | 0.1995 | |||
| NOC / Northrop Grumman Corporation | 0.00 | -7.17 | 1.85 | -7.31 | 0.2861 | 0.0253 | |||
| EL / The Estée Lauder Companies Inc. | 0.03 | 27.12 | 1.82 | -8.62 | 0.2818 | 0.0212 | |||
| CRH / CRH plc | 0.02 | 22.25 | 1.75 | 17.74 | 0.2708 | 0.0766 | |||
| SCI / Service Corporation International | 0.02 | 68.07 | 1.72 | 71.94 | 0.2652 | 0.1348 | |||
| DKS / DICK'S Sporting Goods, Inc. | 0.01 | 20.15 | 1.70 | -6.07 | 0.2630 | 0.0265 | |||
| ORLY / O'Reilly Automotive, Inc. | 0.00 | 34.26 | 1.70 | 46.85 | 0.2630 | 0.1116 | |||
| NSC / Norfolk Southern Corporation | 0.01 | 1.67 | 0.2578 | 0.2578 | |||||
| SHW / The Sherwin-Williams Company | 0.00 | 1.65 | 0.2542 | 0.2542 | |||||
| ABBV / AbbVie Inc. | 0.01 | -66.49 | 1.62 | -64.46 | 0.2501 | -0.3444 | |||
| BESVF / BE Semiconductor Industries N.V. | 0.01 | 1.54 | 0.2383 | 0.2383 | |||||
| IP / International Paper Company | 0.03 | -7.44 | 1.53 | -23.99 | 0.2364 | -0.0264 | |||
| HOOD / Robinhood Markets, Inc. | 0.03 | 1.35 | 0.2086 | 0.2086 | |||||
| KNX / Knight-Swift Transportation Holdings Inc. | 0.03 | -62.96 | 1.28 | -74.59 | 0.1979 | -0.4601 | |||
| SHOP / Shopify Inc. | 0.01 | 1.17 | 0.1807 | 0.1807 | |||||
| NVO / Novo Nordisk A/S - Depositary Receipt (Common Stock) | 0.02 | 81.86 | 1.14 | -8.94 | 0.1764 | -0.1489 | |||
| BATS / British American Tobacco p.l.c. | 0.02 | 1.05 | 0.1625 | 0.1625 | |||||
| LNG / Cheniere Energy, Inc. | 0.00 | -7.34 | 1.00 | -4.21 | 0.1545 | 0.0182 | |||
| US31635A1051 / Fidelity Cash Central Fund | 0.85 | -60.56 | 0.85 | -60.57 | 0.1320 | -0.1508 | |||
| ETN / Eaton Corporation plc | 0.00 | -88.36 | 0.81 | -89.52 | 0.1253 | -0.8834 | |||
| VRT / Vertiv Holdings Co | 0.01 | -76.62 | 0.77 | -82.94 | 0.1183 | -0.4678 | |||
| AIR / Airbus SE | 0.00 | 9,060.42 | 0.73 | 9,050.00 | 0.1132 | 0.1121 | |||
| DKNG / DraftKings Inc. | 0.02 | 0.71 | 0.1096 | 0.1096 | |||||
| COST / Costco Wholesale Corporation | 0.00 | -6.54 | 0.70 | -5.05 | 0.1075 | 0.0117 | |||
| MS / Morgan Stanley | 0.00 | 0.49 | 0.0751 | 0.0751 | |||||
| S and P500 EMINI FUT JUN25 ESM5 / DE (N/A) | 0.03 | 0.0042 | 0.0042 | ||||||
| GEN / Gen Digital Inc. | 0.00 | -100.00 | 0.00 | -100.00 | -0.0012 | ||||
| JBL / Jabil Inc. | 0.00 | -100.00 | 0.00 | -100.00 | -0.2295 | ||||
| CLS / Celestica Inc. | 0.00 | -100.00 | 0.00 | -100.00 | -0.1622 | ||||
| CAP / Capgemini SE | 0.00 | -100.00 | 0.00 | -100.00 | -0.0030 | ||||
| INTU / Intuit Inc. | 0.00 | -100.00 | 0.00 | -100.00 | -0.3878 | ||||
| TMO / Thermo Fisher Scientific Inc. | 0.00 | -100.00 | 0.00 | -100.00 | -1.1255 | ||||
| APP / AppLovin Corporation | 0.00 | -100.00 | 0.00 | -100.00 | -0.1999 |