Statistik Asas
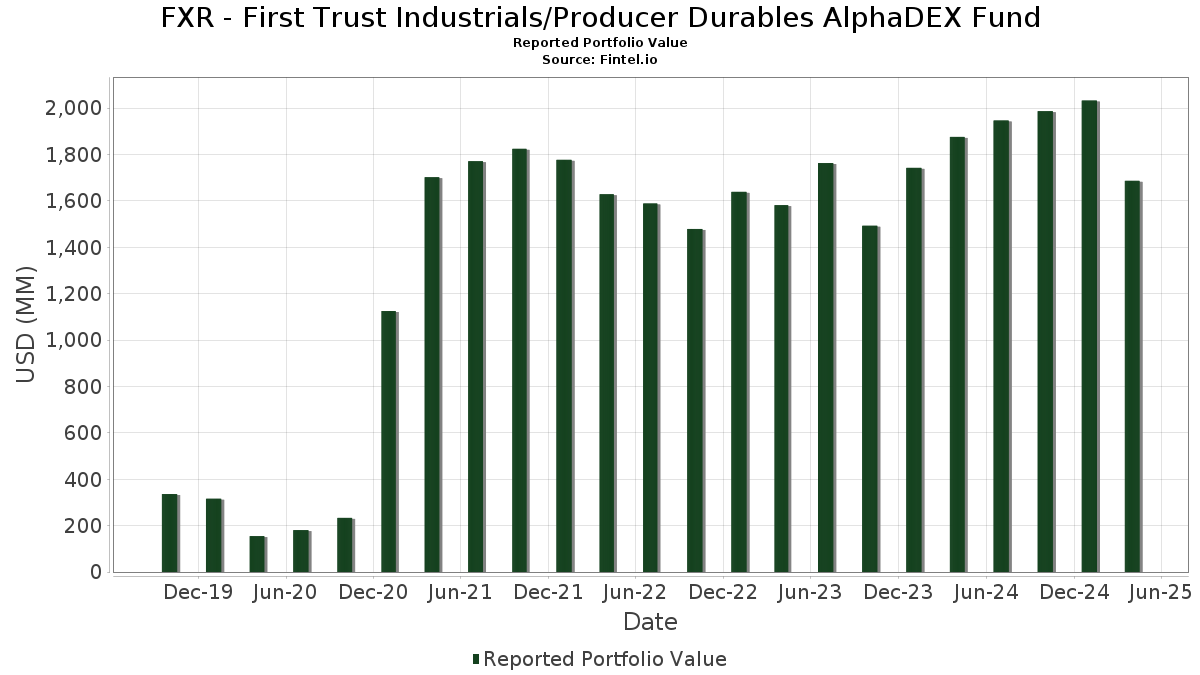
| Nilai Portfolio | $ 1,686,566,872 |
| Kedudukan Semasa | 139 |
Pegangan Terkini, Prestasi, AUM (dari 13F, 13D)
FXR - First Trust Industrials/Producer Durables AlphaDEX Fund telah mendedahkan 139 jumlah pegangan dalam pemfailan SEC terkini mereka. Nilai portfolio terkini dikira sebagai $ 1,686,566,872 USD. Aset Sebenar Di Bawah Pengurusan (AUM) ialah nilai ini ditambah dengan tunai (yang tidak didedahkan). Pegangan teratas FXR - First Trust Industrials/Producer Durables AlphaDEX Fund ialah Huntington Ingalls Industries, Inc. (US:HII) , Martin Marietta Materials, Inc. (US:MLM) , Block, Inc. (US:XYZ) , Howmet Aerospace Inc. (US:HWM) , and WESCO International, Inc. (US:WCC) .
Kenaikan Teratas Suku Tahun Ini
Kami menggunakan perubahan dalam peruntukan portfolio kerana ini adalah metrik yang paling bermakna. Perubahan boleh disebabkan oleh perdagangan atau perubahan dalam harga saham.
| Sekuriti | Saham (MM) |
Nilai (MM$) |
Portfolio % | ΔPortfolio % |
|---|---|---|---|---|
| 0.11 | 21.24 | 1.2696 | 0.9926 | |
| 0.07 | 20.01 | 1.1962 | 0.9642 | |
| 0.08 | 19.93 | 1.1913 | 0.7182 | |
| 0.06 | 21.43 | 1.2806 | 0.5169 | |
| 0.08 | 12.26 | 0.7330 | 0.4940 | |
| 1.34 | 11.75 | 0.7021 | 0.4939 | |
| 0.94 | 20.13 | 1.2031 | 0.4856 | |
| 0.14 | 15.45 | 0.9234 | 0.4407 | |
| 0.12 | 16.16 | 0.9660 | 0.4110 | |
| 6.50 | 0.3885 | 0.3885 |
Penurunan Teratas Suku Tahun Ini
Kami menggunakan perubahan dalam peruntukan portfolio kerana ini adalah metrik yang paling bermakna. Perubahan boleh disebabkan oleh perdagangan atau perubahan dalam harga saham.
| Sekuriti | Saham (MM) |
Nilai (MM$) |
Portfolio % | ΔPortfolio % |
|---|---|---|---|---|
| 0.00 | 0.00 | -1.0755 | ||
| 0.00 | 0.00 | -0.9545 | ||
| 0.09 | 3.54 | 0.2118 | -0.9359 | |
| 0.01 | 4.99 | 0.2983 | -0.9138 | |
| 0.03 | 8.46 | 0.5058 | -0.7531 | |
| 0.00 | 0.00 | -0.7119 | ||
| 0.15 | 12.60 | 0.7529 | -0.6062 | |
| 0.25 | 12.81 | 0.7657 | -0.5685 | |
| 0.01 | 3.87 | 0.2315 | -0.5464 | |
| 0.08 | 11.25 | 0.6725 | -0.5171 |
13F dan Pemfailan Dana
Borang ini telah difailkan pada 2025-06-25 untuk tempoh pelaporan 2025-04-30. Klik ikon pautan untuk melihat sejarah transaksi penuh.
Tingkatkan untuk membuka data premium dan eksport ke Excel ![]() .
.
| Sekuriti | Jenis | Purata Harga Saham | Saham (MM) |
ΔSaham (%) |
ΔSaham (%) |
Nilai ($MM) |
Portfolio (%) |
ΔPortfolio (%) |
|
|---|---|---|---|---|---|---|---|---|---|
| HII / Huntington Ingalls Industries, Inc. | 0.11 | -16.04 | 24.47 | -1.96 | 1.4624 | 0.2339 | |||
| MLM / Martin Marietta Materials, Inc. | 0.04 | -4.24 | 23.23 | -7.79 | 1.3882 | 0.1484 | |||
| XYZ / Block, Inc. | 0.39 | 37.79 | 22.66 | -11.29 | 1.3546 | 0.0970 | |||
| HWM / Howmet Aerospace Inc. | 0.16 | -25.45 | 22.59 | -18.38 | 1.3499 | -0.0121 | |||
| WCC / WESCO International, Inc. | 0.14 | 29.90 | 22.38 | 14.43 | 1.3374 | 0.3749 | |||
| URI / United Rentals, Inc. | 0.03 | 25.15 | 21.46 | 4.25 | 1.2825 | 0.2693 | |||
| V / Visa Inc. | 0.06 | 36.61 | 21.43 | 38.09 | 1.2806 | 0.5169 | |||
| GE / General Electric Company | 0.11 | 281.22 | 21.24 | 277.42 | 1.2696 | 0.9926 | |||
| ADT / ADT Inc. | 2.63 | -23.93 | 21.11 | -20.56 | 1.2617 | -0.0463 | |||
| SYF / Synchrony Financial | 0.40 | 37.04 | 20.95 | 3.21 | 1.2521 | 0.2530 | |||
| GPK / Graphic Packaging Holding Company | 0.82 | -6.95 | 20.73 | -14.14 | 1.2392 | 0.0506 | |||
| AL / Air Lease Corporation | 0.44 | -10.61 | 20.73 | -9.53 | 1.2389 | 0.1111 | |||
| BLDR / Builders FirstSource, Inc. | 0.17 | 2.22 | 20.46 | -26.90 | 1.2226 | -0.1548 | |||
| TRMB / Trimble Inc. | 0.33 | -2.91 | 20.41 | -19.52 | 1.2201 | -0.0284 | |||
| ALSN / Allison Transmission Holdings, Inc. | 0.22 | 24.64 | 20.35 | -2.19 | 1.2163 | 0.1922 | |||
| LPX / Louisiana-Pacific Corporation | 0.24 | 27.52 | 20.33 | -5.91 | 1.2152 | 0.1516 | |||
| R / Ryder System, Inc. | 0.15 | 20.43 | 20.22 | 4.00 | 1.2083 | 0.2515 | |||
| WU / The Western Union Company | 2.04 | -9.74 | 20.18 | -13.33 | 1.2058 | 0.0601 | |||
| SNDR / Schneider National, Inc. | 0.94 | 91.18 | 20.13 | 38.11 | 1.2031 | 0.4856 | |||
| CMI / Cummins Inc. | 0.07 | 414.84 | 20.01 | 324.70 | 1.1962 | 0.9642 | |||
| HEI / HEICO Corporation | 0.08 | 97.60 | 19.93 | 107.39 | 1.1913 | 0.7182 | |||
| MHK / Mohawk Industries, Inc. | 0.19 | -6.95 | 19.86 | -19.09 | 1.1870 | -0.0212 | |||
| PCAR / PACCAR Inc | 0.22 | -4.93 | 19.71 | -22.66 | 1.1782 | -0.0763 | |||
| AXON / Axon Enterprise, Inc. | 0.03 | -21.08 | 19.47 | -25.78 | 1.1638 | -0.1276 | |||
| OSK / Oshkosh Corporation | 0.23 | -9.08 | 19.15 | -34.57 | 1.1447 | -0.2962 | |||
| FDX / FedEx Corporation | 0.09 | 30.55 | 18.67 | 3.67 | 1.1158 | 0.2294 | |||
| WMS / Advanced Drainage Systems, Inc. | 0.16 | -4.71 | 17.89 | -10.56 | 1.0695 | 0.0847 | |||
| FI / Fiserv, Inc. | 0.10 | 3.90 | 17.86 | -11.23 | 1.0672 | 0.0770 | |||
| AWI / Armstrong World Industries, Inc. | 0.12 | -10.37 | 17.59 | -13.93 | 1.0515 | 0.0455 | |||
| GTES / Gates Industrial Corporation plc | 0.93 | 32.68 | 17.51 | 21.33 | 1.0463 | 0.3361 | |||
| VMI / Valmont Industries, Inc. | 0.06 | 27.33 | 17.47 | 12.54 | 1.0439 | 0.2800 | |||
| OC / Owens Corning | 0.12 | -15.04 | 17.34 | -33.06 | 1.0365 | -0.2387 | |||
| EXP / Eagle Materials Inc. | 0.08 | -2.55 | 17.10 | -14.07 | 1.0221 | 0.0425 | |||
| VRSK / Verisk Analytics, Inc. | 0.06 | 20.07 | 17.06 | 35.98 | 1.0195 | 0.3748 | |||
| MSM / MSC Industrial Direct Co., Inc. | 0.22 | -31.02 | 16.89 | -34.40 | 1.0093 | -0.2577 | |||
| ADP / Automatic Data Processing, Inc. | 0.06 | 14.38 | 16.85 | 13.47 | 1.0071 | 0.2761 | |||
| TXT / Textron Inc. | 0.24 | -4.78 | 16.76 | -12.42 | 1.0015 | 0.0597 | |||
| BLD / TopBuild Corp. | 0.06 | -8.37 | 16.65 | -20.92 | 0.9951 | -0.0412 | |||
| GPN / Global Payments Inc. | 0.22 | 2.26 | 16.65 | -30.85 | 0.9951 | -0.1901 | |||
| DOV / Dover Corporation | 0.10 | 27.33 | 16.62 | 6.68 | 0.9931 | 0.2265 | |||
| VNT / Vontier Corporation | 0.52 | -0.45 | 16.61 | -17.86 | 0.9926 | -0.0026 | |||
| KEX / Kirby Corporation | 0.17 | -6.46 | 16.30 | -17.42 | 0.9740 | 0.0027 | |||
| MMM / 3M Company | 0.12 | 57.05 | 16.16 | 43.34 | 0.9660 | 0.4110 | |||
| CNH / CNH Industrial N.V. | 1.38 | -34.65 | 15.96 | -41.30 | 0.9536 | -0.3843 | |||
| SNA / Snap-on Incorporated | 0.05 | -10.19 | 15.88 | -20.65 | 0.9490 | -0.0359 | |||
| AYI / Acuity Inc. | 0.07 | 32.71 | 15.88 | -2.74 | 0.9489 | 0.1454 | |||
| GXO / GXO Logistics, Inc. | 0.44 | 32.27 | 15.81 | 5.47 | 0.9449 | 0.2071 | |||
| CXT / Crane NXT, Co. | 0.33 | 1.49 | 15.65 | -25.56 | 0.9351 | -0.0994 | |||
| EXPD / Expeditors International of Washington, Inc. | 0.14 | 62.81 | 15.45 | 57.55 | 0.9234 | 0.4407 | |||
| KNX / Knight-Swift Transportation Holdings Inc. | 0.39 | 45.17 | 15.38 | -0.40 | 0.9192 | 0.1592 | |||
| DOW / Dow Inc. | 0.50 | 4.16 | 15.19 | -18.41 | 0.9077 | -0.0085 | |||
| FBHS / Fortune Brands Home & Security Inc | 0.28 | 34.34 | 15.18 | 0.88 | 0.9073 | 0.1666 | |||
| ST / Sensata Technologies Holding plc | 0.71 | 54.03 | 15.18 | -8.86 | 0.9070 | -0.0491 | |||
| BC / Brunswick Corporation | 0.32 | -13.81 | 14.67 | -41.15 | 0.8769 | -0.3502 | |||
| EME / EMCOR Group, Inc. | 0.03 | -34.84 | 13.75 | -41.73 | 0.8219 | -0.3398 | |||
| CNM / Core & Main, Inc. | 0.26 | -30.54 | 13.75 | -35.17 | 0.8217 | -0.2221 | |||
| ITT / ITT Inc. | 0.10 | 46.80 | 13.46 | 33.19 | 0.8047 | 0.3071 | |||
| AOS / A. O. Smith Corporation | 0.20 | -29.95 | 13.33 | -29.37 | 0.7968 | -0.1322 | |||
| CTAS / Cintas Corporation | 0.06 | -32.68 | 13.12 | -30.76 | 0.7843 | -0.1698 | |||
| FCN / FTI Consulting, Inc. | 0.08 | 4.62 | 13.06 | -10.95 | 0.7804 | 0.0587 | |||
| PCTY / Paylocity Holding Corporation | 0.07 | -29.21 | 13.04 | -33.83 | 0.7794 | -0.1906 | |||
| TDG / TransDigm Group Incorporated | 0.01 | -34.27 | 13.03 | -28.67 | 0.7786 | -0.1410 | |||
| SLGN / Silgan Holdings Inc. | 0.25 | -8.85 | 12.97 | -14.44 | 0.7755 | 0.0291 | |||
| MA / Mastercard Incorporated | 0.02 | -13.75 | 12.88 | -14.90 | 0.7697 | 0.0249 | |||
| G / Genpact Limited | 0.25 | -54.21 | 12.81 | -52.74 | 0.7657 | -0.5685 | |||
| SSD / Simpson Manufacturing Co., Inc. | 0.08 | -5.05 | 12.62 | -13.14 | 0.7545 | 0.0392 | |||
| FOUR / Shift4 Payments, Inc. | 0.15 | -33.15 | 12.60 | -54.38 | 0.7529 | -0.6062 | |||
| DCI / Donaldson Company, Inc. | 0.19 | -10.30 | 12.56 | -17.18 | 0.7506 | 0.0042 | |||
| PAYX / Paychex, Inc. | 0.08 | 153.48 | 12.26 | 152.55 | 0.7330 | 0.4940 | |||
| CSX / CSX Corporation | 0.44 | -1.87 | 12.25 | -16.20 | 0.7319 | 0.0126 | |||
| TTC / The Toro Company | 0.18 | -0.85 | 12.12 | -18.70 | 0.7247 | -0.0094 | |||
| CAT / Caterpillar Inc. | 0.04 | 47.86 | 12.06 | 23.11 | 0.7206 | 0.2386 | |||
| PKG / Packaging Corporation of America | 0.06 | 51.73 | 11.96 | 32.44 | 0.7151 | 0.2704 | |||
| CPAY / Corpay, Inc. | 0.04 | -13.64 | 11.91 | -26.15 | 0.7119 | -0.0820 | |||
| US7587501039 / Regal-Beloit Corp. | 0.11 | 82.22 | 11.89 | 21.50 | 0.7106 | 0.2290 | |||
| VSTS / Vestis Corporation | 1.34 | 343.20 | 11.75 | 177.75 | 0.7021 | 0.4939 | |||
| MIDD / The Middleby Corporation | 0.08 | -40.25 | 11.25 | -53.44 | 0.6725 | -0.5171 | |||
| UPS / United Parcel Service, Inc. | 0.12 | 3.67 | 11.24 | -13.51 | 0.6718 | 0.0321 | |||
| JBHT / J.B. Hunt Transport Services, Inc. | 0.09 | 2.39 | 11.24 | -21.91 | 0.6717 | -0.0367 | |||
| CSL / Carlisle Companies Incorporated | 0.03 | -35.62 | 9.50 | -37.27 | 0.5679 | -0.1777 | |||
| MAN / ManpowerGroup Inc. | 0.22 | 246.08 | 9.46 | 97.56 | 0.5656 | 0.3102 | |||
| HUBB / Hubbell Incorporated | 0.03 | 119.06 | 9.37 | 101.09 | 0.5603 | 0.3207 | |||
| MSA / MSA Safety Incorporated | 0.06 | 1.24 | 9.19 | -3.25 | 0.5496 | 0.0818 | |||
| FICO / Fair Isaac Corporation | 0.00 | -52.11 | 9.15 | -49.15 | 0.5470 | -0.3388 | |||
| ALLE / Allegion plc | 0.07 | -10.38 | 9.13 | -6.01 | 0.5456 | 0.0675 | |||
| FERG / Ferguson Enterprises Inc. | 0.05 | -3.01 | 9.07 | -9.15 | 0.5419 | 0.0507 | |||
| LHX / L3Harris Technologies, Inc. | 0.04 | 86.77 | 9.01 | 93.83 | 0.5386 | 0.3097 | |||
| ATI / ATI Inc. | 0.16 | -6.00 | 8.88 | -10.45 | 0.5309 | 0.0426 | |||
| SAIA / Saia, Inc. | 0.04 | 73.10 | 8.86 | -12.03 | 0.5298 | 0.0338 | |||
| PNR / Pentair plc | 0.10 | 112.98 | 8.85 | 86.38 | 0.5292 | 0.2953 | |||
| AZEK / The AZEK Company Inc. | 0.18 | -11.99 | 8.79 | -14.86 | 0.5252 | 0.0172 | |||
| COF / Capital One Financial Corporation | 0.05 | -10.12 | 8.69 | -20.47 | 0.5194 | -0.0184 | |||
| ATR / AptarGroup, Inc. | 0.06 | -5.35 | 8.64 | -9.68 | 0.5164 | 0.0455 | |||
| PPG / PPG Industries, Inc. | 0.08 | -34.34 | 8.58 | -38.05 | 0.5131 | -0.1690 | |||
| PYPL / PayPal Holdings, Inc. | 0.13 | 140.57 | 8.56 | 78.83 | 0.5115 | 0.2759 | |||
| GD / General Dynamics Corporation | 0.03 | -13.65 | 8.53 | -8.57 | 0.5097 | 0.0506 | |||
| AXP / American Express Company | 0.03 | -60.57 | 8.46 | -66.91 | 0.5058 | -0.7531 | |||
| HAYW / Hayward Holdings, Inc. | 0.63 | 79.53 | 8.38 | 61.81 | 0.5007 | 0.2346 | |||
| AXTA / Axalta Coating Systems Ltd. | 0.26 | 91.01 | 8.36 | 72.74 | 0.4999 | 0.2616 | |||
| NOC / Northrop Grumman Corporation | 0.02 | -41.82 | 8.14 | -36.65 | 0.4868 | -0.2513 | |||
| NSC / Norfolk Southern Corporation | 0.04 | -10.89 | 8.14 | -21.79 | 0.4863 | -0.0258 | |||
| AMCR / Amcor plc | 0.88 | -42.55 | 8.06 | -45.63 | 0.4816 | -0.2478 | |||
| EEFT / Euronet Worldwide, Inc. | 0.08 | -57.59 | 7.82 | -57.33 | 0.4672 | -0.4345 | |||
| GNRC / Generac Holdings Inc. | 0.07 | 10.26 | 7.78 | -15.55 | 0.4649 | 0.0115 | |||
| DD / DuPont de Nemours, Inc. | 0.11 | 89.74 | 7.57 | 63.03 | 0.4525 | 0.2239 | |||
| MKSI / MKS Inc. | 0.11 | 8.19 | 7.51 | -39.73 | 0.4487 | -0.1914 | |||
| RHI / Robert Half Inc. | 0.16 | 143.11 | 7.05 | 66.24 | 0.4212 | 0.2125 | |||
| SWK / Stanley Black & Decker, Inc. | 0.11 | 122.68 | 6.77 | 54.79 | 0.4048 | 0.1281 | |||
| DE000C4SA6R6 / EURO STOXX 50 Index | 6.50 | 0.3885 | 0.3885 | ||||||
| RBC DOMINION SECURITIES INC / RA (000000000) | 6.24 | 0.3732 | 0.3732 | ||||||
| FIX / Comfort Systems USA, Inc. | 0.01 | -77.73 | 4.99 | -79.73 | 0.2983 | -0.9138 | |||
| TT / Trane Technologies plc | 0.01 | -68.78 | 4.65 | -67.01 | 0.2778 | -0.4157 | |||
| VMC / Vulcan Materials Company | 0.02 | -7.75 | 4.58 | -11.65 | 0.2737 | 0.0127 | |||
| WAB / Westinghouse Air Brake Technologies Corporation | 0.02 | -7.25 | 4.17 | -17.58 | 0.2491 | 0.0002 | |||
| XYL / Xylem Inc. | 0.03 | -13.06 | 4.17 | -15.50 | 0.2490 | 0.0063 | |||
| ESAB / ESAB Corporation | 0.03 | -10.88 | 4.12 | -13.57 | 0.2460 | 0.0116 | |||
| PH / Parker-Hannifin Corporation | 0.01 | -9.49 | 4.11 | -13.62 | 0.2456 | 0.0061 | |||
| AME / AMETEK, Inc. | 0.02 | -5.81 | 4.09 | -13.47 | 0.2442 | 0.0118 | |||
| HON / Honeywell International Inc. | 0.02 | -4.93 | 4.09 | -10.55 | 0.2442 | 0.0194 | |||
| LII / Lennox International Inc. | 0.01 | -53.29 | 4.01 | -56.90 | 0.2396 | -0.2181 | |||
| GGG / Graco Inc. | 0.05 | -10.26 | 4.01 | -12.99 | 0.2395 | 0.0128 | |||
| ITW / Illinois Tool Works Inc. | 0.02 | -8.43 | 3.99 | -15.24 | 0.2388 | 0.0068 | |||
| IEX / IDEX Corporation | 0.02 | -48.25 | 3.98 | -58.06 | 0.2378 | -0.2398 | |||
| EMR / Emerson Electric Co. | 0.04 | -13.11 | 3.96 | -15.65 | 0.2366 | 0.0003 | |||
| ACN / Accenture plc | 0.01 | 3.95 | 0.2361 | 0.2361 | |||||
| SEE / Sealed Air Corporation | 0.14 | -66.37 | 3.93 | -73.40 | 0.2349 | -0.4921 | |||
| FTV / Fortive Corporation | 0.06 | -55.81 | 3.93 | -62.13 | 0.2347 | -0.2758 | |||
| NDSN / Nordson Corporation | 0.02 | -54.91 | 3.91 | -61.19 | 0.2335 | -0.2620 | |||
| JKHY / Jack Henry & Associates, Inc. | 0.02 | -14.41 | 3.90 | -14.74 | 0.2334 | 0.0080 | |||
| TDY / Teledyne Technologies Incorporated | 0.01 | -73.11 | 3.87 | -75.50 | 0.2315 | -0.5464 | |||
| FLS / Flowserve Corporation | 0.08 | -8.16 | 3.81 | -21.09 | 0.2276 | -0.0154 | |||
| LECO / Lincoln Electric Holdings, Inc. | 0.02 | -57.75 | 3.80 | -62.55 | 0.2270 | -0.2722 | |||
| RPM / RPM International Inc. | 0.04 | -5.08 | 3.80 | -19.97 | 0.2269 | -0.0066 | |||
| UNP / Union Pacific Corporation | 0.02 | -13.62 | 3.77 | -24.83 | 0.2251 | -0.0215 | |||
| LSTR / Landstar System, Inc. | 0.03 | 2.87 | 3.70 | -16.19 | 0.2213 | 0.0038 | |||
| MAS / Masco Corporation | 0.06 | -6.66 | 3.59 | -28.65 | 0.2148 | -0.0331 | |||
| SON / Sonoco Products Company | 0.09 | -82.34 | 3.54 | -84.80 | 0.2118 | -0.9359 | |||
| WEX / WEX Inc. | 0.03 | -2.13 | 3.36 | -30.62 | 0.2006 | -0.0375 | |||
| US61747C5821 / Morgan Stanley Institutional Liquidity Funds - Treasury Portfolio | 1.50 | 8.88 | 1.50 | 8.86 | 0.0897 | 0.0218 | |||
| BWXT / BWX Technologies, Inc. | 0.00 | -100.00 | 0.00 | -100.00 | -0.9545 | ||||
| AGCO / AGCO Corporation | 0.00 | -100.00 | 0.00 | -100.00 | -0.2536 | ||||
| GWW / W.W. Grainger, Inc. | 0.00 | -100.00 | 0.00 | -100.00 | -0.7119 | ||||
| BALL / Ball Corporation | 0.00 | -100.00 | 0.00 | -100.00 | -0.4756 | ||||
| BILL / BILL Holdings, Inc. | 0.00 | -100.00 | 0.00 | -100.00 | -1.0755 |