Statistik Asas
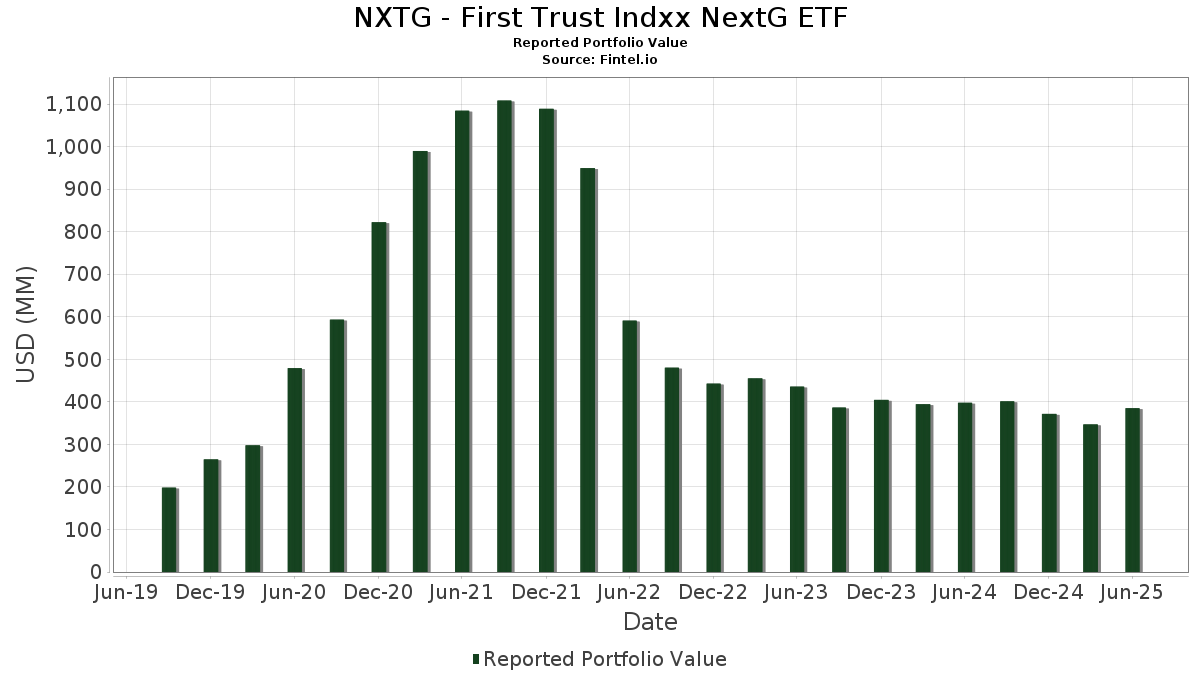
| Nilai Portfolio | $ 385,066,833 |
| Kedudukan Semasa | 101 |
Pegangan Terkini, Prestasi, AUM (dari 13F, 13D)
NXTG - First Trust Indxx NextG ETF telah mendedahkan 101 jumlah pegangan dalam pemfailan SEC terkini mereka. Nilai portfolio terkini dikira sebagai $ 385,066,833 USD. Aset Sebenar Di Bawah Pengurusan (AUM) ialah nilai ini ditambah dengan tunai (yang tidak didedahkan). Pegangan teratas NXTG - First Trust Indxx NextG ETF ialah Samsung SDS Co., Ltd. (KR:018260) , Advanced Micro Devices, Inc. (US:AMD) , Marvell Technology, Inc. (US:MRVL) , Super Micro Computer, Inc. (US:SMCI) , and Ciena Corporation (US:CIEN) . Kedudukan baharu NXTG - First Trust Indxx NextG ETF termasuk Super Micro Computer, Inc. (US:SMCI) , .
Kenaikan Teratas Suku Tahun Ini
Kami menggunakan perubahan dalam peruntukan portfolio kerana ini adalah metrik yang paling bermakna. Perubahan boleh disebabkan oleh perdagangan atau perubahan dalam harga saham.
| Sekuriti | Saham (MM) |
Nilai (MM$) |
Portfolio % | ΔPortfolio % |
|---|---|---|---|---|
| 0.11 | 5.26 | 1.3683 | 1.3683 | |
| 0.07 | 5.26 | 1.3684 | 0.6343 | |
| 0.05 | 5.81 | 1.5120 | 0.4483 | |
| 0.25 | 5.20 | 1.3541 | 0.4355 | |
| 0.06 | 5.22 | 1.3586 | 0.4295 | |
| 1.59 | 0.4135 | 0.4135 | ||
| 0.04 | 5.43 | 1.4132 | 0.3908 | |
| 0.05 | 4.76 | 1.2377 | 0.3696 | |
| 0.05 | 5.03 | 1.3101 | 0.3680 | |
| 0.03 | 5.13 | 1.3345 | 0.3089 |
Penurunan Teratas Suku Tahun Ini
Kami menggunakan perubahan dalam peruntukan portfolio kerana ini adalah metrik yang paling bermakna. Perubahan boleh disebabkan oleh perdagangan atau perubahan dalam harga saham.
| Sekuriti | Saham (MM) |
Nilai (MM$) |
Portfolio % | ΔPortfolio % |
|---|---|---|---|---|
| 0.67 | 5.14 | 1.3368 | -0.6865 | |
| 1.50 | 4.65 | 1.2113 | -0.3990 | |
| 0.88 | 4.55 | 1.1836 | -0.3625 | |
| 0.17 | 5.07 | 1.3183 | -0.2891 | |
| 0.18 | 4.64 | 1.2079 | -0.2401 | |
| 2.93 | 4.44 | 1.1556 | -0.2348 | |
| 3.89 | 4.67 | 1.2153 | -0.2318 | |
| 0.34 | 4.21 | 1.0966 | -0.2069 | |
| 0.39 | 4.70 | 1.2237 | -0.2053 | |
| 0.55 | 1.99 | 0.5179 | -0.2008 |
13F dan Pemfailan Dana
Borang ini telah difailkan pada 2025-08-25 untuk tempoh pelaporan 2025-06-30. Klik ikon pautan untuk melihat sejarah transaksi penuh.
Tingkatkan untuk membuka data premium dan eksport ke Excel ![]() .
.
| Sekuriti | Jenis | Purata Harga Saham | Saham (MM) |
ΔSaham (%) |
ΔSaham (%) |
Nilai ($MM) |
Portfolio (%) |
ΔPortfolio (%) |
|
|---|---|---|---|---|---|---|---|---|---|
| 018260 / Samsung SDS Co., Ltd. | 0.05 | 1.22 | 5.81 | 60.65 | 1.5120 | 0.4483 | |||
| AMD / Advanced Micro Devices, Inc. | 0.04 | 13.09 | 5.43 | 56.19 | 1.4132 | 0.3908 | |||
| MRVL / Marvell Technology, Inc. | 0.07 | 67.57 | 5.26 | 110.70 | 1.3684 | 0.6343 | |||
| SMCI / Super Micro Computer, Inc. | 0.11 | 5.26 | 1.3683 | 1.3683 | |||||
| CIEN / Ciena Corporation | 0.06 | 22.77 | 5.22 | 65.24 | 1.3586 | 0.4295 | |||
| HPE / Hewlett Packard Enterprise Company | 0.25 | 25.68 | 5.20 | 66.57 | 1.3541 | 0.4355 | |||
| JNPR / Juniper Networks, Inc. | 0.13 | 8.99 | 5.16 | 20.25 | 1.3418 | 0.0809 | |||
| 3CP / Xiaomi Corporation | 0.67 | -38.14 | 5.14 | -25.34 | 1.3368 | -0.6865 | |||
| NVDA / NVIDIA Corporation | 0.03 | 0.86 | 5.13 | 47.03 | 1.3345 | 0.3089 | |||
| 6701 / NEC Corporation | 0.17 | -32.62 | 5.07 | -7.32 | 1.3183 | -0.2891 | |||
| AVGO / Broadcom Inc. | 0.02 | -25.07 | 5.05 | 23.37 | 1.3149 | 0.1105 | |||
| BT.A / BT Group plc | 1.89 | -17.78 | 5.04 | 1.94 | 1.3108 | -0.1421 | |||
| ANET / Arista Networks Inc | 0.05 | 19.01 | 5.03 | 57.13 | 1.3101 | 0.3680 | |||
| INTC / Intel Corporation | 0.22 | 5.40 | 5.02 | 3.98 | 1.3068 | -0.1136 | |||
| CSCO / Cisco Systems, Inc. | 0.07 | -3.83 | 5.01 | 8.14 | 1.3040 | -0.0588 | |||
| 6503 / Mitsubishi Electric Corporation | 0.23 | -7.97 | 4.96 | 7.80 | 1.2913 | -0.0623 | |||
| MU / Micron Technology, Inc. | 0.04 | -11.19 | 4.92 | 25.97 | 1.2815 | 0.1320 | |||
| TSM / Taiwan Semiconductor Manufacturing Company Limited - Depositary Receipt (Common Stock) | 0.02 | -6.19 | 4.90 | 27.98 | 1.2762 | 0.1495 | |||
| PRY / Tion Renewables AG | 0.07 | 1.32 | 4.89 | 30.18 | 1.2733 | 0.1680 | |||
| ELISA / Elisa Oyj | 0.09 | -12.99 | 4.88 | -1.03 | 1.2694 | -0.1801 | |||
| 2308 / Delta Electronics, Inc. | 0.34 | 0.09 | 4.88 | 27.95 | 1.2691 | 0.1482 | |||
| IBM / International Business Machines Corporation | 0.02 | -13.45 | 4.85 | 2.60 | 1.2633 | -0.1280 | |||
| SBAC / SBA Communications Corporation | 0.02 | 0.85 | 4.84 | 7.65 | 1.2606 | -0.0627 | |||
| 3711 / ASE Technology Holding Co., Ltd. | 0.95 | 4.12 | 4.81 | 19.62 | 1.2523 | 0.0693 | |||
| INW / Infrastrutture Wireless Italiane S.p.A. | 0.39 | -7.35 | 4.81 | 6.98 | 1.2521 | -0.0704 | |||
| CCI / Crown Castle Inc. | 0.05 | 4.20 | 4.79 | 2.70 | 1.2464 | -0.1250 | |||
| AAPL / Apple Inc. | 0.02 | 30.86 | 4.78 | 20.87 | 1.2452 | 0.0811 | |||
| AMT / American Tower Corporation | 0.02 | -3.19 | 4.78 | -1.67 | 1.2439 | -0.1855 | |||
| MSI / Motorola Solutions, Inc. | 0.01 | 20.54 | 4.76 | 15.77 | 1.2400 | 0.0296 | |||
| QRVO / Qorvo, Inc. | 0.06 | -11.60 | 4.76 | 3.68 | 1.2397 | -0.1116 | |||
| TECHM / Tech Mahindra Limited | 0.24 | 15.48 | 4.76 | 37.73 | 1.2389 | 0.2224 | |||
| 6669 / Wiwynn Corporation | 0.05 | -5.80 | 4.76 | 61.13 | 1.2377 | 0.3696 | |||
| ADI / Analog Devices, Inc. | 0.02 | -1.78 | 4.74 | 15.93 | 1.2348 | 0.0312 | |||
| SWKS / Skyworks Solutions, Inc. | 0.06 | 29.12 | 4.74 | 48.87 | 1.2346 | 0.2975 | |||
| SOBKY / SoftBank Corp. - Depositary Receipt (Common Stock) | 3.06 | -8.45 | 4.74 | 1.63 | 1.2330 | -0.1379 | |||
| IFNNY / Infineon Technologies AG - Depositary Receipt (Common Stock) | 0.11 | -12.87 | 4.71 | 11.21 | 1.2268 | -0.0199 | |||
| 005930 / Samsung Electronics Co., Ltd. | 0.11 | -6.02 | 4.71 | 5.04 | 1.2264 | -0.0930 | |||
| 6702 / Fujitsu Limited | 0.19 | -17.95 | 4.71 | 0.62 | 1.2255 | -0.1505 | |||
| KYR / Kyocera Corporation | 0.39 | -9.21 | 4.70 | -3.23 | 1.2237 | -0.2053 | |||
| MCHP / Microchip Technology Incorporated | 0.07 | -7.31 | 4.69 | 34.73 | 1.2198 | 0.1967 | |||
| KEYS / Keysight Technologies, Inc. | 0.03 | 8.67 | 4.67 | 18.90 | 1.2165 | 0.0603 | |||
| 066570 / LG Electronics Inc. | 0.09 | 18.53 | 4.67 | 22.87 | 1.2153 | 0.0977 | |||
| LHL / Lenovo Group Limited | 3.89 | 7.47 | 4.67 | -5.10 | 1.2153 | -0.2318 | |||
| WIT / Wipro Limited - Depositary Receipt (Common Stock) | 1.55 | 27.27 | 4.67 | 25.63 | 1.2145 | 0.1219 | |||
| STMPA / STMicroelectronics N.V. | 0.15 | -9.45 | 4.66 | 26.26 | 1.2126 | 0.1274 | |||
| NXPI / NXP Semiconductors N.V. | 0.02 | 5.06 | 4.66 | 20.77 | 1.2124 | 0.0781 | |||
| FFIV / F5, Inc. | 0.02 | -6.32 | 4.66 | 3.56 | 1.2123 | -0.1107 | |||
| 763 / ZTE Corporation | 1.50 | -15.28 | 4.65 | -15.00 | 1.2113 | -0.3990 | |||
| ERCB / Telefonaktiebolaget LM Ericsson (publ) | 0.54 | 1.65 | 4.65 | 11.76 | 1.2099 | -0.0134 | |||
| 6758 / Sony Group Corporation | 0.18 | -7.91 | 4.64 | -5.73 | 1.2079 | -0.2401 | |||
| HCLTECH / HCL Technologies Limited | 0.23 | 18.84 | 4.64 | 29.31 | 1.2079 | 0.1523 | |||
| QCOM / QUALCOMM Incorporated | 0.03 | 4.08 | 4.63 | 7.93 | 1.2047 | -0.0569 | |||
| INFY / Infosys Limited - Depositary Receipt (Common Stock) | 0.25 | 31.05 | 4.62 | 33.07 | 1.2012 | 0.1811 | |||
| TCS / Tata Consultancy Services Limited | 0.11 | 35.68 | 4.61 | 30.21 | 1.1995 | 0.1585 | |||
| DLR / Digital Realty Trust, Inc. | 0.03 | 11.63 | 4.60 | 35.83 | 1.1961 | 0.2009 | |||
| 2395 / Advantech Co., Ltd. | 0.39 | -3.37 | 4.59 | -1.57 | 1.1949 | -0.1769 | |||
| NTTYY / NTT, Inc. - Depositary Receipt (Common Stock) | 4.29 | -0.53 | 4.59 | 10.05 | 1.1945 | -0.0318 | |||
| NOK / Nokia Oyj - Depositary Receipt (Common Stock) | 0.88 | -11.99 | 4.55 | -13.49 | 1.1836 | -0.3625 | |||
| AOS / Amdocs Limited | 0.05 | -0.77 | 4.52 | -1.05 | 1.1773 | -0.1672 | |||
| 2454 / MediaTek Inc. | 0.11 | 1.26 | 4.51 | 0.53 | 1.1742 | -0.1456 | |||
| 2303 / United Microelectronics Corporation | 2.93 | -13.21 | 4.44 | -6.07 | 1.1556 | -0.2348 | |||
| 788 / China Tower Corp Ltd | 3.08 | -3.08 | 4.41 | 2.85 | 1.1470 | -0.1133 | |||
| NEN / Renesas Electronics Corporation | 0.34 | 2.63 | 4.21 | -4.94 | 1.0966 | -0.2069 | |||
| EQIX / Equinix, Inc. | 0.01 | 14.53 | 4.13 | 11.76 | 1.0739 | -0.0121 | |||
| KT / KT Corporation - Depositary Receipt (Common Stock) | 0.11 | -9.83 | 2.28 | 5.80 | 0.5935 | -0.0404 | |||
| TIT / Telecom Italia S.p.A. | 4.62 | -34.86 | 2.28 | -4.92 | 0.5930 | -0.1117 | |||
| RCI / Rogers Communications Inc. | 0.08 | 36.80 | 2.26 | 51.99 | 0.5876 | 0.1506 | |||
| VOD / Vodafone Group Public Limited Company | 2.10 | -2.17 | 2.25 | 11.19 | 0.5844 | -0.0097 | |||
| BHARTIARTL / Bharti Airtel Limited | 0.09 | -4.37 | 2.22 | 10.83 | 0.5779 | -0.0112 | |||
| SKMTF / SK Telecom Co., Ltd. | 0.05 | 10.63 | 2.22 | 23.40 | 0.5765 | 0.0486 | |||
| LL6 / MTN Group Limited | 0.28 | -28.81 | 2.21 | -15.80 | 0.5742 | -0.1965 | |||
| VIV / Telefônica Brasil S.A. - Depositary Receipt (Common Stock) | 0.19 | -15.24 | 2.20 | 10.81 | 0.5734 | -0.0113 | |||
| 6947 / DiGi.Com Bhd | 2.33 | -0.41 | 2.17 | 18.36 | 0.5657 | 0.0256 | |||
| ORA / Orange S.A. | 0.14 | -24.03 | 2.17 | -10.81 | 0.5649 | -0.1506 | |||
| AMXB / America Movil S.A.B.DE C.V. - Class B | 2.42 | -2.58 | 2.16 | 22.30 | 0.5626 | 0.0427 | |||
| 4904 / Far EasTone Telecommunications Co., Ltd. | 0.70 | 3.04 | 2.15 | 13.44 | 0.5603 | 0.0022 | |||
| 2412 / Chunghwa Telecom Co., Ltd. | 0.46 | -6.45 | 2.14 | 11.28 | 0.5573 | -0.0086 | |||
| SCMN / Swisscom AG | 0.00 | -9.20 | 2.13 | 11.73 | 0.5555 | -0.0064 | |||
| ORDS / Ooredoo Q.P.S.C. | 0.61 | 5.29 | 2.13 | 14.00 | 0.5553 | 0.0050 | |||
| KPN / Koninklijke KPN N.V. | 0.44 | -13.32 | 2.13 | -0.33 | 0.5535 | -0.0738 | |||
| TMUS / T-Mobile US, Inc. | 0.01 | 10.64 | 2.13 | -1.16 | 0.5532 | -0.0793 | |||
| DIP / KDDI Corporation | 0.12 | 7.80 | 2.12 | 17.54 | 0.5513 | 0.0213 | |||
| TEQ / Telenor ASA | 0.14 | -18.31 | 2.11 | -11.09 | 0.5487 | -0.1489 | |||
| T / AT&T Inc. | 0.07 | -9.72 | 2.10 | -7.64 | 0.5475 | -0.1222 | |||
| 3045 / Taiwan Mobile Co., Ltd. | 0.53 | -0.99 | 2.09 | 10.75 | 0.5443 | -0.0110 | |||
| 5VD / Vodacom Group Limited | 0.27 | -14.27 | 2.08 | -3.65 | 0.5424 | -0.0937 | |||
| TLS / Telstra Group Limited | 0.65 | -10.93 | 2.08 | 7.40 | 0.5402 | -0.0282 | |||
| CLNX / Cellnex Telecom, S.A. | 0.05 | -1.91 | 2.07 | 7.13 | 0.5396 | -0.0297 | |||
| TU / TELUS Corporation | 0.13 | 0.68 | 2.06 | 12.77 | 0.5355 | -0.0013 | |||
| TLKM / Perusahaan Perseroan (Persero) PT Telekomunikasi Indonesia Tbk | 12.00 | 12.92 | 2.05 | 33.14 | 0.5346 | 0.0809 | |||
| ETISALA / Emirates Telecommunications Group Co PJSC | 0.43 | 1.72 | 2.05 | 5.95 | 0.5332 | -0.0355 | |||
| TEF / Telefónica, S.A. | 0.39 | -7.06 | 2.04 | 3.55 | 0.5320 | -0.0485 | |||
| NCYD / Tele2 AB (publ) | 0.14 | -24.07 | 2.04 | -17.62 | 0.5318 | -0.1979 | |||
| VZ / Verizon Communications Inc. | 0.05 | 5.37 | 2.04 | 0.54 | 0.5304 | -0.0659 | |||
| BCE / BCE Inc. | 0.09 | 26.33 | 2.03 | 22.09 | 0.5296 | 0.0393 | |||
| DTE / Deutsche Telekom AG | 0.06 | -7.34 | 2.03 | -8.45 | 0.5277 | -0.1236 | |||
| SIT4 / Singapore Telecommunications Limited | 0.67 | -18.27 | 2.02 | -3.21 | 0.5253 | -0.0879 | |||
| TELIA / Telia Company AB (publ) | 0.55 | -18.23 | 1.99 | -18.58 | 0.5179 | -0.2008 | |||
| ADVANC / Advanced Info Service Public Company Limited | 0.23 | 3.93 | 1.97 | 9.27 | 0.5126 | -0.0174 | |||
| GLO / Globe Telecom, Inc. | 0.06 | 21.48 | 1.91 | -7.60 | 0.4972 | -0.1109 | |||
| BOFA SECURITIES INC / RA (000000000) | 1.59 | 0.4135 | 0.4135 | ||||||
| MBT / Mobile Telesystems PJSC - ADR | 0.76 | 0.00 | 0.00 | 0.0000 | -0.0000 |