Statistik Asas
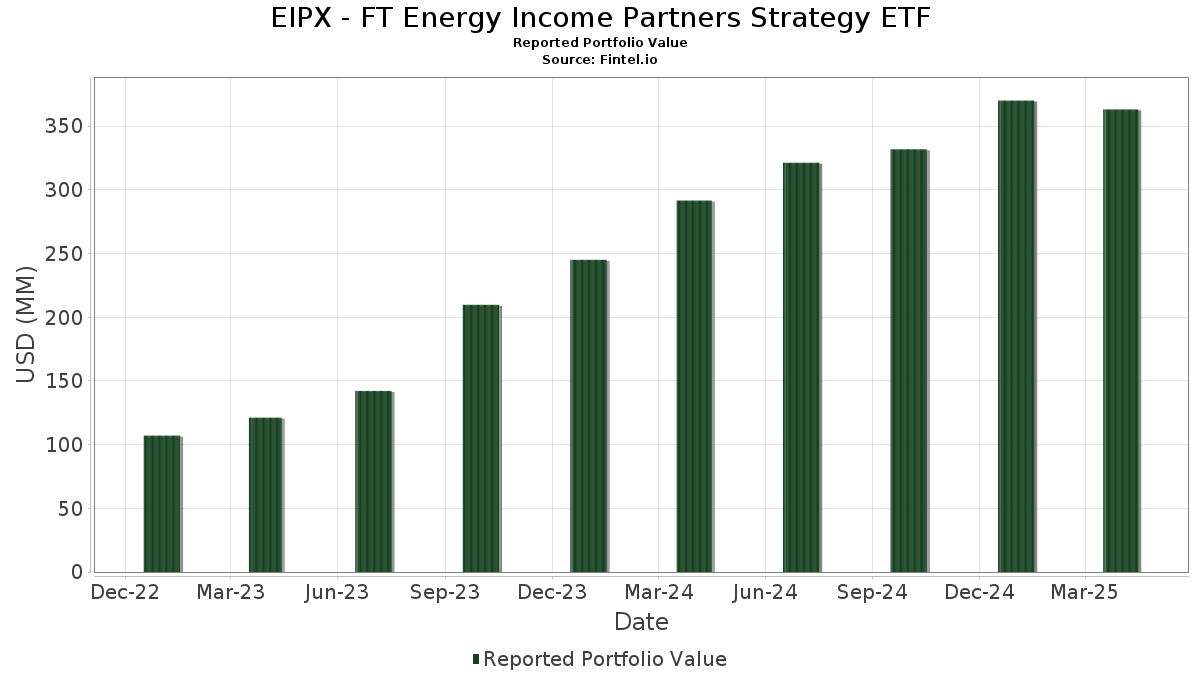
| Nilai Portfolio | $ 363,194,836 |
| Kedudukan Semasa | 89 |
Pegangan Terkini, Prestasi, AUM (dari 13F, 13D)
EIPX - FT Energy Income Partners Strategy ETF telah mendedahkan 89 jumlah pegangan dalam pemfailan SEC terkini mereka. Nilai portfolio terkini dikira sebagai $ 363,194,836 USD. Aset Sebenar Di Bawah Pengurusan (AUM) ialah nilai ini ditambah dengan tunai (yang tidak didedahkan). Pegangan teratas EIPX - FT Energy Income Partners Strategy ETF ialah Energy Transfer LP - Limited Partnership (US:ET) , Enterprise Products Partners L.P. - Limited Partnership (US:EPD) , MPLX LP - Limited Partnership (US:MPLX) , Shell plc - Depositary Receipt (Common Stock) (US:SHEL) , and Exxon Mobil Corporation (US:XOM) .
Kenaikan Teratas Suku Tahun Ini
Kami menggunakan perubahan dalam peruntukan portfolio kerana ini adalah metrik yang paling bermakna. Perubahan boleh disebabkan oleh perdagangan atau perubahan dalam harga saham.
| Sekuriti | Saham (MM) |
Nilai (MM$) |
Portfolio % | ΔPortfolio % |
|---|---|---|---|---|
| 13.21 | 13.21 | 3.6313 | 2.4156 | |
| 0.13 | 10.87 | 2.9876 | 0.5334 | |
| 0.23 | 15.47 | 4.2539 | 0.3838 | |
| 0.12 | 4.49 | 1.2348 | 0.3299 | |
| 0.02 | 5.21 | 1.4334 | 0.2453 | |
| 0.10 | 4.81 | 1.3215 | 0.2017 | |
| 0.04 | 3.63 | 0.9977 | 0.1984 | |
| 0.04 | 2.60 | 0.7152 | 0.1840 | |
| 0.09 | 2.94 | 0.8080 | 0.1688 | |
| 0.26 | 17.08 | 4.6966 | 0.1484 |
Penurunan Teratas Suku Tahun Ini
Kami menggunakan perubahan dalam peruntukan portfolio kerana ini adalah metrik yang paling bermakna. Perubahan boleh disebabkan oleh perdagangan atau perubahan dalam harga saham.
| Sekuriti | Saham (MM) |
Nilai (MM$) |
Portfolio % | ΔPortfolio % |
|---|---|---|---|---|
| 0.06 | 4.14 | 1.1381 | -0.8405 | |
| 0.01 | 0.62 | 0.1701 | -0.3508 | |
| 0.04 | 5.15 | 1.4152 | -0.3242 | |
| 0.85 | 25.52 | 7.0170 | -0.3101 | |
| 0.27 | 15.22 | 4.1858 | -0.2893 | |
| 0.03 | 2.69 | 0.7401 | -0.2822 | |
| 0.03 | 2.67 | 0.7333 | -0.2389 | |
| 0.07 | 1.35 | 0.3724 | -0.2181 | |
| 0.06 | 2.88 | 0.7922 | -0.2078 | |
| 0.00 | 0.48 | 0.1333 | -0.2078 |
13F dan Pemfailan Dana
Borang ini telah difailkan pada 2025-06-25 untuk tempoh pelaporan 2025-04-30. Klik ikon pautan untuk melihat sejarah transaksi penuh.
Tingkatkan untuk membuka data premium dan eksport ke Excel ![]() .
.
| Sekuriti | Jenis | Purata Harga Saham | Saham (MM) |
ΔSaham (%) |
ΔSaham (%) |
Nilai ($MM) |
Portfolio (%) |
ΔPortfolio (%) |
|
|---|---|---|---|---|---|---|---|---|---|
| ET / Energy Transfer LP - Limited Partnership | 1.58 | 22.28 | 26.19 | -1.24 | 7.1998 | 0.0490 | |||
| EPD / Enterprise Products Partners L.P. - Limited Partnership | 0.85 | 2.57 | 25.52 | -6.07 | 7.0170 | -0.3101 | |||
| MPLX / MPLX LP - Limited Partnership | 0.35 | -1.94 | 17.99 | -3.98 | 4.9465 | -0.1063 | |||
| SHEL / Shell plc - Depositary Receipt (Common Stock) | 0.26 | 3.44 | 17.08 | 1.29 | 4.6966 | 0.1484 | |||
| XOM / Exxon Mobil Corporation | 0.15 | -1.54 | 16.28 | -2.65 | 4.4767 | -0.0335 | |||
| IMO / Imperial Oil Limited | 0.23 | 6.31 | 15.47 | 7.81 | 4.2539 | 0.3838 | |||
| TTE / TotalEnergies SE - Depositary Receipt (Common Stock) | 0.27 | -6.35 | 15.22 | -8.26 | 4.1858 | -0.2893 | |||
| US61747C5821 / Morgan Stanley Institutional Liquidity Funds - Treasury Portfolio | 13.21 | 192.97 | 13.21 | 192.97 | 3.6313 | 2.4156 | |||
| OKE / ONEOK, Inc. | 0.13 | 41.22 | 10.87 | 19.41 | 2.9876 | 0.5334 | |||
| PAGP / Plains GP Holdings, L.P. - Limited Partnership | 0.53 | 3.44 | 9.83 | -8.83 | 2.7015 | -0.2051 | |||
| NFG / National Fuel Gas Company | 0.12 | -9.62 | 9.49 | -0.90 | 2.6087 | 0.0266 | |||
| KMI / Kinder Morgan, Inc. | 0.36 | -0.16 | 9.49 | -4.45 | 2.6083 | -0.0691 | |||
| EOG / EOG Resources, Inc. | 0.06 | 9.22 | 6.45 | -4.21 | 1.7748 | -0.0423 | |||
| SUN / Sunoco LP - Limited Partnership | 0.11 | 3.43 | 6.11 | 6.78 | 1.6811 | 0.1369 | |||
| TRGP / Targa Resources Corp. | 0.03 | 22.47 | 5.93 | 6.35 | 1.6314 | 0.1268 | |||
| PWR / Quanta Services, Inc. | 0.02 | 24.37 | 5.21 | 18.34 | 1.4334 | 0.2453 | |||
| VST / Vistra Corp. | 0.04 | 3.44 | 5.15 | -20.20 | 1.4152 | -0.3242 | |||
| SLB / Schlumberger Limited | 0.15 | 3.44 | 4.98 | -14.61 | 1.3696 | -0.2037 | |||
| TRP / TC Energy Corporation | 0.10 | 3.44 | 4.81 | 15.75 | 1.3215 | 0.2017 | |||
| AROC / Archrock, Inc. | 0.20 | 3.44 | 4.73 | -13.36 | 1.3001 | -0.1716 | |||
| ACLLF / ATCO Ltd. | 0.12 | 13.24 | 4.49 | 33.83 | 1.2348 | 0.3299 | |||
| LNG / Cheniere Energy, Inc. | 0.02 | 7.20 | 4.33 | 10.76 | 1.1916 | 0.1366 | |||
| SRE / Sempra | 0.06 | -37.00 | 4.14 | -43.58 | 1.1381 | -0.8405 | |||
| FTI / TechnipFMC plc | 0.13 | 3.44 | 3.72 | -3.02 | 1.0231 | -0.0118 | |||
| CNP / CenterPoint Energy, Inc. | 0.09 | -13.81 | 3.68 | 2.62 | 1.0125 | 0.0448 | |||
| DTM / DT Midstream, Inc. | 0.04 | 27.32 | 3.63 | 22.44 | 0.9977 | 0.1984 | |||
| AEP / American Electric Power Company, Inc. | 0.03 | -14.67 | 3.57 | -6.00 | 0.9825 | -0.0428 | |||
| FANG / Diamondback Energy, Inc. | 0.03 | 3.42 | 3.55 | -16.93 | 0.9756 | -0.1763 | |||
| PPL / PPL Corporation | 0.10 | 3.43 | 3.51 | 12.37 | 0.9645 | 0.1226 | |||
| CWENA / Clearway Energy Inc - Class A | 0.12 | -16.83 | 3.26 | -7.26 | 0.8950 | -0.0516 | |||
| TXO / TXO Partners, L.P. | 0.19 | 3.44 | 3.22 | -7.63 | 0.8849 | -0.0548 | |||
| EXE / Expand Energy Corporation | 0.03 | 3.42 | 3.20 | 5.79 | 0.8799 | 0.0639 | |||
| CQP / Cheniere Energy Partners, L.P. - Limited Partnership | 0.05 | -15.76 | 3.13 | -19.29 | 0.8617 | -0.1857 | |||
| HAL / Halliburton Company | 0.16 | 3.44 | 3.09 | -21.22 | 0.8483 | -0.2077 | |||
| KEYRY / Keyera Corp. - Depositary Receipt (Common Stock) | 0.09 | 13.35 | 2.94 | 23.97 | 0.8080 | 0.1688 | |||
| RRC / Range Resources Corporation | 0.09 | 3.43 | 2.88 | -5.26 | 0.7931 | -0.0279 | |||
| ENB / Enbridge Inc. | 0.06 | -28.04 | 2.88 | -22.30 | 0.7922 | -0.2078 | |||
| EQT / EQT Corporation | 0.06 | 3.44 | 2.85 | 0.04 | 0.7841 | 0.0154 | |||
| TRMLF / Tourmaline Oil Corp. | 0.06 | 3.44 | 2.74 | 0.29 | 0.7530 | 0.0166 | |||
| ETR / Entergy Corporation | 0.03 | -30.78 | 2.69 | -29.00 | 0.7401 | -0.2822 | |||
| SO / The Southern Company | 0.03 | -32.42 | 2.67 | -26.05 | 0.7333 | -0.2389 | |||
| UGI / UGI Corporation | 0.08 | 3.44 | 2.65 | 10.40 | 0.7297 | 0.0812 | |||
| CNQ / Canadian Natural Resources Limited | 0.09 | 27.79 | 2.65 | 20.69 | 0.7283 | 0.1365 | |||
| IBDRY / Iberdrola, S.A. - Depositary Receipt (Common Stock) | 0.04 | 3.45 | 2.60 | 32.03 | 0.7152 | 0.1840 | |||
| COG / Cabot Oil & Gas Corp. | 0.10 | 3.44 | 2.57 | -8.35 | 0.7065 | -0.0496 | |||
| ARLP / Alliance Resource Partners, L.P. - Limited Partnership | 0.10 | 3.43 | 2.55 | -4.68 | 0.7008 | -0.0203 | |||
| ENLAY / Enel SpA - Depositary Receipt (Common Stock) | 0.27 | 3.44 | 2.31 | 27.38 | 0.6360 | 0.1463 | |||
| KRP / Kimbell Royalty Partners, LP - Limited Partnership | 0.17 | 3.44 | 2.08 | -19.35 | 0.5720 | -0.1236 | |||
| NOV / NOV Inc. | 0.18 | 3.44 | 2.06 | -16.90 | 0.5666 | -0.1021 | |||
| EVRG / Evergy, Inc. | 0.03 | 3.44 | 2.06 | 11.38 | 0.5655 | 0.0676 | |||
| WMB / The Williams Companies, Inc. | 0.03 | 3.43 | 1.98 | 9.35 | 0.5436 | 0.0557 | |||
| NRP / Natural Resource Partners L.P. - Limited Partnership | 0.02 | 3.45 | 1.90 | -0.37 | 0.5213 | 0.0082 | |||
| XEL / Xcel Energy Inc. | 0.03 | -0.47 | 1.79 | 4.73 | 0.4933 | 0.0312 | |||
| PEG / Public Service Enterprise Group Incorporated | 0.02 | 3.42 | 1.69 | -1.05 | 0.4654 | 0.0041 | |||
| NEE / NextEra Energy, Inc. | 0.02 | 3.43 | 1.65 | -3.33 | 0.4546 | -0.0067 | |||
| ATO / Atmos Energy Corporation | 0.01 | -26.70 | 1.56 | -17.36 | 0.4292 | -0.0803 | |||
| BKR / Baker Hughes Company | 0.04 | 3.43 | 1.54 | -20.68 | 0.4229 | -0.1003 | |||
| PCG / PG&E Corporation | 0.09 | 3.43 | 1.52 | 9.18 | 0.4188 | 0.0426 | |||
| D / Dominion Energy, Inc. | 0.03 | 3.44 | 1.49 | 1.16 | 0.4093 | 0.0126 | |||
| CEIX / CONSOL Energy Inc. | 0.02 | 3.44 | 1.43 | -17.36 | 0.3943 | -0.0735 | |||
| FLR / Fluor Corporation | 0.04 | 3.43 | 1.38 | -25.15 | 0.3790 | -0.1176 | |||
| GNRC / Generac Holdings Inc. | 0.01 | 15.33 | 1.38 | -11.68 | 0.3785 | -0.0417 | |||
| HP / Helmerich & Payne, Inc. | 0.07 | 3.43 | 1.35 | -38.15 | 0.3724 | -0.2181 | |||
| IDA / IDACORP, Inc. | 0.01 | 3.40 | 1.33 | 11.05 | 0.3650 | 0.0427 | |||
| WHD / Cactus, Inc. | 0.03 | 3.43 | 1.18 | -34.30 | 0.3241 | -0.1596 | |||
| INSW / International Seaways, Inc. | 0.03 | 3.42 | 1.12 | -9.77 | 0.3074 | -0.0270 | |||
| WTRG / Essential Utilities, Inc. | 0.03 | 3.44 | 1.05 | 19.95 | 0.2894 | 0.0527 | |||
| LNT / Alliant Energy Corporation | 0.02 | 3.43 | 0.97 | 7.27 | 0.2680 | 0.0229 | |||
| GPOR / Gulfport Energy Corporation | 0.01 | 3.38 | 0.95 | -0.11 | 0.2608 | 0.0048 | |||
| CMS / CMS Energy Corporation | 0.01 | 3.40 | 0.94 | 15.34 | 0.2587 | 0.0388 | |||
| US4039491000 / HF Sinclair Corp. | 0.03 | 3.45 | 0.94 | -13.80 | 0.2579 | -0.0355 | |||
| USAC / USA Compression Partners, LP - Limited Partnership | 0.04 | 3.45 | 0.93 | -5.30 | 0.2555 | -0.0091 | |||
| DTE / DTE Energy Company | 0.01 | -51.02 | 0.92 | -44.02 | 0.2525 | -0.1899 | |||
| SU / Suncor Energy Inc. | 0.03 | 147.20 | 0.91 | 132.99 | 0.2505 | 0.1449 | |||
| MPC / Marathon Petroleum Corporation | 0.01 | 3.50 | 0.89 | -2.40 | 0.2458 | -0.0012 | |||
| BP / BP p.l.c. - Depositary Receipt (Common Stock) | 0.03 | 3.43 | 0.89 | -8.57 | 0.2438 | -0.0177 | |||
| DHT / DHT Holdings, Inc. | 0.08 | 3.44 | 0.88 | -2.33 | 0.2420 | -0.0010 | |||
| PSX / Phillips 66 | 0.01 | 3.48 | 0.84 | -8.63 | 0.2299 | -0.0169 | |||
| VLO / Valero Energy Corporation | 0.01 | 3.50 | 0.72 | -9.67 | 0.1980 | -0.0170 | |||
| ECO / Okeanis Eco Tankers Corp. | 0.03 | 3.43 | 0.70 | 1.61 | 0.1914 | 0.0067 | |||
| FRO / Frontline plc | 0.04 | 3.44 | 0.65 | 0.31 | 0.1794 | 0.0041 | |||
| FSLR / First Solar, Inc. | 0.01 | 3.48 | 0.64 | -22.25 | 0.1749 | -0.0458 | |||
| WEC / WEC Energy Group, Inc. | 0.01 | -70.97 | 0.62 | -68.00 | 0.1701 | -0.3508 | |||
| ATGFF / AltaGas Ltd. | 0.02 | -34.61 | 0.56 | -16.19 | 0.1539 | -0.0261 | |||
| SM / SM Energy Company | 0.02 | 3.43 | 0.52 | -37.93 | 0.1437 | -0.0833 | |||
| AEE / Ameren Corporation | 0.00 | -63.60 | 0.48 | -61.71 | 0.1333 | -0.2078 | |||
| OGS / ONE Gas, Inc. | 0.01 | 3.37 | 0.48 | 15.07 | 0.1323 | 0.0194 | |||
| ALE / ALLETE, Inc. | 0.01 | 3.37 | 0.38 | 3.25 | 0.1049 | 0.0052 | |||
| AES / The AES Corporation | 0.03 | 3.43 | 0.33 | -6.07 | 0.0896 | -0.0039 |