Statistik Asas
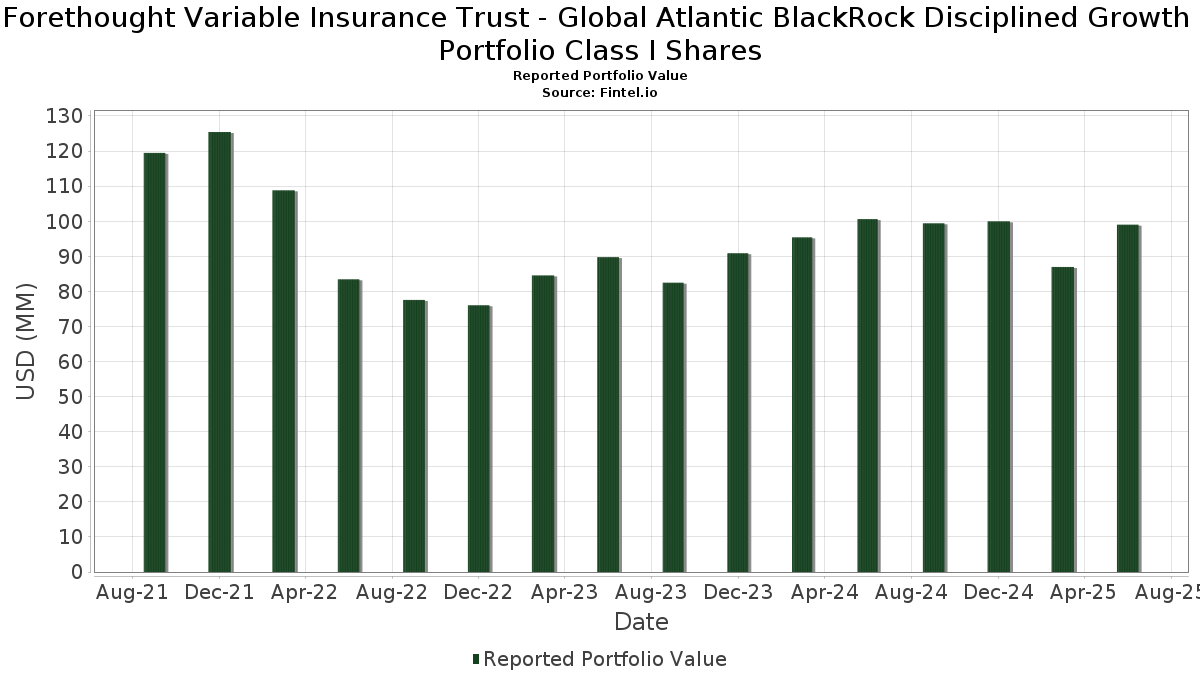
| Nilai Portfolio | $ 99,002,403 |
| Kedudukan Semasa | 110 |
Pegangan Terkini, Prestasi, AUM (dari 13F, 13D)
Forethought Variable Insurance Trust - Global Atlantic BlackRock Disciplined Growth Portfolio Class I Shares telah mendedahkan 110 jumlah pegangan dalam pemfailan SEC terkini mereka. Nilai portfolio terkini dikira sebagai $ 99,002,403 USD. Aset Sebenar Di Bawah Pengurusan (AUM) ialah nilai ini ditambah dengan tunai (yang tidak didedahkan). Pegangan teratas Forethought Variable Insurance Trust - Global Atlantic BlackRock Disciplined Growth Portfolio Class I Shares ialah Microsoft Corporation (US:MSFT) , NVIDIA Corporation (US:NVDA) , Apple Inc. (US:AAPL) , Broadcom Inc. (US:AVGO) , and Amazon.com, Inc. (US:AMZN) . Kedudukan baharu Forethought Variable Insurance Trust - Global Atlantic BlackRock Disciplined Growth Portfolio Class I Shares termasuk GE Vernova Inc. (US:GEV) , Howmet Aerospace Inc. (US:HWM) , Dutch Bros Inc. (US:BROS) , SentinelOne, Inc. (US:S) , and Credo Technology Group Holding Ltd (US:CRDO) .
Kenaikan Teratas Suku Tahun Ini
Kami menggunakan perubahan dalam peruntukan portfolio kerana ini adalah metrik yang paling bermakna. Perubahan boleh disebabkan oleh perdagangan atau perubahan dalam harga saham.
| Sekuriti | Saham (MM) |
Nilai (MM$) |
Portfolio % | ΔPortfolio % |
|---|---|---|---|---|
| 0.05 | 8.24 | 8.3210 | 2.0377 | |
| 0.00 | 3.31 | 3.3462 | 1.5167 | |
| 0.02 | 3.20 | 3.2351 | 1.4974 | |
| 0.01 | 1.41 | 1.4204 | 1.4093 | |
| 0.02 | 5.31 | 5.3623 | 1.2357 | |
| 0.02 | 1.37 | 1.3842 | 1.1021 | |
| 0.02 | 9.34 | 9.4322 | 1.0281 | |
| 0.01 | 0.88 | 0.8901 | 0.8002 | |
| 0.01 | 0.77 | 0.7800 | 0.7092 | |
| 0.00 | 1.16 | 1.1761 | 0.6630 |
Penurunan Teratas Suku Tahun Ini
Kami menggunakan perubahan dalam peruntukan portfolio kerana ini adalah metrik yang paling bermakna. Perubahan boleh disebabkan oleh perdagangan atau perubahan dalam harga saham.
| Sekuriti | Saham (MM) |
Nilai (MM$) |
Portfolio % | ΔPortfolio % |
|---|---|---|---|---|
| 0.03 | 6.91 | 6.9731 | -2.9951 | |
| 0.00 | 1.08 | 1.0922 | -1.4460 | |
| 0.00 | 0.05 | 0.0505 | -1.3530 | |
| 0.01 | 1.79 | 1.8033 | -0.9640 | |
| 0.00 | 0.11 | 0.1127 | -0.7664 | |
| 0.00 | 0.42 | 0.4266 | -0.7602 | |
| 0.00 | 0.97 | 0.9787 | -0.7397 | |
| 0.00 | 2.19 | 2.2060 | -0.6203 | |
| 0.00 | 0.01 | 0.0151 | -0.6043 | |
| 0.00 | 1.67 | 1.6891 | -0.5779 |
13F dan Pemfailan Dana
Borang ini telah difailkan pada 2025-08-26 untuk tempoh pelaporan 2025-06-30. Klik ikon pautan untuk melihat sejarah transaksi penuh.
Tingkatkan untuk membuka data premium dan eksport ke Excel ![]() .
.
| Sekuriti | Jenis | Purata Harga Saham | Saham (MM) |
ΔSaham (%) |
ΔSaham (%) |
Nilai ($MM) |
Portfolio (%) |
ΔPortfolio (%) |
|
|---|---|---|---|---|---|---|---|---|---|
| MSFT / Microsoft Corporation | 0.02 | -3.69 | 9.34 | 27.62 | 9.4322 | 1.0281 | |||
| NVDA / NVIDIA Corporation | 0.05 | 3.29 | 8.24 | 50.58 | 8.3210 | 2.0377 | |||
| AAPL / Apple Inc. | 0.03 | -13.89 | 6.91 | -20.47 | 6.9731 | -2.9951 | |||
| AVGO / Broadcom Inc. | 0.02 | -10.26 | 5.31 | 47.77 | 5.3623 | 1.2357 | |||
| AMZN / Amazon.com, Inc. | 0.02 | 2.34 | 4.91 | 17.99 | 4.9612 | 0.1810 | |||
| META / Meta Platforms, Inc. | 0.01 | -19.57 | 4.28 | 3.01 | 4.3184 | -0.4488 | |||
| NFLX / Netflix, Inc. | 0.00 | 44.82 | 3.31 | 108.04 | 3.3462 | 1.5167 | |||
| AMD / Advanced Micro Devices, Inc. | 0.02 | 53.27 | 3.20 | 111.76 | 3.2351 | 1.4974 | |||
| TSLA / Tesla, Inc. | 0.01 | -20.22 | 2.35 | -2.21 | 2.3698 | -0.3857 | |||
| GOOGL / Alphabet Inc. | 0.01 | 19.95 | 2.33 | 36.72 | 2.3500 | 0.3953 | |||
| LLY / Eli Lilly and Company | 0.00 | -5.97 | 2.19 | -11.25 | 2.2060 | -0.6203 | |||
| CRM / Salesforce, Inc. | 0.01 | 37.05 | 1.82 | 39.29 | 1.8330 | 0.3364 | |||
| FIGXX / Fidelity Colchester Street Trust - Fidelity Institutional Money Market Funds Government Portfolio Class I | 1.80 | 21.33 | 1.80 | 21.36 | 1.8188 | 0.1144 | |||
| GOOG / Alphabet Inc. | 0.01 | -34.74 | 1.79 | -25.89 | 1.8033 | -0.9640 | |||
| COST / Costco Wholesale Corporation | 0.00 | -19.06 | 1.67 | -15.30 | 1.6891 | -0.5779 | |||
| NOW / ServiceNow, Inc. | 0.00 | 7.46 | 1.53 | 38.76 | 1.5403 | 0.2782 | |||
| DELL / Dell Technologies Inc. | 0.01 | 10,725.47 | 1.41 | 15,522.22 | 1.4204 | 1.4093 | |||
| SCHW / The Charles Schwab Corporation | 0.02 | 378.57 | 1.37 | 459.59 | 1.3842 | 1.1021 | |||
| ORCL / Oracle Corporation | 0.01 | 23.42 | 1.35 | 93.14 | 1.3657 | 0.5611 | |||
| WMT / Walmart Inc. | 0.01 | 44.34 | 1.22 | 60.84 | 1.2359 | 0.3618 | |||
| HD / The Home Depot, Inc. | 0.00 | -9.60 | 1.22 | -9.50 | 1.2308 | -0.3166 | |||
| INTU / Intuit Inc. | 0.00 | 103.16 | 1.16 | 160.99 | 1.1761 | 0.6630 | |||
| BKNG / Booking Holdings Inc. | 0.00 | -39.94 | 1.12 | -24.53 | 1.1339 | -0.5743 | |||
| V / Visa Inc. | 0.00 | -51.70 | 1.08 | -51.11 | 1.0922 | -1.4460 | |||
| PLTR / Palantir Technologies Inc. | 0.01 | 9.67 | 1.03 | 77.20 | 1.0362 | 0.3711 | |||
| ABBV / AbbVie Inc. | 0.01 | 151.15 | 0.97 | 122.65 | 0.9828 | 0.4805 | |||
| MA / Mastercard Incorporated | 0.00 | -36.84 | 0.97 | -35.23 | 0.9787 | -0.7397 | |||
| ADBE / Adobe Inc. | 0.00 | 5.73 | 0.95 | 6.63 | 0.9585 | -0.0634 | |||
| UBER / Uber Technologies, Inc. | 0.01 | 16.21 | 0.94 | 48.74 | 0.9528 | 0.2248 | |||
| CAH / Cardinal Health, Inc. | 0.01 | 589.62 | 0.88 | 878.89 | 0.8901 | 0.8002 | |||
| LRCX / Lam Research Corporation | 0.01 | -7.70 | 0.87 | 23.71 | 0.8747 | 0.0700 | |||
| QCOM / QUALCOMM Incorporated | 0.01 | -10.86 | 0.87 | -7.59 | 0.8736 | -0.2012 | |||
| FLEX / Flex Ltd. | 0.02 | 170.38 | 0.84 | 308.78 | 0.8469 | 0.6109 | |||
| BSX / Boston Scientific Corporation | 0.01 | 9.20 | 0.77 | 16.27 | 0.7804 | 0.0172 | |||
| BX / Blackstone Inc. | 0.01 | 1,071.20 | 0.77 | 1,165.57 | 0.7800 | 0.7092 | |||
| MCO / Moody's Corporation | 0.00 | 1.46 | 0.73 | 9.27 | 0.7389 | -0.0299 | |||
| RL / Ralph Lauren Corporation | 0.00 | 501.38 | 0.72 | 648.96 | 0.7261 | 0.6156 | |||
| FTNT / Fortinet, Inc. | 0.01 | 4.21 | 0.71 | 14.47 | 0.7192 | 0.0047 | |||
| SPF / Spotify Technology S.A. | 0.00 | 488.00 | 0.68 | 724.39 | 0.6833 | 0.5886 | |||
| GE / General Electric Company | 0.00 | 167.84 | 0.65 | 313.46 | 0.6515 | 0.4955 | |||
| BMY / Bristol-Myers Squibb Company | 0.01 | 154.04 | 0.60 | 129.62 | 0.6037 | 0.3167 | |||
| REGN / Regeneron Pharmaceuticals, Inc. | 0.00 | 678.36 | 0.55 | 551.19 | 0.5528 | 0.4553 | |||
| SPGI / S&P Global Inc. | 0.00 | -12.77 | 0.54 | -9.50 | 0.5489 | -0.1406 | |||
| ANET / Arista Networks Inc | 0.01 | 81.37 | 0.54 | 139.82 | 0.5482 | 0.2879 | |||
| GDDY / GoDaddy Inc. | 0.00 | 308.81 | 0.52 | 311.11 | 0.5232 | 0.3776 | |||
| TJX / The TJX Companies, Inc. | 0.00 | -42.80 | 0.50 | -41.98 | 0.5038 | -0.4840 | |||
| TXN / Texas Instruments Incorporated | 0.00 | 1,183.52 | 0.48 | 1,326.47 | 0.4897 | 0.4556 | |||
| APH / Amphenol Corporation | 0.00 | -50.04 | 0.46 | -24.71 | 0.4614 | -0.2360 | |||
| MRVL / Marvell Technology, Inc. | 0.01 | 9.37 | 0.45 | 37.69 | 0.4580 | 0.0792 | |||
| CTAS / Cintas Corporation | 0.00 | -62.31 | 0.42 | -59.15 | 0.4266 | -0.7602 | |||
| MS / Morgan Stanley | 0.00 | -27.72 | 0.40 | -12.74 | 0.4083 | -0.1237 | |||
| PH / Parker-Hannifin Corporation | 0.00 | -19.12 | 0.37 | -7.00 | 0.3759 | -0.0840 | |||
| GRMN / Garmin Ltd. | 0.00 | 47.61 | 0.35 | 42.21 | 0.3509 | 0.0697 | |||
| FIX / Comfort Systems USA, Inc. | 0.00 | -34.49 | 0.33 | 8.85 | 0.3362 | -0.0146 | |||
| TEAM / Atlassian Corporation | 0.00 | 209.06 | 0.33 | 196.43 | 0.3359 | 0.2067 | |||
| ORLY / O'Reilly Automotive, Inc. | 0.00 | 22,868.75 | 0.33 | 1,404.55 | 0.3344 | 0.3081 | |||
| CPNG / Coupang, Inc. | 0.01 | 185.35 | 0.33 | 293.98 | 0.3306 | 0.2342 | |||
| ESTC / Elastic N.V. | 0.00 | 179.22 | 0.32 | 165.83 | 0.3226 | 0.1838 | |||
| AXP / American Express Company | 0.00 | 33.33 | 0.32 | 58.00 | 0.3195 | 0.0897 | |||
| GEV / GE Vernova Inc. | 0.00 | 0.29 | 0.2912 | 0.2912 | |||||
| MELI / MercadoLibre, Inc. | 0.00 | -31.61 | 0.28 | -8.28 | 0.2797 | -0.0674 | |||
| HWM / Howmet Aerospace Inc. | 0.00 | 0.27 | 0.2755 | 0.2755 | |||||
| GILD / Gilead Sciences, Inc. | 0.00 | 29.31 | 0.27 | 27.96 | 0.2731 | 0.0304 | |||
| PGR / The Progressive Corporation | 0.00 | -59.65 | 0.27 | -62.00 | 0.2692 | -0.5353 | |||
| MSI / Motorola Solutions, Inc. | 0.00 | -45.08 | 0.26 | -47.39 | 0.2653 | -0.3066 | |||
| PANW / Palo Alto Networks, Inc. | 0.00 | -28.33 | 0.25 | -14.04 | 0.2535 | -0.0819 | |||
| RMBS / Rambus Inc. | 0.00 | 34.08 | 0.25 | 66.22 | 0.2485 | 0.0781 | |||
| WCN / Waste Connections, Inc. | 0.00 | 12.15 | 0.24 | 16.99 | 0.2436 | 0.0364 | |||
| NTRA / Natera, Inc. | 0.00 | 0.00 | 0.24 | 19.90 | 0.2434 | 0.0117 | |||
| FDX / FedEx Corporation | 0.00 | 580.65 | 0.24 | 545.95 | 0.2421 | 0.1987 | |||
| FICO / Fair Isaac Corporation | 0.00 | -27.53 | 0.24 | -28.35 | 0.2381 | -0.1388 | |||
| WDAY / Workday, Inc. | 0.00 | 149.19 | 0.22 | 158.14 | 0.2246 | 0.1249 | |||
| FLS / Flowserve Corporation | 0.00 | 0.21 | 0.2152 | 0.2152 | |||||
| HEIA / Heico Corp. - Class A | 0.00 | 128.49 | 0.21 | 181.33 | 0.2137 | 0.1270 | |||
| AZO / AutoZone, Inc. | 0.00 | 0.20 | 0.2061 | 0.2061 | |||||
| CDNS / Cadence Design Systems, Inc. | 0.00 | -55.43 | 0.19 | -46.09 | 0.1954 | -0.2160 | |||
| TRGP / Targa Resources Corp. | 0.00 | -40.35 | 0.18 | -48.17 | 0.1858 | -0.2220 | |||
| ADI / Analog Devices, Inc. | 0.00 | 0.15 | 0.1548 | 0.1548 | |||||
| LMT / Lockheed Martin Corporation | 0.00 | -24.53 | 0.13 | -21.82 | 0.1309 | -0.0593 | |||
| BROS / Dutch Bros Inc. | 0.00 | 0.13 | 0.1265 | 0.1265 | |||||
| KEYS / Keysight Technologies, Inc. | 0.00 | -67.11 | 0.12 | -65.99 | 0.1198 | -0.2001 | |||
| PM / Philip Morris International Inc. | 0.00 | 406.50 | 0.11 | 494.74 | 0.1146 | 0.0921 | |||
| DASH / DoorDash, Inc. | 0.00 | -89.19 | 0.11 | -85.49 | 0.1127 | -0.7664 | |||
| WM / Waste Management, Inc. | 0.00 | 54.75 | 0.09 | 55.00 | 0.0940 | 0.0241 | |||
| ICE / Intercontinental Exchange, Inc. | 0.00 | 0.00 | 0.09 | 6.17 | 0.0871 | -0.0060 | |||
| VRSN / VeriSign, Inc. | 0.00 | 17.34 | 0.08 | 82.61 | 0.0848 | 0.0356 | |||
| NASDAQ 100 E-MINI / DE (000000000) | 0.08 | 0.0827 | 0.0827 | ||||||
| AME / AMETEK, Inc. | 0.00 | 171.08 | 0.08 | 170.00 | 0.0822 | 0.0504 | |||
| RBLX / Roblox Corporation | 0.00 | -29.11 | 0.08 | 28.57 | 0.0820 | 0.0091 | |||
| ADSK / Autodesk, Inc. | 0.00 | -86.54 | 0.08 | -84.20 | 0.0803 | -0.4937 | |||
| BMI / Badger Meter, Inc. | 0.00 | -31.49 | 0.08 | -12.36 | 0.0796 | -0.0230 | |||
| S / SentinelOne, Inc. | 0.00 | 0.08 | 0.0759 | 0.0759 | |||||
| UTHR / United Therapeutics Corporation | 0.00 | -13.90 | 0.07 | -20.00 | 0.0737 | -0.0307 | |||
| ETR / Entergy Corporation | 0.00 | -65.12 | 0.07 | -75.35 | 0.0724 | -0.1933 | |||
| YUM / Yum! Brands, Inc. | 0.00 | 0.00 | 0.07 | 7.58 | 0.0723 | -0.0023 | |||
| MTZ / MasTec, Inc. | 0.00 | -55.72 | 0.07 | -35.78 | 0.0712 | -0.0540 | |||
| AN / AutoNation, Inc. | 0.00 | 32.31 | 0.06 | 50.00 | 0.0608 | 0.0196 | |||
| ZS / Zscaler, Inc. | 0.00 | 103.49 | 0.05 | 237.50 | 0.0555 | 0.0391 | |||
| CRDO / Credo Technology Group Holding Ltd | 0.00 | 0.05 | 0.0545 | 0.0545 | |||||
| VEEV / Veeva Systems Inc. | 0.00 | -62.98 | 0.05 | -54.78 | 0.0535 | -0.0787 | |||
| NTAP / NetApp, Inc. | 0.00 | -96.12 | 0.05 | -96.51 | 0.0505 | -1.3530 | |||
| CVLT / Commvault Systems, Inc. | 0.00 | 0.05 | 0.0473 | 0.0473 | |||||
| CIEN / Ciena Corporation | 0.00 | -78.94 | 0.03 | -62.92 | 0.0339 | -0.0734 | |||
| MCK / McKesson Corporation | 0.00 | -93.60 | 0.02 | -86.39 | 0.0237 | -0.1942 | |||
| RBRK / Rubrik, Inc. | 0.00 | 0.02 | 0.0224 | 0.0224 | |||||
| APP / AppLovin Corporation | 0.00 | -93.88 | 0.02 | -91.89 | 0.0212 | -0.2772 | |||
| M1Z / Nu Holdings Ltd. | 0.00 | 0.02 | 0.0200 | 0.0200 | |||||
| EAT / Brinker International, Inc. | 0.00 | 0.02 | 0.0188 | 0.0188 | |||||
| ACN / Accenture plc | 0.00 | -97.11 | 0.01 | -97.40 | 0.0151 | -0.6043 | |||
| HEI / HEICO Corporation | 0.00 | 0.01 | 0.0129 | 0.0129 | |||||
| DOCS / Doximity, Inc. | 0.00 | -100.00 | 0.00 | -100.00 | -0.0096 | ||||
| EHC / Encompass Health Corporation | 0.00 | -100.00 | 0.00 | -100.00 | -0.0524 | ||||
| COHR / Coherent Corp. | 0.00 | -100.00 | 0.00 | -100.00 | -0.1161 | ||||
| SAIL / SailPoint, Inc. | 0.00 | -100.00 | 0.00 | -100.00 | -0.0218 | ||||
| SPG / Simon Property Group, Inc. | 0.00 | -100.00 | 0.00 | -100.00 | -0.1560 |