Statistik Asas
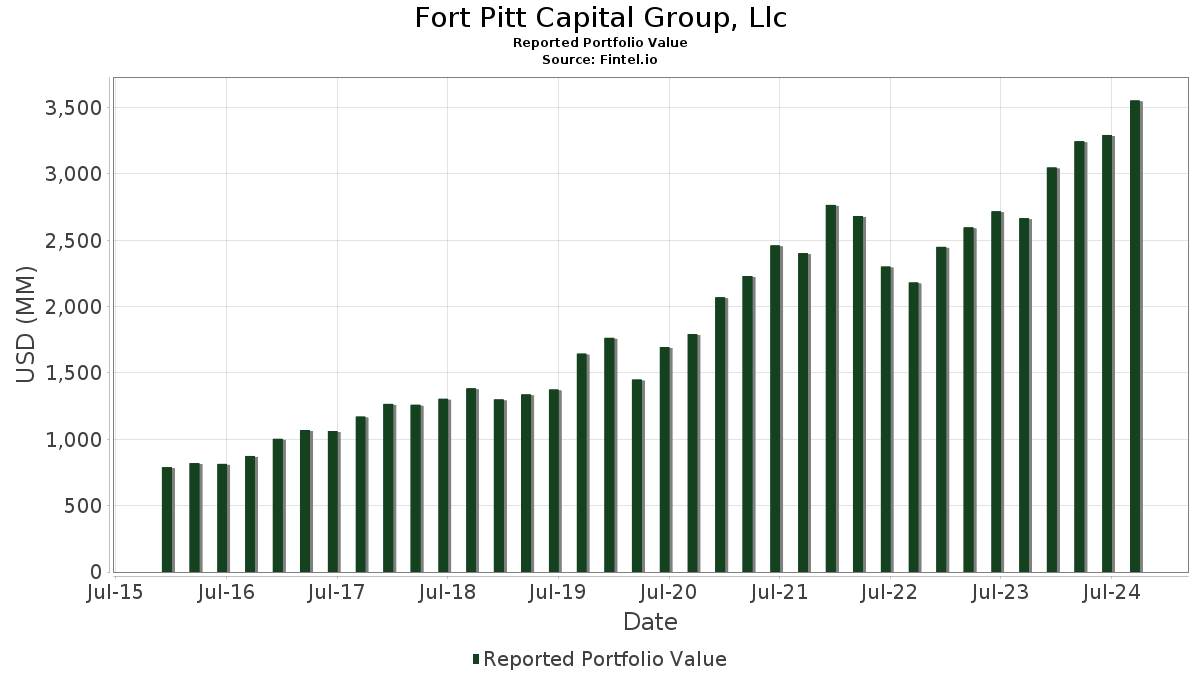
| Nilai Portfolio | $ 3,553,314,614 |
| Kedudukan Semasa | 127 |
Pegangan Terkini, Prestasi, AUM (dari 13F, 13D)
Fort Pitt Capital Group, Llc telah mendedahkan 127 jumlah pegangan dalam pemfailan SEC terkini mereka. Nilai portfolio terkini dikira sebagai $ 3,553,314,614 USD. Aset Sebenar Di Bawah Pengurusan (AUM) ialah nilai ini ditambah dengan tunai (yang tidak didedahkan). Pegangan teratas Fort Pitt Capital Group, Llc ialah Broadcom Inc. (US:AVGO) , Thermo Fisher Scientific Inc. (US:TMO) , Schwab Strategic Trust - Schwab U.S. Large-Cap Growth ETF (US:SCHG) , Starbucks Corporation (US:SBUX) , and Alphabet Inc. (US:GOOGL) . Kedudukan baharu Fort Pitt Capital Group, Llc termasuk iShares Trust - iShares Core S&P U.S. Value ETF (US:IUSV) , iShares Trust - iShares Core S&P U.S. Growth ETF (US:IUSG) , .
Kenaikan Teratas Suku Tahun Ini
Kami menggunakan perubahan dalam peruntukan portfolio kerana ini adalah metrik yang paling bermakna. Perubahan boleh disebabkan oleh perdagangan atau perubahan dalam harga saham.
| Sekuriti | Saham (MM) |
Nilai (MM$) |
Portfolio % | ΔPortfolio % |
|---|---|---|---|---|
| 0.69 | 109.14 | 3.0714 | 1.2791 | |
| 0.94 | 161.43 | 4.5430 | 0.9489 | |
| 1.53 | 148.74 | 4.1859 | 0.6629 | |
| 0.48 | 130.24 | 3.6654 | 0.4690 | |
| 0.22 | 136.04 | 3.8286 | 0.4681 | |
| 0.80 | 122.98 | 3.4609 | 0.4617 | |
| 0.47 | 88.00 | 2.4767 | 0.4322 | |
| 0.31 | 113.12 | 3.1836 | 0.3108 | |
| 1.10 | 137.49 | 3.8693 | 0.2991 | |
| 0.16 | 94.37 | 2.6559 | 0.2767 |
Penurunan Teratas Suku Tahun Ini
Kami menggunakan perubahan dalam peruntukan portfolio kerana ini adalah metrik yang paling bermakna. Perubahan boleh disebabkan oleh perdagangan atau perubahan dalam harga saham.
| Sekuriti | Saham (MM) |
Nilai (MM$) |
Portfolio % | ΔPortfolio % |
|---|---|---|---|---|
| 0.52 | 31.87 | 0.8969 | -1.6029 | |
| 0.35 | 22.90 | 0.6446 | -1.2886 | |
| 0.90 | 148.70 | 4.1848 | -0.7563 | |
| 0.02 | 0.64 | 0.0181 | -0.5505 | |
| 0.29 | 126.54 | 3.5611 | -0.4640 | |
| 1.22 | 47.68 | 1.3420 | -0.4300 | |
| 1.17 | 23.14 | 0.6511 | -0.4074 | |
| 0.08 | 63.62 | 1.7904 | -0.3330 | |
| 0.34 | 88.52 | 2.4912 | -0.3039 | |
| 0.05 | 13.84 | 0.3896 | -0.1885 |
13F dan Pemfailan Dana
Borang ini telah difailkan pada 2024-10-29 untuk tempoh pelaporan 2024-09-30. Klik ikon pautan untuk melihat sejarah transaksi penuh.
Tingkatkan untuk membuka data premium dan eksport ke Excel ![]() .
.
| Sekuriti | Jenis | Purata Harga Saham | Saham (MM) |
ΔSaham (%) |
ΔSaham (%) |
Nilai ($MM) |
Portfolio (%) |
ΔPortfolio (%) |
|
|---|---|---|---|---|---|---|---|---|---|
| AVGO / Broadcom Inc. | 0.94 | 1,169.11 | 161.43 | 36.35 | 4.5430 | 0.9489 | |||
| TMO / Thermo Fisher Scientific Inc. | 0.26 | 1.49 | 158.55 | 13.53 | 4.4620 | 0.2221 | |||
| SCHG / Schwab Strategic Trust - Schwab U.S. Large-Cap Growth ETF | 1.48 | 2.53 | 154.21 | 5.92 | 4.3398 | -0.0799 | |||
| SBUX / Starbucks Corporation | 1.53 | 2.35 | 148.74 | 28.17 | 4.1859 | 0.6629 | |||
| GOOGL / Alphabet Inc. | 0.90 | 0.34 | 148.70 | -8.64 | 4.1848 | -0.7563 | |||
| AMD / Advanced Micro Devices, Inc. | 0.90 | 10.99 | 147.74 | 12.27 | 4.1577 | 0.1628 | |||
| AJG / Arthur J. Gallagher & Co. | 0.49 | -1.46 | 137.66 | 6.92 | 3.8742 | -0.0344 | |||
| APO / Apollo Global Management, Inc. | 1.10 | 10.51 | 137.49 | 16.91 | 3.8693 | 0.2991 | |||
| PH / Parker-Hannifin Corporation | 0.22 | -1.61 | 136.04 | 22.90 | 3.8286 | 0.4681 | |||
| LOW / Lowe's Companies, Inc. | 0.48 | 0.69 | 130.24 | 23.70 | 3.6654 | 0.4690 | |||
| GXO / GXO Logistics, Inc. | 2.47 | 2.12 | 128.50 | 5.29 | 3.6163 | -0.0886 | |||
| MSFT / Microsoft Corporation | 0.29 | -0.87 | 126.54 | -4.56 | 3.5611 | -0.4640 | |||
| BX / Blackstone Inc. | 0.80 | 0.64 | 122.98 | 24.48 | 3.4609 | 0.4617 | |||
| ZBRA / Zebra Technologies Corporation | 0.31 | -0.27 | 113.12 | 19.54 | 3.1836 | 0.3108 | |||
| AAPL / Apple Inc. | 0.47 | 0.09 | 109.42 | 10.72 | 3.0794 | 0.0792 | |||
| KEYS / Keysight Technologies, Inc. | 0.69 | 59.06 | 109.14 | 84.86 | 3.0714 | 1.2791 | |||
| UNH / UnitedHealth Group Incorporated | 0.16 | 4.89 | 94.37 | 20.42 | 2.6559 | 0.2767 | |||
| ABT / Abbott Laboratories | 0.80 | 1.43 | 90.98 | 11.29 | 2.5605 | 0.0786 | |||
| STZ / Constellation Brands, Inc. | 0.34 | -4.01 | 88.52 | -3.85 | 2.4912 | -0.3039 | |||
| AMZN / Amazon.com, Inc. | 0.47 | 35.53 | 88.00 | 30.68 | 2.4767 | 0.4322 | |||
| RTX / RTX Corporation | 0.69 | -2.58 | 83.69 | 17.58 | 2.3553 | 0.1943 | |||
| LULU / lululemon athletica inc. | 0.29 | 22.06 | 79.07 | 10.89 | 2.2253 | 0.0605 | |||
| DE / Deere & Company | 0.18 | 1.59 | 75.80 | 13.47 | 2.1333 | 0.1053 | |||
| MRK / Merck & Co., Inc. | 0.62 | 8.25 | 70.97 | -0.71 | 1.9973 | -0.1726 | |||
| DHR / Danaher Corporation | 0.24 | 3.22 | 66.19 | 14.85 | 1.8629 | 0.1132 | |||
| LRCX / Lam Research Corporation | 0.08 | 18.68 | 63.62 | -9.04 | 1.7904 | -0.3330 | |||
| PNC / The PNC Financial Services Group, Inc. | 0.34 | -7.07 | 62.65 | 10.48 | 1.7631 | 0.0416 | |||
| DVN / Devon Energy Corporation | 1.22 | -1.01 | 47.68 | -18.30 | 1.3420 | -0.4300 | |||
| JPM / JPMorgan Chase & Co. | 0.19 | -2.40 | 40.41 | 1.75 | 1.1371 | -0.0684 | |||
| GNMA / iShares Trust - iShares GNMA Bond ETF | 0.79 | -0.33 | 35.42 | 3.65 | 0.9968 | -0.0407 | |||
| CIEN / Ciena Corporation | 0.52 | -69.72 | 31.87 | -61.30 | 0.8969 | -1.6029 | |||
| VCSH / Vanguard Scottsdale Funds - Vanguard Short-Term Corporate Bond ETF | 0.30 | -0.56 | 24.09 | 2.21 | 0.6779 | -0.0376 | |||
| CII / BlackRock Enhanced Large Cap Core Fund, Inc. | 1.17 | -32.64 | 23.14 | -33.65 | 0.6511 | -0.4074 | |||
| SCHW / The Charles Schwab Corporation | 0.35 | -59.10 | 22.90 | -64.03 | 0.6446 | -1.2886 | |||
| ORCL / Oracle Corporation | 0.13 | 2.85 | 21.49 | 24.11 | 0.6049 | 0.0792 | |||
| COHR / Coherent Corp. | 0.24 | -8.41 | 21.28 | 12.39 | 0.5989 | 0.0240 | |||
| CVX / Chevron Corporation | 0.13 | 4.51 | 18.75 | -1.61 | 0.5276 | -0.0508 | |||
| ERIE / Erie Indemnity Company | 0.03 | -6.09 | 17.49 | 39.90 | 0.4922 | 0.1127 | |||
| MMC / Marsh & McLennan Companies, Inc. | 0.08 | -2.53 | 17.38 | 3.19 | 0.4890 | -0.0222 | |||
| EOI / Eaton Vance Enhanced Equity Income Fund | 0.83 | -1.07 | 16.74 | 3.00 | 0.4712 | -0.0223 | |||
| TSCO / Tractor Supply Company | 0.05 | -32.53 | 13.84 | -27.30 | 0.3896 | -0.1885 | |||
| VTI / Vanguard Index Funds - Vanguard Total Stock Market ETF | 0.04 | 9.06 | 11.27 | 15.45 | 0.3172 | 0.0208 | |||
| HON / Honeywell International Inc. | 0.05 | -4.81 | 10.74 | -7.86 | 0.3023 | -0.0516 | |||
| TXN / Texas Instruments Incorporated | 0.05 | -4.58 | 9.50 | 1.33 | 0.2674 | -0.0173 | |||
| CNH / CNH Industrial N.V. | 0.57 | 4.41 | 6.32 | 14.41 | 0.1779 | 0.0102 | |||
| NVDA / NVIDIA Corporation | 0.05 | 0.08 | 6.17 | -1.61 | 0.1736 | -0.0167 | |||
| ANSS / ANSYS, Inc. | 0.02 | -7.22 | 5.86 | -8.04 | 0.1650 | -0.0286 | |||
| ROK / Rockwell Automation, Inc. | 0.02 | -12.36 | 5.62 | -14.54 | 0.1581 | -0.0415 | |||
| KMI / Kinder Morgan, Inc. | 0.25 | -2.10 | 5.58 | 8.83 | 0.1572 | 0.0014 | |||
| DOW / Dow Inc. | 0.10 | 6.17 | 5.34 | 9.32 | 0.1503 | 0.0020 | |||
| ARCC / Ares Capital Corporation | 0.24 | 8.96 | 5.00 | 9.49 | 0.1406 | 0.0021 | |||
| GLPI / Gaming and Leisure Properties, Inc. | 0.09 | 4.29 | 4.80 | 18.69 | 0.1350 | 0.0123 | |||
| CSCO / Cisco Systems, Inc. | 0.08 | 3.91 | 4.40 | 16.42 | 0.1238 | 0.0091 | |||
| WEN / The Wendy's Company | 0.25 | 12.64 | 4.30 | 16.36 | 0.1211 | 0.0088 | |||
| LMT / Lockheed Martin Corporation | 0.01 | 2.63 | 4.06 | 28.42 | 0.1143 | 0.0183 | |||
| NVS / Novartis AG - Depositary Receipt (Common Stock) | 0.03 | 2.74 | 3.88 | 11.03 | 0.1091 | 0.0031 | |||
| TFC / Truist Financial Corporation | 0.09 | 1.94 | 3.87 | 12.26 | 0.1090 | 0.0042 | |||
| O / Realty Income Corporation | 0.06 | 3.86 | 3.75 | 24.72 | 0.1055 | 0.0142 | |||
| SCHB / Schwab Strategic Trust - Schwab U.S. Broad Market ETF | 0.05 | -0.55 | 3.58 | 5.23 | 0.1007 | -0.0025 | |||
| HSY / The Hershey Company | 0.02 | 3.43 | 0.0964 | 0.0964 | |||||
| UNP / Union Pacific Corporation | 0.01 | 4.03 | 3.32 | 13.30 | 0.0935 | 0.0045 | |||
| KKR / KKR & Co. Inc. | 0.02 | 59.80 | 2.58 | 98.31 | 0.0726 | 0.0331 | |||
| WLK / Westlake Corporation | 0.02 | -24.74 | 2.40 | -21.92 | 0.0677 | -0.0258 | |||
| NSC / Norfolk Southern Corporation | 0.01 | -1.66 | 2.20 | 13.79 | 0.0620 | 0.0032 | |||
| GOOG / Alphabet Inc. | 0.01 | 0.24 | 2.09 | -8.63 | 0.0587 | -0.0106 | |||
| INTU / Intuit Inc. | 0.00 | 31.80 | 1.92 | 24.48 | 0.0541 | 0.0072 | |||
| BRK.B / Berkshire Hathaway Inc. | 0.00 | 0.27 | 1.90 | 13.44 | 0.0535 | 0.0026 | |||
| V / Visa Inc. | 0.01 | 25.68 | 1.82 | 31.74 | 0.0512 | 0.0092 | |||
| QQQ / Invesco QQQ Trust, Series 1 | 0.00 | 0.00 | 1.67 | 1.83 | 0.0470 | -0.0028 | |||
| XOM / Exxon Mobil Corporation | 0.01 | -1.18 | 1.64 | 0.62 | 0.0461 | -0.0033 | |||
| CRWD / CrowdStrike Holdings, Inc. | 0.01 | 136.13 | 1.55 | 72.88 | 0.0436 | 0.0164 | |||
| IVV / iShares Trust - iShares Core S&P 500 ETF | 0.00 | 0.92 | 1.52 | 6.37 | 0.0428 | -0.0006 | |||
| NKE / NIKE, Inc. | 0.02 | 54.26 | 1.50 | 80.82 | 0.0422 | 0.0170 | |||
| CAT / Caterpillar Inc. | 0.00 | 2.38 | 1.43 | 20.15 | 0.0403 | 0.0041 | |||
| GJR / Strats Trust For Procter & Gambel Security - Preferred Security | 0.01 | 6.25 | 1.30 | 11.61 | 0.0365 | 0.0012 | |||
| VUG / Vanguard Index Funds - Vanguard Growth ETF | 0.00 | 1.44 | 1.28 | 4.17 | 0.0359 | -0.0013 | |||
| LLY / Eli Lilly and Company | 0.00 | 6.12 | 1.23 | 3.89 | 0.0346 | -0.0013 | |||
| COKE / Coca-Cola Consolidated, Inc. | 0.00 | 0.00 | 1.18 | 21.31 | 0.0333 | 0.0037 | |||
| SITE / SiteOne Landscape Supply, Inc. | 0.01 | 49.49 | 1.17 | 86.05 | 0.0330 | 0.0139 | |||
| PPG / PPG Industries, Inc. | 0.01 | -19.31 | 1.16 | -15.11 | 0.0326 | -0.0088 | |||
| HD / The Home Depot, Inc. | 0.00 | -1.76 | 1.13 | 15.66 | 0.0318 | 0.0021 | |||
| SCHX / Schwab Strategic Trust - Schwab U.S. Large-Cap ETF | 0.02 | 17.97 | 1.11 | 24.63 | 0.0312 | 0.0042 | |||
| RPM / RPM International Inc. | 0.01 | -14.26 | 1.08 | -3.67 | 0.0303 | -0.0036 | |||
| ITOT / iShares Trust - iShares Core S&P Total U.S. Stock Market ETF | 0.01 | 0.06 | 1.05 | 5.84 | 0.0296 | -0.0006 | |||
| VOO / Vanguard Index Funds - Vanguard S&P 500 ETF | 0.00 | 0.33 | 0.96 | 5.82 | 0.0271 | -0.0005 | |||
| ABBV / AbbVie Inc. | 0.00 | 0.00 | 0.92 | 15.25 | 0.0260 | 0.0016 | |||
| CCI / Crown Castle Inc. | 0.01 | -81.02 | 0.87 | -76.96 | 0.0244 | -0.0898 | |||
| WMT / Walmart Inc. | 0.01 | 4.59 | 0.86 | 24.75 | 0.0243 | 0.0033 | |||
| L / Loews Corporation | 0.01 | -23.94 | 0.85 | -19.60 | 0.0239 | -0.0082 | |||
| AXP / American Express Company | 0.00 | -0.89 | 0.84 | 15.98 | 0.0237 | 0.0017 | |||
| JNJ / Johnson & Johnson | 0.01 | -0.53 | 0.82 | 10.32 | 0.0232 | 0.0005 | |||
| VTV / Vanguard Index Funds - Vanguard Value ETF | 0.00 | 3.49 | 0.66 | 12.50 | 0.0185 | 0.0008 | |||
| BAC / Bank of America Corporation | 0.02 | -96.55 | 0.64 | -96.56 | 0.0181 | -0.5505 | |||
| META / Meta Platforms, Inc. | 0.00 | 15.46 | 0.63 | 31.11 | 0.0177 | 0.0031 | |||
| MA / Mastercard Incorporated | 0.00 | 0.00 | 0.61 | 11.86 | 0.0173 | 0.0006 | |||
| PEP / PepsiCo, Inc. | 0.00 | -3.69 | 0.56 | -0.70 | 0.0159 | -0.0014 | |||
| KMB / Kimberly-Clark Corporation | 0.00 | -9.32 | 0.56 | -6.68 | 0.0157 | -0.0024 | |||
| IJH / iShares Trust - iShares Core S&P Mid-Cap ETF | 0.01 | 0.97 | 0.51 | 7.56 | 0.0144 | -0.0000 | |||
| HBAN / Huntington Bancshares Incorporated | 0.03 | 0.45 | 0.0128 | 0.0128 | |||||
| XYL / Xylem Inc. | 0.00 | 0.25 | 0.44 | -0.23 | 0.0123 | -0.0010 | |||
| MCD / McDonald's Corporation | 0.00 | 17.30 | 0.43 | 40.20 | 0.0121 | 0.0028 | |||
| MAR / Marriott International, Inc. | 0.00 | 0.00 | 0.41 | 2.74 | 0.0116 | -0.0006 | |||
| IBM / International Business Machines Corporation | 0.00 | 29.33 | 0.40 | 65.43 | 0.0113 | 0.0039 | |||
| TQQQ / ProShares Trust - ProShares UltraPro QQQ | 0.01 | 0.00 | 0.40 | -1.72 | 0.0113 | -0.0011 | |||
| IUSV / iShares Trust - iShares Core S&P U.S. Value ETF | 0.00 | 0.40 | 0.0112 | 0.0112 | |||||
| HIG / The Hartford Insurance Group, Inc. | 0.00 | 0.45 | 0.40 | 17.56 | 0.0111 | 0.0009 | |||
| DIA / SPDR Dow Jones Industrial Average ETF Trust | 0.00 | 6.65 | 0.39 | 15.25 | 0.0111 | 0.0007 | |||
| TJX / The TJX Companies, Inc. | 0.00 | 2.71 | 0.37 | 9.50 | 0.0104 | 0.0002 | |||
| PM / Philip Morris International Inc. | 0.00 | 0.00 | 0.37 | 19.61 | 0.0103 | 0.0010 | |||
| VV / Vanguard Index Funds - Vanguard Large-Cap ETF | 0.00 | 0.00 | 0.36 | 5.51 | 0.0102 | -0.0002 | |||
| VO / Vanguard Index Funds - Vanguard Mid-Cap ETF | 0.00 | 0.00 | 0.36 | 9.04 | 0.0102 | 0.0001 | |||
| AXNX / Axonics, Inc. | 0.01 | 0.00 | 0.35 | 3.57 | 0.0098 | -0.0004 | |||
| KO / The Coca-Cola Company | 0.00 | 1.24 | 0.33 | 14.63 | 0.0093 | 0.0005 | |||
| IUSG / iShares Trust - iShares Core S&P U.S. Growth ETF | 0.00 | 0.33 | 0.0092 | 0.0092 | |||||
| IJR / iShares Trust - iShares Core S&P Small-Cap ETF | 0.00 | 18.05 | 0.32 | 29.55 | 0.0090 | 0.0015 | |||
| VZ / Verizon Communications Inc. | 0.01 | -2.09 | 0.31 | 6.55 | 0.0087 | -0.0001 | |||
| VOT / Vanguard Index Funds - Vanguard Mid-Cap Growth ETF | 0.00 | 0.00 | 0.30 | 6.09 | 0.0083 | -0.0001 | |||
| WM / Waste Management, Inc. | 0.00 | 0.26 | 0.0075 | 0.0075 | |||||
| CL / Colgate-Palmolive Company | 0.00 | -20.08 | 0.26 | -14.66 | 0.0074 | -0.0019 | |||
| SPY / SPDR S&P 500 ETF | 0.00 | -12.11 | 0.25 | -7.55 | 0.0069 | -0.0011 | |||
| NUE / Nucor Corporation | 0.00 | 0.00 | 0.24 | -4.76 | 0.0068 | -0.0009 | |||
| PFE / Pfizer Inc. | 0.01 | -0.12 | 0.24 | 3.46 | 0.0067 | -0.0003 | |||
| TTD / The Trade Desk, Inc. | 0.00 | 0.00 | 0.24 | 12.32 | 0.0067 | 0.0003 | |||
| PAYC / Paycom Software, Inc. | 0.00 | 0.00 | 0.23 | 16.50 | 0.0066 | 0.0005 | |||
| ETN / Eaton Corporation plc | 0.00 | 0.22 | 0.0061 | 0.0061 | |||||
| EMR / Emerson Electric Co. | 0.00 | -1.43 | 0.20 | -2.42 | 0.0057 | -0.0006 | |||
| PEG / Public Service Enterprise Group Incorporated | 0.00 | 0.20 | 0.0056 | 0.0056 | |||||
| IWF / iShares Trust - iShares Russell 1000 Growth ETF | 0.00 | -100.00 | 0.00 | 0.0000 | |||||
| APD / Air Products and Chemicals, Inc. | 0.00 | -100.00 | 0.00 | 0.0000 |