Statistik Asas
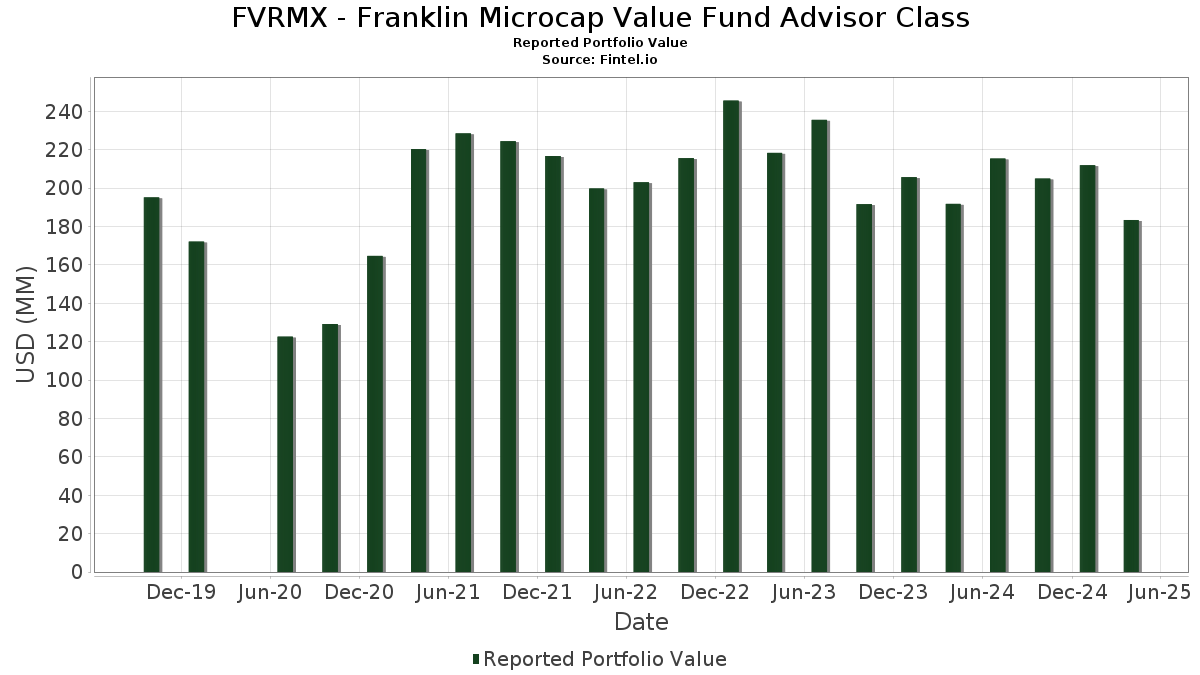
| Nilai Portfolio | $ 183,410,361 |
| Kedudukan Semasa | 64 |
Pegangan Terkini, Prestasi, AUM (dari 13F, 13D)
FVRMX - Franklin Microcap Value Fund Advisor Class telah mendedahkan 64 jumlah pegangan dalam pemfailan SEC terkini mereka. Nilai portfolio terkini dikira sebagai $ 183,410,361 USD. Aset Sebenar Di Bawah Pengurusan (AUM) ialah nilai ini ditambah dengan tunai (yang tidak didedahkan). Pegangan teratas FVRMX - Franklin Microcap Value Fund Advisor Class ialah The Hanover Insurance Group, Inc. (US:THG) , Steel Dynamics, Inc. (US:STLD) , The Gap, Inc. (US:GAP) , Sanmina Corporation (US:SANM) , and Chart Industries, Inc. (US:GTLS) . Kedudukan baharu FVRMX - Franklin Microcap Value Fund Advisor Class termasuk Avient Corporation (US:AVNT) , Apollo Global Management, Inc. (US:APO) , Dollar General Corporation (US:DG) , Citizens Financial Group, Inc. (US:CFG) , and Crocs, Inc. (US:CROX) .
Kenaikan Teratas Suku Tahun Ini
Kami menggunakan perubahan dalam peruntukan portfolio kerana ini adalah metrik yang paling bermakna. Perubahan boleh disebabkan oleh perdagangan atau perubahan dalam harga saham.
| Sekuriti | Saham (MM) |
Nilai (MM$) |
Portfolio % | ΔPortfolio % |
|---|---|---|---|---|
| 0.13 | 4.40 | 2.4083 | 2.4083 | |
| 0.02 | 2.80 | 1.5306 | 1.5306 | |
| 0.03 | 3.68 | 2.0165 | 1.5244 | |
| 0.02 | 2.30 | 1.2589 | 1.2589 | |
| 0.06 | 2.28 | 1.2492 | 1.2492 | |
| 0.80 | 4.23 | 2.3158 | 1.0000 | |
| 0.10 | 3.67 | 2.0112 | 0.9847 | |
| 0.04 | 4.48 | 2.4504 | 0.9570 | |
| 0.02 | 2.10 | 1.1511 | 0.8996 | |
| 0.08 | 2.36 | 1.2944 | 0.7907 |
Penurunan Teratas Suku Tahun Ini
Kami menggunakan perubahan dalam peruntukan portfolio kerana ini adalah metrik yang paling bermakna. Perubahan boleh disebabkan oleh perdagangan atau perubahan dalam harga saham.
| Sekuriti | Saham (MM) |
Nilai (MM$) |
Portfolio % | ΔPortfolio % |
|---|---|---|---|---|
| 0.02 | 1.69 | 0.9263 | -1.4376 | |
| 0.00 | 0.33 | 0.1817 | -1.1286 | |
| 0.03 | 1.20 | 0.6570 | -1.1007 | |
| 0.01 | 1.11 | 0.6102 | -1.0634 | |
| 0.06 | 2.03 | 1.1133 | -0.9870 | |
| 0.00 | 0.00 | -0.9838 | ||
| 0.07 | 4.42 | 2.4170 | -0.7055 | |
| 0.09 | 3.25 | 1.7795 | -0.7028 | |
| 0.20 | 1.18 | 0.6473 | -0.6969 | |
| 2.84 | 2.84 | 1.5529 | -0.6693 |
13F dan Pemfailan Dana
Borang ini telah difailkan pada 2025-06-24 untuk tempoh pelaporan 2025-04-30. Klik ikon pautan untuk melihat sejarah transaksi penuh.
Tingkatkan untuk membuka data premium dan eksport ke Excel ![]() .
.
| Sekuriti | Jenis | Purata Harga Saham | Saham (MM) |
ΔSaham (%) |
ΔSaham (%) |
Nilai ($MM) |
Portfolio (%) |
ΔPortfolio (%) |
|
|---|---|---|---|---|---|---|---|---|---|
| THG / The Hanover Insurance Group, Inc. | 0.03 | -8.83 | 5.40 | -1.08 | 2.9538 | 0.3844 | |||
| STLD / Steel Dynamics, Inc. | 0.04 | 0.00 | 5.38 | 1.17 | 2.9471 | 0.4408 | |||
| GAP / The Gap, Inc. | 0.24 | 10.34 | 5.26 | 0.38 | 2.8796 | 0.4114 | |||
| SANM / Sanmina Corporation | 0.07 | 5.02 | 5.26 | -3.68 | 2.8778 | 0.3067 | |||
| GTLS / Chart Industries, Inc. | 0.04 | 19.78 | 4.77 | -23.59 | 2.6108 | -0.3292 | |||
| ACIW / ACI Worldwide, Inc. | 0.09 | -27.09 | 4.58 | -27.35 | 2.5055 | -0.4620 | |||
| VCTR / Victory Capital Holdings, Inc. | 0.08 | 0.00 | 4.56 | -13.44 | 2.4939 | 0.0150 | |||
| VMI / Valmont Industries, Inc. | 0.02 | -9.14 | 4.55 | -19.68 | 2.4885 | -0.1778 | |||
| DCO / Ducommun Incorporated | 0.08 | 0.00 | 4.50 | -16.17 | 2.4629 | -0.0652 | |||
| FERG / Ferguson Enterprises Inc. | 0.03 | 0.00 | 4.49 | -6.32 | 2.4580 | 0.2001 | |||
| ZBH / Zimmer Biomet Holdings, Inc. | 0.04 | 49.99 | 4.48 | 41.20 | 2.4504 | 0.9570 | |||
| HSIC / Henry Schein, Inc. | 0.07 | -17.99 | 4.42 | -33.40 | 2.4170 | -0.7055 | |||
| AVNT / Avient Corporation | 0.13 | 4.40 | 2.4083 | 2.4083 | |||||
| QY6 / QinetiQ Group plc | 0.80 | 32.08 | 4.23 | 51.45 | 2.3158 | 1.0000 | |||
| CMC / Commercial Metals Company | 0.09 | 40.36 | 4.22 | 28.95 | 2.3120 | 0.7690 | |||
| WSC / WillScot Holdings Corporation | 0.16 | 9.12 | 4.09 | -26.05 | 2.2366 | -0.3655 | |||
| SSB / SouthState Corporation | 0.05 | 39.43 | 4.00 | 14.59 | 2.1883 | 0.5452 | |||
| NVST / Envista Holdings Corporation | 0.24 | 9.98 | 3.91 | -13.83 | 2.1425 | 0.0035 | |||
| FIBK / First Interstate BancSystem, Inc. | 0.14 | 41.84 | 3.77 | 12.78 | 2.0627 | 0.4888 | |||
| COLB / Columbia Banking System, Inc. | 0.17 | 44.14 | 3.72 | 15.85 | 2.0370 | 0.5238 | |||
| IDA / IDACORP, Inc. | 0.03 | 228.23 | 3.68 | 252.78 | 2.0165 | 1.5244 | |||
| PPL / PPL Corporation | 0.10 | 55.19 | 3.67 | 68.61 | 2.0112 | 0.9847 | |||
| MHK / Mohawk Industries, Inc. | 0.03 | 15.10 | 3.67 | 0.08 | 2.0072 | 0.2816 | |||
| UFPI / UFP Industries, Inc. | 0.04 | 32.27 | 3.61 | 13.06 | 1.9765 | 0.4722 | |||
| MAT / Mattel, Inc. | 0.23 | -16.93 | 3.60 | -29.18 | 1.9728 | -0.4243 | |||
| JCI / Johnson Controls International plc | 0.04 | 0.00 | 3.57 | 7.57 | 1.9533 | 0.3908 | |||
| MGRC / McGrath RentCorp | 0.03 | -17.85 | 3.43 | -28.57 | 1.8782 | -0.3843 | |||
| BKR / Baker Hughes Company | 0.09 | -19.53 | 3.25 | -38.33 | 1.7795 | -0.7028 | |||
| CNO / CNO Financial Group, Inc. | 0.08 | 0.00 | 2.98 | -5.01 | 1.6307 | 0.1536 | |||
| MTRX / Matrix Service Company | 0.26 | 47.86 | 2.97 | 26.51 | 1.6248 | 0.5195 | |||
| INFXX / Institutional Fiduciary Trust - Institutional Fiduciary Trust Money Market Portfolio | 2.84 | -39.87 | 2.84 | -39.88 | 1.5529 | -0.6693 | |||
| APO / Apollo Global Management, Inc. | 0.02 | 2.80 | 1.5306 | 1.5306 | |||||
| AUB / Atlantic Union Bankshares Corporation | 0.10 | 11.91 | 2.67 | -17.91 | 1.4600 | -0.0706 | |||
| CHTR / Charter Communications, Inc. | 0.01 | 0.00 | 2.50 | 13.45 | 1.3670 | 0.3300 | |||
| BBWI / Bath & Body Works, Inc. | 0.08 | 172.59 | 2.36 | 121.14 | 1.2944 | 0.7907 | |||
| DG / Dollar General Corporation | 0.02 | 2.30 | 1.2589 | 1.2589 | |||||
| CFG / Citizens Financial Group, Inc. | 0.06 | 2.28 | 1.2492 | 1.2492 | |||||
| KNX / Knight-Swift Transportation Holdings Inc. | 0.06 | -15.70 | 2.25 | -42.17 | 1.2331 | -0.6013 | |||
| MWA / Mueller Water Products, Inc. | 0.08 | -32.74 | 2.17 | -23.27 | 1.1860 | -0.1440 | |||
| MIDD / The Middleby Corporation | 0.02 | 405.29 | 2.10 | 293.63 | 1.1511 | 0.8996 | |||
| ADS / Bread Financial Holdings Inc | 0.04 | 20.41 | 2.04 | -9.77 | 1.1168 | 0.0516 | |||
| HGV / Hilton Grand Vacations Inc. | 0.06 | -44.13 | 2.03 | -54.41 | 1.1133 | -0.9870 | |||
| AROW / Arrow Financial Corporation | 0.08 | 44.95 | 2.02 | 33.66 | 1.1044 | 0.3932 | |||
| GTES / Gates Industrial Corporation plc | 0.11 | 0.00 | 2.01 | -8.54 | 1.1025 | 0.0651 | |||
| NBN / Northeast Bank | 0.02 | -7.74 | 1.98 | -24.50 | 1.0847 | -0.1514 | |||
| DKS / DICK'S Sporting Goods, Inc. | 0.01 | -21.49 | 1.98 | -38.62 | 1.0838 | -0.4349 | |||
| SMBC / Southern Missouri Bancorp, Inc. | 0.04 | 0.00 | 1.98 | -11.07 | 1.0822 | 0.0355 | |||
| BCKIF / Babcock International Group PLC | 0.17 | -40.70 | 1.85 | -4.24 | 1.0134 | 0.1029 | |||
| BRX / Brixmor Property Group Inc. | 0.07 | -17.97 | 1.84 | -21.60 | 1.0099 | -0.0984 | |||
| CABO / Cable One, Inc. | 0.01 | 0.00 | 1.73 | -12.08 | 0.9447 | 0.0201 | |||
| FBIZ / First Business Financial Services, Inc. | 0.04 | 0.00 | 1.71 | -6.85 | 0.9386 | 0.0719 | |||
| MKSI / MKS Inc. | 0.02 | -45.54 | 1.69 | -66.28 | 0.9263 | -1.4376 | |||
| LBRT / Liberty Energy Inc. | 0.12 | 0.00 | 1.39 | -37.18 | 0.7631 | -0.2824 | |||
| VOYA / Voya Financial, Inc. | 0.02 | 0.00 | 1.39 | -16.64 | 0.7629 | -0.0243 | |||
| MHO / M/I Homes, Inc. | 0.01 | 21.19 | 1.31 | 2.83 | 0.7171 | 0.1167 | |||
| BYD / Boyd Gaming Corporation | 0.02 | 0.00 | 1.27 | -9.79 | 0.6958 | 0.0321 | |||
| FLEX / Flex Ltd. | 0.03 | -60.99 | 1.20 | -67.84 | 0.6570 | -1.1007 | |||
| VRN / Veren Inc. | 0.20 | -64.74 | 1.18 | -58.57 | 0.6473 | -0.6969 | |||
| GPN / Global Payments Inc. | 0.01 | -53.61 | 1.11 | -68.65 | 0.6102 | -1.0634 | |||
| SBAC / SBA Communications Corporation | 0.00 | -42.85 | 0.77 | -29.54 | 0.4232 | -0.0939 | |||
| STAG / STAG Industrial, Inc. | 0.02 | 0.00 | 0.66 | -3.24 | 0.3602 | 0.0395 | |||
| CROX / Crocs, Inc. | 0.01 | 0.65 | 0.3570 | 0.3570 | |||||
| RXO / RXO, Inc. | 0.04 | -36.22 | 0.59 | -64.97 | 0.3204 | -0.4665 | |||
| US7587501039 / Regal-Beloit Corp. | 0.00 | -82.10 | 0.33 | -88.07 | 0.1817 | -1.1286 | |||
| GPC / Genuine Parts Company | 0.00 | -100.00 | 0.00 | -100.00 | -0.9838 |