Statistik Asas
| Nilai Portfolio | $ 71,286,732 |
| Kedudukan Semasa | 47 |
Pegangan Terkini, Prestasi, AUM (dari 13F, 13D)
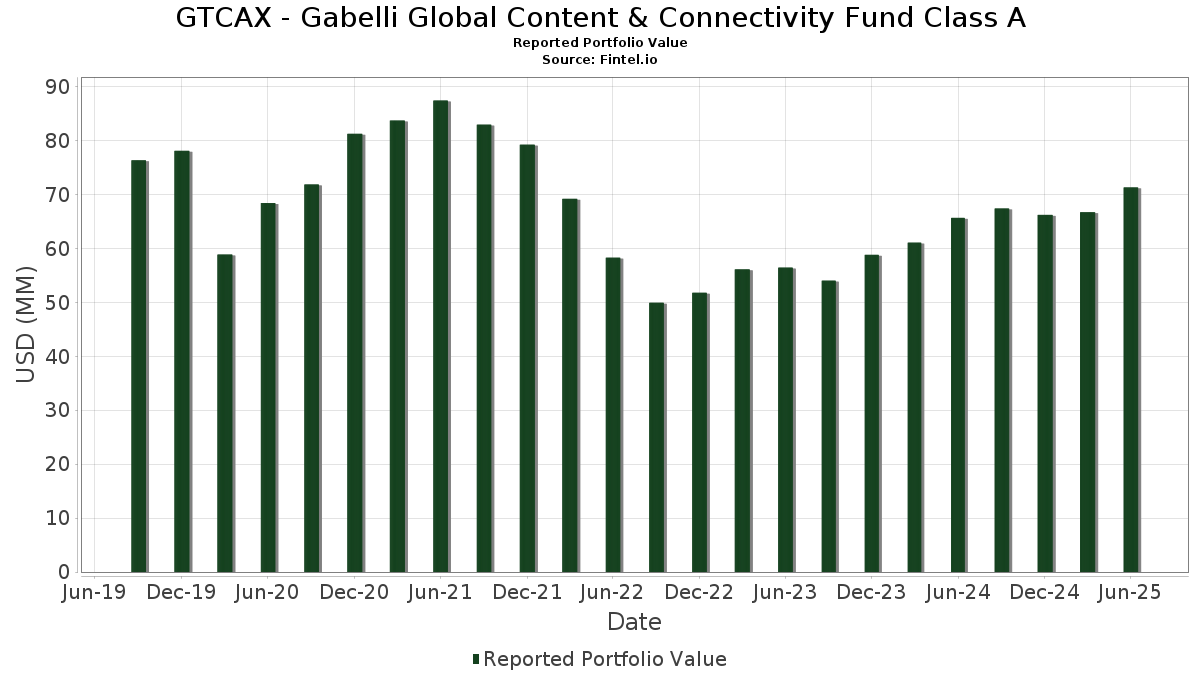
GTCAX - Gabelli Global Content & Connectivity Fund Class A telah mendedahkan 47 jumlah pegangan dalam pemfailan SEC terkini mereka. Nilai portfolio terkini dikira sebagai $ 71,286,732 USD. Aset Sebenar Di Bawah Pengurusan (AUM) ialah nilai ini ditambah dengan tunai (yang tidak didedahkan). Pegangan teratas GTCAX - Gabelli Global Content & Connectivity Fund Class A ialah SoftBank Group Corp. (DE:SFT) , T-Mobile US, Inc. (US:TMUS) , Meta Platforms, Inc. (US:META) , Prosus N.V. (NL:PRX) , and Alphabet Inc. (US:GOOG) .
Kenaikan Teratas Suku Tahun Ini
Kami menggunakan perubahan dalam peruntukan portfolio kerana ini adalah metrik yang paling bermakna. Perubahan boleh disebabkan oleh perdagangan atau perubahan dalam harga saham.
| Sekuriti | Saham (MM) |
Nilai (MM$) |
Portfolio % | ΔPortfolio % |
|---|---|---|---|---|
| 0.07 | 5.40 | 7.5835 | 2.0509 | |
| 0.01 | 2.98 | 4.1886 | 0.8115 | |
| 0.01 | 5.17 | 7.2512 | 0.7699 | |
| 0.08 | 4.47 | 6.2783 | 0.7562 | |
| 0.08 | 3.00 | 4.2070 | 0.5762 | |
| 0.01 | 1.32 | 1.8474 | 0.4211 | |
| 0.07 | 1.16 | 1.6247 | 0.3490 | |
| 0.17 | 1.46 | 2.0482 | 0.3145 | |
| 0.03 | 0.78 | 1.0976 | 0.1942 | |
| 0.04 | 0.63 | 0.8812 | 0.1350 |
Penurunan Teratas Suku Tahun Ini
Kami menggunakan perubahan dalam peruntukan portfolio kerana ini adalah metrik yang paling bermakna. Perubahan boleh disebabkan oleh perdagangan atau perubahan dalam harga saham.
| Sekuriti | Saham (MM) |
Nilai (MM$) |
Portfolio % | ΔPortfolio % |
|---|---|---|---|---|
| 0.02 | 5.36 | 7.5238 | -1.8738 | |
| 0.07 | 1.67 | 2.3399 | -0.6783 | |
| 0.07 | 2.67 | 3.7452 | -0.6113 | |
| 0.04 | 2.56 | 3.5912 | -0.5561 | |
| 0.11 | 4.01 | 5.6320 | -0.4708 | |
| 0.00 | 0.90 | 1.2619 | -0.3818 | |
| 0.06 | 0.57 | 0.7958 | -0.3707 | |
| 0.00 | 0.92 | 1.2958 | -0.3695 | |
| 0.03 | 1.07 | 1.5027 | -0.2678 | |
| 0.06 | 1.78 | 2.4976 | -0.1876 |
13F dan Pemfailan Dana
Borang ini telah difailkan pada 2025-08-29 untuk tempoh pelaporan 2025-06-30. Klik ikon pautan untuk melihat sejarah transaksi penuh.
Tingkatkan untuk membuka data premium dan eksport ke Excel ![]() .
.
| Sekuriti | Jenis | Purata Harga Saham | Saham (MM) |
ΔSaham (%) |
ΔSaham (%) |
Nilai ($MM) |
Portfolio (%) |
ΔPortfolio (%) |
|
|---|---|---|---|---|---|---|---|---|---|
| SFT / SoftBank Group Corp. | 0.07 | 0.00 | 5.40 | 46.46 | 7.5835 | 2.0509 | |||
| TMUS / T-Mobile US, Inc. | 0.02 | -4.26 | 5.36 | -14.47 | 7.5238 | -1.8738 | |||
| META / Meta Platforms, Inc. | 0.01 | -6.67 | 5.17 | 19.53 | 7.2512 | 0.7699 | |||
| PRX / Prosus N.V. | 0.08 | 0.00 | 4.47 | 21.48 | 6.2783 | 0.7562 | |||
| GOOG / Alphabet Inc. | 0.02 | -6.12 | 4.08 | 6.58 | 5.7261 | -0.0129 | |||
| DTE / Deutsche Telekom AG | 0.11 | 0.00 | 4.01 | -1.43 | 5.6320 | -0.4708 | |||
| MIICF / Millicom International Cellular SA | 0.08 | 0.00 | 3.00 | 23.79 | 4.2070 | 0.5762 | |||
| MSFT / Microsoft Corporation | 0.01 | 0.00 | 2.98 | 32.50 | 4.1886 | 0.8115 | |||
| TDS / Telephone and Data Systems, Inc. | 0.07 | 0.00 | 2.67 | -8.16 | 3.7452 | -0.6113 | |||
| USM / United States Cellular Corporation | 0.04 | 0.00 | 2.56 | -7.52 | 3.5912 | -0.5561 | |||
| FYBR / Frontier Communications Parent, Inc. | 0.07 | 0.00 | 2.37 | 1.55 | 3.3206 | -0.1743 | |||
| RCI / Rogers Communications Inc. | 0.06 | -10.45 | 1.78 | -0.61 | 2.4976 | -0.1876 | |||
| ATEX / Anterix Inc. | 0.07 | 18.18 | 1.67 | -17.19 | 2.3399 | -0.6783 | |||
| FR0000039299 / Bollore SE | 0.24 | 0.00 | 1.51 | 7.49 | 2.1148 | 0.0136 | |||
| T / AT&T Inc. | 0.05 | 4.00 | 1.50 | 6.36 | 2.1121 | -0.0081 | |||
| KINVB / Kinnevik AB | 0.17 | 0.00 | 1.46 | 26.21 | 2.0482 | 0.3145 | |||
| AMZN / Amazon.com, Inc. | 0.01 | 20.00 | 1.32 | 38.38 | 1.8474 | 0.4211 | |||
| MANU / Manchester United plc | 0.07 | 0.00 | 1.16 | 36.12 | 1.6247 | 0.3490 | |||
| ZAL / Zalando SE | 0.04 | 0.00 | 1.15 | -4.08 | 1.6173 | -0.1849 | |||
| SUNN / Sunrise Communications AG | 0.02 | 0.00 | 1.13 | 16.79 | 1.5820 | 0.1347 | |||
| EQIX / Equinix, Inc. | 0.00 | 0.00 | 1.11 | -2.45 | 1.5630 | -0.1485 | |||
| CMCSA / Comcast Corporation | 0.03 | -6.25 | 1.07 | -9.32 | 1.5027 | -0.2678 | |||
| SONY / Sony Group Corporation - Depositary Receipt (Common Stock) | 0.04 | -3.53 | 1.07 | -1.11 | 1.4978 | -0.1201 | |||
| 82K / VNV Global AB (publ) | 0.55 | 0.00 | 0.99 | 7.14 | 1.3903 | 0.0046 | |||
| AAPL / Apple Inc. | 0.00 | -10.00 | 0.92 | -16.85 | 1.2958 | -0.3695 | |||
| VOD / Vodafone Group Public Limited Company - Depositary Receipt (Common Stock) | 0.09 | 0.00 | 0.91 | 13.82 | 1.2717 | 0.0775 | |||
| MA / Mastercard Incorporated | 0.00 | -20.00 | 0.90 | -17.97 | 1.2619 | -0.3818 | |||
| AMT / American Tower Corporation | 0.00 | 0.00 | 0.88 | 1.61 | 1.2408 | -0.0643 | |||
| LL6 / MTN Group Limited | 0.11 | 0.00 | 0.88 | 18.40 | 1.2282 | 0.1197 | |||
| VZ / Verizon Communications Inc. | 0.02 | 0.00 | 0.87 | -4.63 | 1.2146 | -0.1457 | |||
| TSAT / Telesat Corporation | 0.03 | 0.00 | 0.78 | 29.90 | 1.0976 | 0.1942 | |||
| PYPL / PayPal Holdings, Inc. | 0.01 | -16.67 | 0.74 | -5.11 | 1.0431 | -0.1309 | |||
| TU / TELUS Corporation | 0.04 | 0.00 | 0.69 | 12.01 | 0.9692 | 0.0447 | |||
| AMX / América Móvil, S.A.B. de C.V. - Depositary Receipt (Common Stock) | 0.04 | 0.00 | 0.63 | 26.16 | 0.8812 | 0.1350 | |||
| DIS / The Walt Disney Company | 0.01 | 0.00 | 0.62 | 25.76 | 0.8702 | 0.1303 | |||
| BATRK / Atlanta Braves Holdings, Inc. | 0.01 | 0.00 | 0.61 | 16.92 | 0.8533 | 0.0735 | |||
| LBTYA / Liberty Global Ltd. | 0.06 | -15.38 | 0.57 | -27.12 | 0.7958 | -0.3707 | |||
| TEQ / Telenor ASA | 0.03 | 0.00 | 0.50 | 8.75 | 0.6982 | 0.0119 | |||
| CCI / Crown Castle Inc. | 0.00 | 0.00 | 0.46 | -1.49 | 0.6488 | -0.0545 | |||
| 05935 / Samsung Electronics Co Ltd | 0.01 | 0.00 | 0.44 | 14.58 | 0.6177 | 0.0410 | |||
| DIP / KDDI Corporation | 0.02 | 0.00 | 0.34 | 9.55 | 0.4834 | 0.0117 | |||
| WOW / WideOpenWest, Inc. | 0.07 | 0.00 | 0.26 | -18.07 | 0.3704 | -0.1120 | |||
| TV / Grupo Televisa, S.A.B. - Depositary Receipt (Common Stock) | 0.10 | 0.00 | 0.22 | 25.14 | 0.3074 | 0.0450 | |||
| CWJ / Cable & Wireless Jamaica Ltd | 37.42 | 0.00 | 0.07 | -51.09 | 0.0949 | -0.1110 | |||
| Altaba Inc Escrow / EC (000000000) | 0.01 | 0.01 | 0.0110 | 0.0110 | |||||
| WIHL / WATERLOO INVESTMENT HOLDINGS | 0.01 | 0.00 | 0.01 | 0.00 | 0.0084 | -0.0006 | |||
| 2KS / Old Mutual Limited | 0.00 | 0.00 | 0.00 | 0.0000 | -0.0000 |