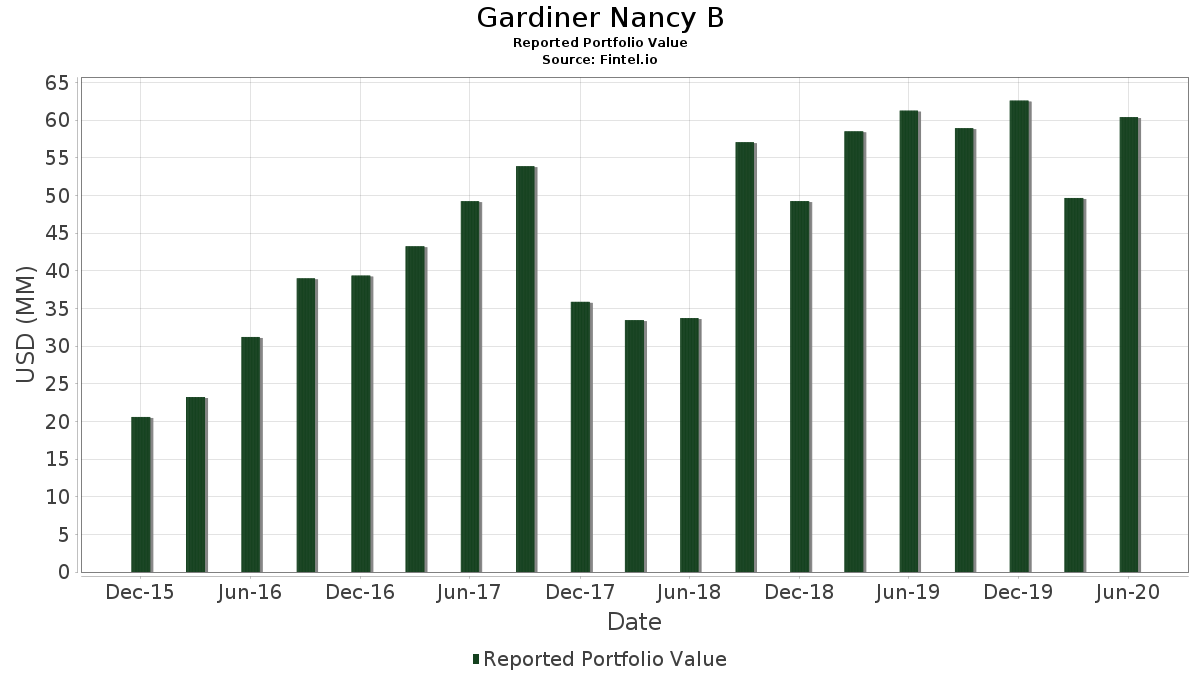
Statistik Asas
| Nilai Portfolio | $ 60,399,000 |
| Kedudukan Semasa | 64 |
Pegangan Terkini, Prestasi, AUM (dari 13F, 13D)
Gardiner Nancy B telah mendedahkan 64 jumlah pegangan dalam pemfailan SEC terkini mereka. Nilai portfolio terkini dikira sebagai $ 60,399,000 USD. Aset Sebenar Di Bawah Pengurusan (AUM) ialah nilai ini ditambah dengan tunai (yang tidak didedahkan). Pegangan teratas Gardiner Nancy B ialah Apple Inc. (US:AAPL) , Amazon.com, Inc. (US:AMZN) , Automatic Data Processing, Inc. (US:ADP) , Alphabet Inc. (US:GOOGL) , and The Procter & Gamble Company (US:PG) . Kedudukan baharu Gardiner Nancy B termasuk UnitedHealth Group Incorporated (US:UNH) , iShares Trust - iShares Core S&P 500 ETF (US:IVV) , .
Kenaikan Teratas Suku Tahun Ini
Kami menggunakan perubahan dalam peruntukan portfolio kerana ini adalah metrik yang paling bermakna. Perubahan boleh disebabkan oleh perdagangan atau perubahan dalam harga saham.
| Sekuriti | Saham (MM) |
Nilai (MM$) |
Portfolio % | ΔPortfolio % |
|---|---|---|---|---|
| 0.01 | 1.62 | 2.6789 | 1.0215 | |
| 0.01 | 3.38 | 5.6044 | 0.8057 | |
| 0.00 | 2.58 | 4.2699 | 0.6211 | |
| 0.00 | 0.36 | 0.5977 | 0.5977 | |
| 0.00 | 0.66 | 1.0861 | 0.4316 | |
| 0.00 | 0.24 | 0.3940 | 0.3940 | |
| 0.01 | 1.77 | 2.9272 | 0.3677 | |
| 0.00 | 0.22 | 0.3576 | 0.3576 | |
| 0.01 | 1.35 | 2.2302 | 0.2728 | |
| 0.00 | 0.94 | 1.5563 | 0.2132 |
Penurunan Teratas Suku Tahun Ini
Kami menggunakan perubahan dalam peruntukan portfolio kerana ini adalah metrik yang paling bermakna. Perubahan boleh disebabkan oleh perdagangan atau perubahan dalam harga saham.
| Sekuriti | Saham (MM) |
Nilai (MM$) |
Portfolio % | ΔPortfolio % |
|---|---|---|---|---|
| 0.01 | 0.43 | 0.7053 | -0.8453 | |
| 0.00 | 0.00 | -0.4350 | ||
| 0.01 | 1.33 | 2.2037 | -0.4142 | |
| 0.01 | 2.22 | 3.6822 | -0.4037 | |
| 0.02 | 1.92 | 3.1706 | -0.4018 | |
| 0.01 | 1.63 | 2.6954 | -0.3675 | |
| 0.03 | 1.74 | 2.8726 | -0.3273 | |
| 0.01 | 1.59 | 2.6292 | -0.3189 | |
| 0.02 | 1.38 | 2.2914 | -0.2821 | |
| 0.02 | 1.32 | 2.1788 | -0.2336 |
13F dan Pemfailan Dana
Borang ini telah difailkan pada 2020-07-28 untuk tempoh pelaporan 2020-06-30. Klik ikon pautan untuk melihat sejarah transaksi penuh.
Tingkatkan untuk membuka data premium dan eksport ke Excel ![]() .
.
| Sekuriti | Jenis | Purata Harga Saham | Saham (MM) |
ΔSaham (%) |
ΔSaham (%) |
Nilai ($MM) |
Portfolio (%) |
ΔPortfolio (%) |
|
|---|---|---|---|---|---|---|---|---|---|
| AAPL / Apple Inc. | 0.01 | -0.91 | 3.38 | 42.05 | 5.6044 | 0.8057 | |||
| AMZN / Amazon.com, Inc. | 0.00 | 0.54 | 2.58 | 42.33 | 4.2699 | 0.6211 | |||
| ADP / Automatic Data Processing, Inc. | 0.01 | 0.57 | 2.22 | 9.61 | 3.6822 | -0.4037 | |||
| GOOGL / Alphabet Inc. | 0.00 | -0.07 | 2.07 | 22.02 | 3.4222 | 0.0110 | |||
| PG / The Procter & Gamble Company | 0.02 | -0.81 | 1.92 | 7.95 | 3.1706 | -0.4018 | |||
| CNI / Canadian National Railway Company | 0.02 | 2.89 | 1.78 | 17.49 | 2.9471 | -0.1037 | |||
| HD / The Home Depot, Inc. | 0.01 | 3.68 | 1.77 | 39.10 | 2.9272 | 0.3677 | |||
| UL / Unilever PLC - Depositary Receipt (Common Stock) | 0.03 | 0.59 | 1.74 | 9.19 | 2.8726 | -0.3273 | |||
| MA / Mastercard Incorporated | 0.01 | -1.20 | 1.73 | 21.05 | 2.8659 | -0.0137 | |||
| NSRGY / Nestlé S.A. - Depositary Receipt (Common Stock) | 0.01 | -0.30 | 1.63 | 7.03 | 2.6954 | -0.3675 | |||
| PYPL / PayPal Holdings, Inc. | 0.01 | 8.06 | 1.62 | 96.60 | 2.6789 | 1.0215 | |||
| JNJ / Johnson & Johnson | 0.01 | 1.25 | 1.59 | 8.47 | 2.6292 | -0.3189 | |||
| ATR / AptarGroup, Inc. | 0.01 | 0.12 | 1.43 | 12.84 | 2.3709 | -0.1845 | |||
| NVS / Novartis AG - Depositary Receipt (Common Stock) | 0.02 | 2.19 | 1.38 | 8.29 | 2.2914 | -0.2821 | |||
| DIS / The Walt Disney Company | 0.01 | 8.54 | 1.35 | 25.42 | 2.2384 | 0.0676 | |||
| MSFT / Microsoft Corporation | 0.01 | 7.38 | 1.35 | 38.58 | 2.2302 | 0.2728 | |||
| FISV / Fiserv, Inc. | 0.01 | -0.37 | 1.33 | 2.38 | 2.2037 | -0.4142 | |||
| INTC / Intel Corporation | 0.02 | -0.68 | 1.32 | 9.85 | 2.1788 | -0.2336 | |||
| NVZMF / Novozymes A/S | 0.02 | 0.00 | 1.29 | 26.52 | 2.1325 | 0.0825 | |||
| DHR / Danaher Corporation | 0.01 | -0.56 | 1.26 | 27.02 | 2.0861 | 0.0885 | |||
| XLNX / Xilinx, Inc. | 0.01 | 1.66 | 1.22 | 28.12 | 2.0216 | 0.1025 | |||
| BDX / Becton, Dickinson and Company | 0.01 | 5.57 | 1.21 | 10.00 | 2.0033 | -0.2118 | |||
| ABT / Abbott Laboratories | 0.01 | -0.28 | 1.12 | 15.50 | 1.8626 | -0.0988 | |||
| V / Visa Inc. | 0.01 | 0.00 | 1.10 | 19.91 | 1.8146 | -0.0260 | |||
| ADBE / Adobe Inc. | 0.00 | 0.00 | 1.06 | 36.87 | 1.7517 | 0.1951 | |||
| ADI / Analog Devices, Inc. | 0.01 | 0.83 | 1.04 | 38.08 | 1.7169 | 0.2046 | |||
| ILMN / Illumina, Inc. | 0.00 | 3.68 | 0.94 | 40.93 | 1.5563 | 0.2132 | |||
| COST / Costco Wholesale Corporation | 0.00 | 0.00 | 0.82 | 6.39 | 1.3510 | -0.1935 | |||
| APD / Air Products and Chemicals, Inc. | 0.00 | 0.00 | 0.76 | 20.99 | 1.2500 | -0.0065 | |||
| CVS / CVS Health Corporation | 0.01 | 3.85 | 0.70 | 13.80 | 1.1606 | -0.0798 | |||
| MMM / 3M Company | 0.00 | -2.74 | 0.69 | 10.91 | 1.1441 | -0.1105 | |||
| TJX / The TJX Companies, Inc. | 0.01 | 14.51 | 0.69 | 20.99 | 1.1358 | -0.0060 | |||
| ROK / Rockwell Automation, Inc. | 0.00 | -7.23 | 0.68 | 30.84 | 1.1308 | 0.0796 | |||
| ECL / Ecolab Inc. | 0.00 | 0.00 | 0.67 | 27.67 | 1.1076 | 0.0524 | |||
| DOGEF / Ørsted A/S | 0.01 | 0.00 | 0.67 | 16.96 | 1.1076 | -0.0442 | |||
| GOOG / Alphabet Inc. | 0.00 | 0.00 | 0.67 | 21.53 | 1.1027 | -0.0009 | |||
| MELI / MercadoLibre, Inc. | 0.00 | 0.00 | 0.66 | 101.85 | 1.0861 | 0.4316 | |||
| CB / Chubb Limited | 0.01 | 0.00 | 0.66 | 13.49 | 1.0861 | -0.0778 | |||
| PGR / The Progressive Corporation | 0.01 | 0.00 | 0.60 | 8.48 | 0.9950 | -0.1206 | |||
| PEP / PepsiCo, Inc. | 0.00 | 0.00 | 0.60 | 10.33 | 0.9901 | -0.1014 | |||
| MKC / McCormick & Company, Incorporated | 0.00 | 0.00 | 0.55 | 26.96 | 0.9123 | 0.0383 | |||
| META / Meta Platforms, Inc. | 0.00 | 0.00 | 0.55 | 36.25 | 0.9023 | 0.0968 | |||
| ABBV / AbbVie Inc. | 0.01 | 0.00 | 0.53 | 28.78 | 0.8742 | 0.0486 | |||
| CMCSA / Comcast Corporation | 0.01 | 0.00 | 0.53 | 13.36 | 0.8709 | -0.0635 | |||
| CSCO / Cisco Systems, Inc. | 0.01 | -3.51 | 0.51 | 14.51 | 0.8494 | -0.0528 | |||
| AZN / AstraZeneca PLC - Depositary Receipt (Common Stock) | 0.00 | 0.00 | 0.50 | 28.87 | 0.8278 | 0.0465 | |||
| XYL / Xylem Inc. | 0.01 | 2.28 | 0.47 | 1.74 | 0.7732 | -0.1511 | |||
| FDS / FactSet Research Systems Inc. | 0.00 | 0.00 | 0.44 | 25.85 | 0.7335 | 0.0246 | |||
| RTX / RTX Corporation | 0.01 | -15.49 | 0.43 | -44.68 | 0.7053 | -0.8453 | |||
| RHHBY / Roche Holding AG - Depositary Receipt (Common Stock) | 0.01 | 0.00 | 0.42 | 6.85 | 0.6970 | -0.0964 | |||
| CVX / Chevron Corporation | 0.00 | 2.75 | 0.42 | 26.75 | 0.6904 | 0.0279 | |||
| SBUX / Starbucks Corporation | 0.01 | 0.00 | 0.41 | 11.88 | 0.6705 | -0.0584 | |||
| UNH / UnitedHealth Group Incorporated | 0.00 | 0.36 | 0.5977 | 0.5977 | |||||
| EMR / Emerson Electric Co. | 0.01 | 0.00 | 0.35 | 29.96 | 0.5745 | 0.0368 | |||
| DE / Deere & Company | 0.00 | 0.00 | 0.34 | 13.42 | 0.5596 | -0.0405 | |||
| NVO / Novo Nordisk A/S - Depositary Receipt (Common Stock) | 0.00 | 0.00 | 0.31 | 8.74 | 0.5149 | -0.0610 | |||
| SJM / The J. M. Smucker Company | 0.00 | 0.00 | 0.30 | -5.05 | 0.4984 | -0.1400 | |||
| FDX / FedEx Corporation | 0.00 | 0.00 | 0.28 | 15.23 | 0.4636 | -0.0258 | |||
| UNP / Union Pacific Corporation | 0.00 | 0.00 | 0.28 | 20.09 | 0.4553 | -0.0058 | |||
| FTV / Fortive Corporation | 0.00 | -5.88 | 0.27 | 15.32 | 0.4487 | -0.0245 | |||
| ORA / Ormat Technologies, Inc. | 0.00 | 6.96 | 0.24 | 0.83 | 0.4040 | -0.0833 | |||
| STT / State Street Corporation | 0.00 | 0.24 | 0.3940 | 0.3940 | |||||
| IVV / iShares Trust - iShares Core S&P 500 ETF | 0.00 | 0.22 | 0.3576 | 0.3576 | |||||
| MRK / Merck & Co., Inc. | 0.00 | 0.00 | 0.21 | 0.47 | 0.3527 | -0.0743 | |||
| POR / Portland General Electric Company | 0.00 | -100.00 | 0.00 | -100.00 | -0.4350 |