Statistik Asas
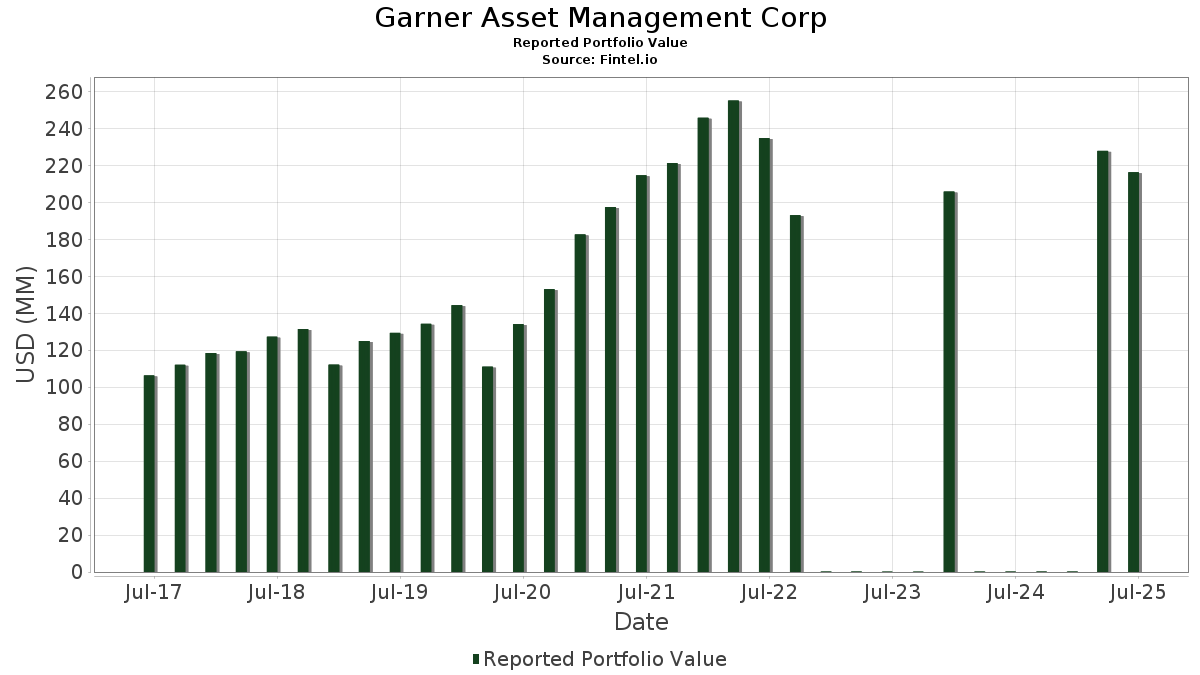
| Nilai Portfolio | $ 216,302,257 |
| Kedudukan Semasa | 148 |
Pegangan Terkini, Prestasi, AUM (dari 13F, 13D)
Garner Asset Management Corp telah mendedahkan 148 jumlah pegangan dalam pemfailan SEC terkini mereka. Nilai portfolio terkini dikira sebagai $ 216,302,257 USD. Aset Sebenar Di Bawah Pengurusan (AUM) ialah nilai ini ditambah dengan tunai (yang tidak didedahkan). Pegangan teratas Garner Asset Management Corp ialah Invesco QQQ Trust, Series 1 (US:QQQ) , Berkshire Hathaway Inc. (US:BRK.B) , NVIDIA Corporation (US:NVDA) , Apple Inc. (US:AAPL) , and Vanguard Index Funds - Vanguard Total Stock Market ETF (US:VTI) . Kedudukan baharu Garner Asset Management Corp termasuk Madison Square Garden Entertainment Corp. (US:MSGE) , .
Kenaikan Teratas Suku Tahun Ini
Kami menggunakan perubahan dalam peruntukan portfolio kerana ini adalah metrik yang paling bermakna. Perubahan boleh disebabkan oleh perdagangan atau perubahan dalam harga saham.
| Sekuriti | Saham (MM) |
Nilai (MM$) |
Portfolio % | ΔPortfolio % |
|---|---|---|---|---|
| 0.03 | 14.18 | 6.5576 | 1.2511 | |
| 0.05 | 7.97 | 3.6865 | 1.0519 | |
| 0.02 | 7.41 | 3.4262 | 0.9713 | |
| 0.02 | 4.22 | 1.9531 | 0.7019 | |
| 0.01 | 4.31 | 1.9927 | 0.4940 | |
| 0.08 | 1.15 | 0.5320 | 0.3198 | |
| 0.01 | 1.13 | 0.5230 | 0.2544 | |
| 0.02 | 5.16 | 2.3844 | 0.2497 | |
| 0.03 | 1.64 | 0.7593 | 0.2325 | |
| 0.02 | 3.26 | 1.5071 | 0.2295 |
Penurunan Teratas Suku Tahun Ini
Kami menggunakan perubahan dalam peruntukan portfolio kerana ini adalah metrik yang paling bermakna. Perubahan boleh disebabkan oleh perdagangan atau perubahan dalam harga saham.
| Sekuriti | Saham (MM) |
Nilai (MM$) |
Portfolio % | ΔPortfolio % |
|---|---|---|---|---|
| 0.02 | 3.47 | 1.6023 | -0.4177 | |
| 0.02 | 11.07 | 5.1186 | -0.3930 | |
| 0.04 | 7.54 | 3.4866 | -0.3914 | |
| 0.03 | 3.77 | 1.7418 | -0.3482 | |
| 0.06 | 2.91 | 1.3454 | -0.3227 | |
| 0.04 | 1.01 | 0.4670 | -0.3136 | |
| 0.02 | 0.43 | 0.1966 | -0.2759 | |
| 0.37 | 6.01 | 2.7788 | -0.2757 | |
| 0.01 | 0.71 | 0.3262 | -0.2734 | |
| 0.11 | 3.30 | 1.5279 | -0.2152 |
13F dan Pemfailan Dana
Borang ini telah difailkan pada 2025-08-13 untuk tempoh pelaporan 2025-06-30. Klik ikon pautan untuk melihat sejarah transaksi penuh.
Tingkatkan untuk membuka data premium dan eksport ke Excel ![]() .
.
| Sekuriti | Jenis | Purata Harga Saham | Saham (MM) |
ΔSaham (%) |
ΔSaham (%) |
Nilai ($MM) |
Portfolio (%) |
ΔPortfolio (%) |
|
|---|---|---|---|---|---|---|---|---|---|
| QQQ / Invesco QQQ Trust, Series 1 | 0.03 | -0.28 | 14.18 | 17.32 | 6.5576 | 1.2511 | |||
| BRK.B / Berkshire Hathaway Inc. | 0.02 | -3.34 | 11.07 | -11.84 | 5.1186 | -0.3930 | |||
| NVDA / NVIDIA Corporation | 0.05 | -8.88 | 7.97 | 32.83 | 3.6865 | 1.0519 | |||
| AAPL / Apple Inc. | 0.04 | -7.59 | 7.54 | -14.65 | 3.4866 | -0.3914 | |||
| VTI / Vanguard Index Funds - Vanguard Total Stock Market ETF | 0.02 | 19.81 | 7.41 | 32.49 | 3.4262 | 0.9713 | |||
| RMR / The RMR Group Inc. | 0.37 | -12.18 | 6.01 | -13.64 | 2.7788 | -0.2757 | |||
| AMZN / Amazon.com, Inc. | 0.02 | -8.04 | 5.16 | 6.05 | 2.3844 | 0.2497 | |||
| MSFT / Microsoft Corporation | 0.01 | -4.74 | 4.31 | 26.24 | 1.9927 | 0.4940 | |||
| AVGO / Broadcom Inc. | 0.02 | -9.99 | 4.22 | 48.21 | 1.9531 | 0.7019 | |||
| VZ / Verizon Communications Inc. | 0.09 | -9.52 | 3.80 | -13.70 | 1.7589 | -0.1757 | |||
| CVX / Chevron Corporation | 0.03 | -7.58 | 3.77 | -20.89 | 1.7418 | -0.3482 | |||
| COST / Costco Wholesale Corporation | 0.00 | -7.38 | 3.71 | -3.06 | 1.7163 | 0.0354 | |||
| KYN / Kayne Anderson Energy Infrastructure Fund, Inc. | 0.28 | -2.36 | 3.61 | -3.19 | 1.6691 | 0.0323 | |||
| WMT / Walmart Inc. | 0.04 | -15.67 | 3.58 | -6.08 | 1.6571 | -0.0178 | |||
| GOOG / Alphabet Inc. | 0.02 | -8.37 | 3.49 | 4.02 | 1.6151 | 0.1413 | |||
| RSP / Invesco Exchange-Traded Fund Trust - Invesco S&P 500 Equal Weight ETF | 0.02 | -28.23 | 3.47 | -24.71 | 1.6023 | -0.4177 | |||
| T / AT&T Inc. | 0.11 | -18.69 | 3.30 | -16.80 | 1.5279 | -0.2152 | |||
| AN / AutoNation, Inc. | 0.02 | -8.72 | 3.26 | 11.99 | 1.5071 | 0.2295 | |||
| CME / CME Group Inc. | 0.01 | -14.89 | 2.97 | -11.55 | 1.3732 | -0.1010 | |||
| IBM / International Business Machines Corporation | 0.01 | -13.82 | 2.96 | 2.18 | 1.3671 | 0.0969 | |||
| IP / International Paper Company | 0.06 | -12.77 | 2.91 | -23.42 | 1.3454 | -0.3227 | |||
| TRV / The Travelers Companies, Inc. | 0.01 | -14.53 | 2.88 | -13.54 | 1.3318 | -0.1305 | |||
| COP / ConocoPhillips | 0.03 | 9.94 | 2.57 | -6.03 | 1.1882 | -0.0124 | |||
| BLK / BlackRock, Inc. | 0.00 | -8.09 | 2.37 | 1.89 | 1.0963 | 0.0749 | |||
| DELL / Dell Technologies Inc. | 0.02 | -12.58 | 2.28 | 17.62 | 1.0524 | 0.2028 | |||
| AMAT / Applied Materials, Inc. | 0.01 | -6.37 | 2.14 | 18.10 | 0.9898 | 0.1942 | |||
| GLW / Corning Incorporated | 0.04 | -13.96 | 2.10 | -1.13 | 0.9723 | 0.0384 | |||
| WM / Waste Management, Inc. | 0.01 | -8.91 | 2.09 | -9.98 | 0.9676 | -0.0526 | |||
| WHG / Westwood Holdings Group, Inc. | 0.13 | -9.03 | 2.08 | -12.32 | 0.9613 | -0.0797 | |||
| PANW / Palo Alto Networks, Inc. | 0.01 | -10.73 | 2.04 | 7.08 | 0.9448 | 0.1070 | |||
| BKLN / Invesco Exchange-Traded Fund Trust II - Invesco Senior Loan ETF | 0.10 | -13.13 | 2.01 | -12.20 | 0.9284 | -0.0755 | |||
| XYLD / Global X Funds - Global X S&P 500 Covered Call ETF | 0.05 | 3.59 | 1.86 | 2.14 | 0.8615 | 0.0608 | |||
| D / Dominion Energy, Inc. | 0.03 | 20.06 | 1.79 | 21.08 | 0.8257 | 0.1780 | |||
| TXN / Texas Instruments Incorporated | 0.01 | -13.28 | 1.75 | 0.17 | 0.8103 | 0.0425 | |||
| MS / Morgan Stanley | 0.01 | -11.51 | 1.70 | 6.86 | 0.7851 | 0.0875 | |||
| QCOM / QUALCOMM Incorporated | 0.01 | -15.93 | 1.65 | -12.86 | 0.7649 | -0.0682 | |||
| BC / Brunswick Corporation | 0.03 | 33.40 | 1.64 | 36.83 | 0.7593 | 0.2325 | |||
| CALM / Cal-Maine Foods, Inc. | 0.02 | -12.40 | 1.54 | -3.98 | 0.7142 | 0.0081 | |||
| OKE / ONEOK, Inc. | 0.02 | -10.06 | 1.45 | -26.00 | 0.6700 | -0.1895 | |||
| OBDC / Blue Owl Capital Corporation | 0.10 | 14.18 | 1.42 | 11.64 | 0.6568 | 0.0985 | |||
| MFIC / MidCap Financial Investment Corporation | 0.11 | -15.34 | 1.41 | -16.93 | 0.6513 | -0.0929 | |||
| GWW / W.W. Grainger, Inc. | 0.00 | -9.37 | 1.41 | -4.61 | 0.6509 | 0.0032 | |||
| EIM / Eaton Vance Municipal Bond Fund | 0.14 | -10.99 | 1.37 | -13.73 | 0.6338 | -0.0632 | |||
| BKNG / Booking Holdings Inc. | 0.00 | -10.66 | 1.26 | 12.28 | 0.5835 | 0.0901 | |||
| SCHW / The Charles Schwab Corporation | 0.01 | -12.49 | 1.24 | 2.06 | 0.5729 | 0.0397 | |||
| DE / Deere & Company | 0.00 | -8.27 | 1.21 | -0.66 | 0.5606 | 0.0249 | |||
| GSBD / Goldman Sachs BDC, Inc. | 0.11 | 0.08 | 1.20 | -3.22 | 0.5568 | 0.0108 | |||
| FDX / FedEx Corporation | 0.01 | -7.18 | 1.20 | -13.46 | 0.5560 | -0.0539 | |||
| GD / General Dynamics Corporation | 0.00 | -9.31 | 1.17 | -2.98 | 0.5422 | 0.0117 | |||
| SEB / Seaboard Corporation | 0.00 | -30.07 | 1.16 | -25.81 | 0.5384 | -0.1506 | |||
| VMO / Invesco Municipal Opportunity Trust | 0.13 | 10.27 | 1.16 | 6.64 | 0.5347 | 0.0588 | |||
| BCSF / Bain Capital Specialty Finance, Inc. | 0.08 | 162.60 | 1.15 | 138.10 | 0.5320 | 0.3198 | |||
| ADP / Automatic Data Processing, Inc. | 0.00 | -13.29 | 1.15 | -12.50 | 0.5309 | -0.0449 | |||
| SPY / SPDR S&P 500 ETF | 0.00 | -0.11 | 1.14 | 10.35 | 0.5277 | 0.0736 | |||
| JNK / SPDR Series Trust - SPDR Bloomberg High Yield Bond ETF | 0.01 | 81.10 | 1.13 | 85.11 | 0.5230 | 0.2544 | |||
| GOOGL / Alphabet Inc. | 0.01 | -17.47 | 1.12 | -5.99 | 0.5157 | -0.0048 | |||
| RSG / Republic Services, Inc. | 0.00 | -4.89 | 1.10 | -3.18 | 0.5073 | 0.0100 | |||
| BAC / Bank of America Corporation | 0.02 | -4.57 | 1.08 | 8.18 | 0.5013 | 0.0615 | |||
| AMD / Advanced Micro Devices, Inc. | 0.01 | -7.60 | 1.07 | 27.65 | 0.4954 | 0.1269 | |||
| UPS / United Parcel Service, Inc. | 0.01 | -18.83 | 1.07 | -25.52 | 0.4940 | -0.1355 | |||
| INTU / Intuit Inc. | 0.00 | -6.44 | 1.06 | 19.98 | 0.4917 | 0.1028 | |||
| ZG / Zillow Group, Inc. | 0.02 | -6.09 | 1.06 | -3.74 | 0.4883 | 0.0064 | |||
| DOW / Dow Inc. | 0.04 | -25.42 | 1.01 | -43.19 | 0.4670 | -0.3136 | |||
| ETN / Eaton Corporation plc | 0.00 | -5.44 | 0.99 | 24.31 | 0.4587 | 0.1080 | |||
| TIP / iShares Trust - iShares TIPS Bond ETF | 0.01 | 6.50 | 0.99 | 5.54 | 0.4579 | 0.0458 | |||
| SLRC / SLR Investment Corp. | 0.06 | -11.66 | 0.95 | -15.48 | 0.4395 | -0.0539 | |||
| META / Meta Platforms, Inc. | 0.00 | -7.35 | 0.95 | 18.65 | 0.4385 | 0.0876 | |||
| FAF / First American Financial Corporation | 0.02 | -15.18 | 0.92 | -20.64 | 0.4268 | -0.0838 | |||
| CTVA / Corteva, Inc. | 0.01 | -17.06 | 0.91 | -1.73 | 0.4204 | 0.0141 | |||
| NFLX / Netflix, Inc. | 0.00 | -4.29 | 0.90 | 37.48 | 0.4142 | 0.1281 | |||
| TSLA / Tesla, Inc. | 0.00 | -5.32 | 0.88 | 16.07 | 0.4077 | 0.0742 | |||
| LMT / Lockheed Martin Corporation | 0.00 | -28.53 | 0.85 | -25.94 | 0.3938 | -0.1106 | |||
| NEE.PRR / NextEra Energy, Inc. - Preferred Security | 0.02 | -14.02 | 0.83 | -15.86 | 0.3853 | -0.0496 | |||
| TAP.A / Molson Coors Beverage Company | 0.02 | -6.32 | 0.80 | -26.00 | 0.3685 | -0.1042 | |||
| EFT / Eaton Vance Floating-Rate Income Trust | 0.06 | -9.56 | 0.74 | -10.05 | 0.3435 | -0.0191 | |||
| CAT / Caterpillar Inc. | 0.00 | -18.20 | 0.73 | -3.71 | 0.3363 | 0.0046 | |||
| BA / The Boeing Company | 0.00 | -8.59 | 0.72 | 12.25 | 0.3349 | 0.0518 | |||
| COLD / Americold Realty Trust, Inc. | 0.04 | 4.29 | 0.72 | -19.24 | 0.3342 | -0.0584 | |||
| ORI / Old Republic International Corporation | 0.02 | -25.30 | 0.72 | -26.82 | 0.3310 | -0.0982 | |||
| XOM / Exxon Mobil Corporation | 0.01 | -43.01 | 0.71 | -48.39 | 0.3262 | -0.2734 | |||
| EFR / Eaton Vance Senior Floating-Rate Trust | 0.06 | -10.22 | 0.70 | -11.20 | 0.3232 | -0.0222 | |||
| SO / The Southern Company | 0.01 | -22.53 | 0.68 | -22.62 | 0.3165 | -0.0718 | |||
| CSCO / Cisco Systems, Inc. | 0.01 | -10.68 | 0.68 | 0.44 | 0.3158 | 0.0172 | |||
| DD / DuPont de Nemours, Inc. | 0.01 | 7.07 | 0.68 | -1.59 | 0.3158 | 0.0110 | |||
| NSC / Norfolk Southern Corporation | 0.00 | -12.93 | 0.68 | -5.93 | 0.3156 | -0.0028 | |||
| TSN / Tyson Foods, Inc. | 0.01 | -9.59 | 0.68 | -20.81 | 0.3152 | -0.0623 | |||
| KMB / Kimberly-Clark Corporation | 0.01 | -19.30 | 0.68 | -26.89 | 0.3133 | -0.0933 | |||
| VNQ / Vanguard Specialized Funds - Vanguard Real Estate ETF | 0.01 | 13.13 | 0.67 | 11.24 | 0.3114 | 0.0458 | |||
| QYLD / Global X Funds - Global X NASDAQ 100 Covered Call ETF | 0.04 | -6.72 | 0.66 | -6.23 | 0.3063 | -0.0038 | |||
| STZ / Constellation Brands, Inc. | 0.00 | -9.78 | 0.65 | -19.98 | 0.2983 | -0.0558 | |||
| SHOP / Shopify Inc. | 0.01 | -7.92 | 0.64 | 11.25 | 0.2976 | 0.0436 | |||
| RTX / RTX Corporation | 0.00 | -11.64 | 0.63 | -2.62 | 0.2925 | 0.0074 | |||
| LOW / Lowe's Companies, Inc. | 0.00 | -0.53 | 0.63 | -5.43 | 0.2903 | -0.0009 | |||
| STM / STMicroelectronics N.V. - Depositary Receipt (Common Stock) | 0.02 | -7.61 | 0.62 | 28.07 | 0.2850 | 0.0735 | |||
| RYLD / Global X Funds - Global X Russell 2000 Covered Call ETF | 0.04 | -15.32 | 0.61 | -16.46 | 0.2820 | -0.0382 | |||
| HD / The Home Depot, Inc. | 0.00 | 8.75 | 0.59 | 8.82 | 0.2739 | 0.0348 | |||
| FSLR / First Solar, Inc. | 0.00 | -10.33 | 0.59 | 17.56 | 0.2725 | 0.0522 | |||
| MU / Micron Technology, Inc. | 0.00 | -7.33 | 0.59 | 31.47 | 0.2723 | 0.0757 | |||
| JNJ / Johnson & Johnson | 0.00 | -13.27 | 0.58 | -20.06 | 0.2673 | -0.0503 | |||
| MSGS / Madison Square Garden Sports Corp. | 0.00 | -2.58 | 0.55 | 4.55 | 0.2550 | 0.0234 | |||
| PNNT / PennantPark Investment Corporation | 0.08 | -18.35 | 0.54 | -20.56 | 0.2502 | -0.0488 | |||
| GAIN / Gladstone Investment Corporation | 0.04 | -2.38 | 0.53 | 4.37 | 0.2428 | 0.0218 | |||
| MOS / The Mosaic Company | 0.01 | -33.00 | 0.52 | -9.41 | 0.2405 | -0.0118 | |||
| WSR / Whitestone REIT | 0.04 | -6.10 | 0.50 | -19.55 | 0.2302 | -0.0415 | |||
| JPM / JPMorgan Chase & Co. | 0.00 | -19.38 | 0.49 | -4.71 | 0.2248 | 0.0009 | |||
| SYK / Stryker Corporation | 0.00 | -22.86 | 0.47 | -17.99 | 0.2192 | -0.0346 | |||
| EFA / iShares Trust - iShares MSCI EAFE ETF | 0.01 | 9.33 | 0.47 | 19.54 | 0.2151 | 0.0443 | |||
| UL / Unilever PLC - Depositary Receipt (Common Stock) | 0.01 | -10.59 | 0.46 | -8.12 | 0.2148 | -0.0072 | |||
| DKNG / DraftKings Inc. | 0.01 | -7.68 | 0.46 | 19.28 | 0.2145 | 0.0437 | |||
| MKC / McCormick & Company, Incorporated | 0.01 | -24.65 | 0.45 | -30.67 | 0.2093 | -0.0769 | |||
| NLY / Annaly Capital Management, Inc. | 0.02 | -8.47 | 0.44 | -15.20 | 0.2014 | -0.0240 | |||
| MRK / Merck & Co., Inc. | 0.01 | -16.85 | 0.43 | -26.73 | 0.2005 | -0.0591 | |||
| AXP / American Express Company | 0.00 | -3.57 | 0.43 | 14.32 | 0.1994 | 0.0339 | |||
| WY / Weyerhaeuser Company | 0.02 | -54.97 | 0.43 | -60.50 | 0.1966 | -0.2759 | |||
| DUK / Duke Energy Corporation | 0.00 | -9.68 | 0.42 | -12.58 | 0.1961 | -0.0169 | |||
| IJR / iShares Trust - iShares Core S&P Small-Cap ETF | 0.00 | 0.24 | 0.41 | 4.64 | 0.1880 | 0.0176 | |||
| LLY / Eli Lilly and Company | 0.00 | -2.26 | 0.41 | -7.74 | 0.1874 | -0.0054 | |||
| EMR / Emerson Electric Co. | 0.00 | -9.45 | 0.40 | 10.03 | 0.1831 | 0.0252 | |||
| APD / Air Products and Chemicals, Inc. | 0.00 | 0.36 | 0.1687 | 0.1687 | |||||
| PG / The Procter & Gamble Company | 0.00 | -18.05 | 0.36 | -23.53 | 0.1686 | -0.0403 | |||
| ROK / Rockwell Automation, Inc. | 0.00 | 0.36 | 0.1674 | 0.1674 | |||||
| BHP / BHP Group Limited - Depositary Receipt (Common Stock) | 0.01 | -24.21 | 0.35 | -25.05 | 0.1622 | -0.0429 | |||
| UNP / Union Pacific Corporation | 0.00 | -33.05 | 0.35 | -34.78 | 0.1597 | -0.0728 | |||
| EVRG / Evergy, Inc. | 0.00 | -6.40 | 0.34 | -6.58 | 0.1579 | -0.0023 | |||
| WMB / The Williams Companies, Inc. | 0.01 | -43.38 | 0.34 | -40.43 | 0.1554 | -0.0925 | |||
| TXT / Textron Inc. | 0.00 | -0.89 | 0.33 | 10.03 | 0.1525 | 0.0211 | |||
| OLN / Olin Corporation | 0.02 | -9.67 | 0.33 | -25.17 | 0.1515 | -0.0406 | |||
| ABBV / AbbVie Inc. | 0.00 | -7.49 | 0.32 | -18.16 | 0.1484 | -0.0235 | |||
| PGR / The Progressive Corporation | 0.00 | -8.02 | 0.31 | -13.35 | 0.1415 | -0.0134 | |||
| SEE / Sealed Air Corporation | 0.01 | -3.02 | 0.30 | 4.15 | 0.1392 | 0.0123 | |||
| MA / Mastercard Incorporated | 0.00 | -4.64 | 0.29 | -2.37 | 0.1335 | 0.0039 | |||
| ABT / Abbott Laboratories | 0.00 | -3.41 | 0.27 | -0.74 | 0.1245 | 0.0052 | |||
| FLOT / iShares Trust - iShares Floating Rate Bond ETF | 0.01 | -39.61 | 0.26 | -39.58 | 0.1194 | -0.0684 | |||
| CSX / CSX Corporation | 0.01 | -16.84 | 0.26 | -7.89 | 0.1192 | -0.0035 | |||
| CRM / Salesforce, Inc. | 0.00 | 0.00 | 0.26 | 1.58 | 0.1190 | 0.0078 | |||
| IYY / iShares Trust - iShares Dow Jones U.S. ETF | 0.00 | 0.18 | 0.25 | 10.92 | 0.1178 | 0.0171 | |||
| CHKP / Check Point Software Technologies Ltd. | 0.00 | -14.87 | 0.25 | -17.32 | 0.1171 | -0.0174 | |||
| AIG / American International Group, Inc. | 0.00 | -16.76 | 0.25 | -18.00 | 0.1140 | -0.0181 | |||
| FBIN / Fortune Brands Innovations, Inc. | 0.00 | -7.28 | 0.24 | -21.71 | 0.1104 | -0.0233 | |||
| AZN / AstraZeneca PLC - Depositary Receipt (Common Stock) | 0.00 | -1.45 | 0.24 | -6.35 | 0.1095 | -0.0014 | |||
| MSGE / Madison Square Garden Entertainment Corp. | 0.01 | 0.24 | 0.1093 | 0.1093 | |||||
| DIS / The Walt Disney Company | 0.00 | -18.98 | 0.23 | 1.76 | 0.1072 | 0.0072 | |||
| MUB / iShares Trust - iShares National Muni Bond ETF | 0.00 | 0.22 | 0.1014 | 0.1014 | |||||
| MBC / MasterBrand, Inc. | 0.02 | -5.39 | 0.20 | -20.87 | 0.0933 | -0.0186 | |||
| PSEC / Prospect Capital Corporation | 0.05 | -10.29 | 0.16 | -30.67 | 0.0724 | -0.0264 | |||
| PFLT / PennantPark Floating Rate Capital Ltd. | 0.01 | -2.41 | 0.15 | -9.82 | 0.0681 | -0.0037 | |||
| DHF / BNY Mellon High Yield Strategies Fund | 0.02 | -4.65 | 0.06 | -1.67 | 0.0274 | 0.0006 | |||
| DHY / Credit Suisse High Yield Bond Fund, Inc. | 0.01 | 0.54 | 0.02 | 0.00 | 0.0103 | 0.0006 | |||
| EQR / Equity Residential | 0.00 | -100.00 | 0.00 | 0.0000 | |||||
| SR / Spire Inc. | 0.00 | -100.00 | 0.00 | 0.0000 | |||||
| IFF / International Flavors & Fragrances Inc. | 0.00 | -100.00 | 0.00 | 0.0000 | |||||
| DMLP / Dorchester Minerals, L.P. - Limited Partnership | 0.00 | -100.00 | 0.00 | 0.0000 | |||||
| CHD / Church & Dwight Co., Inc. | 0.00 | -100.00 | 0.00 | 0.0000 | |||||
| FPI / Farmland Partners Inc. | 0.00 | -100.00 | 0.00 | 0.0000 | |||||
| HGTY / Hagerty, Inc. | 0.00 | -100.00 | 0.00 | 0.0000 | |||||
| MMM / 3M Company | 0.00 | -100.00 | 0.00 | 0.0000 | |||||
| AA / Alcoa Corporation | 0.00 | -100.00 | 0.00 | 0.0000 | |||||
| BRK.A / Berkshire Hathaway Inc. | 0.00 | -100.00 | 0.00 | 0.0000 | |||||
| BP / BP p.l.c. - Depositary Receipt (Common Stock) | 0.00 | -100.00 | 0.00 | 0.0000 |