Statistik Asas
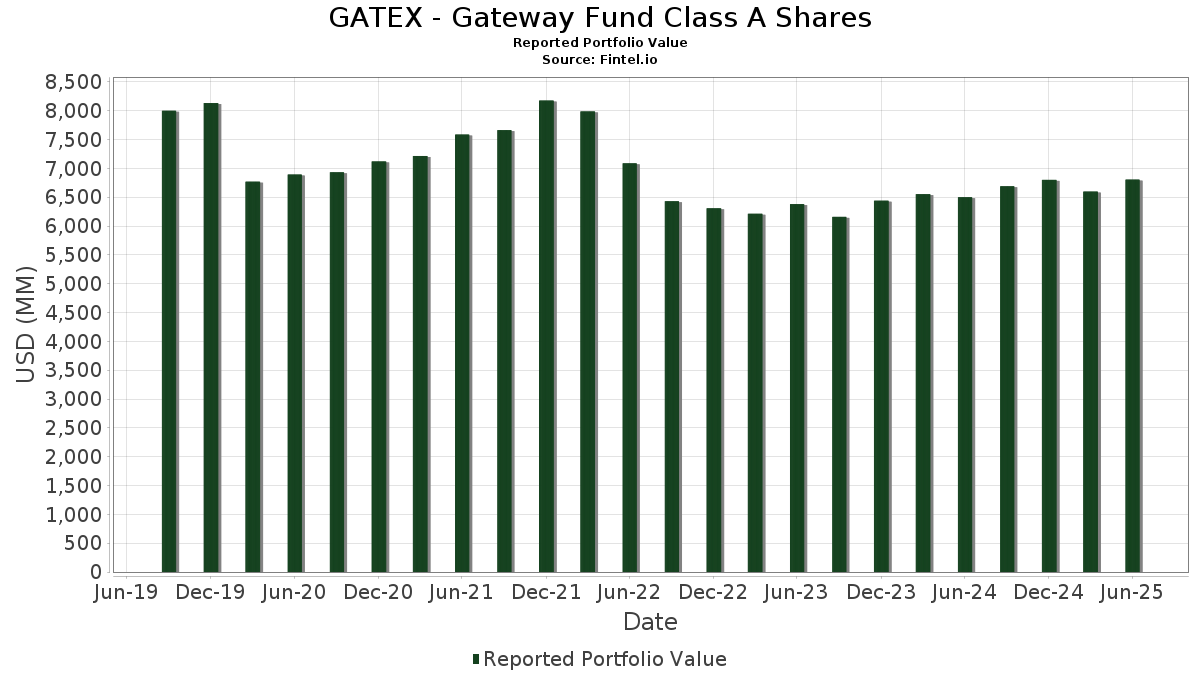
| Nilai Portfolio | $ 6,805,225,391 |
| Kedudukan Semasa | 223 |
Pegangan Terkini, Prestasi, AUM (dari 13F, 13D)
GATEX - Gateway Fund Class A Shares telah mendedahkan 223 jumlah pegangan dalam pemfailan SEC terkini mereka. Nilai portfolio terkini dikira sebagai $ 6,805,225,391 USD. Aset Sebenar Di Bawah Pengurusan (AUM) ialah nilai ini ditambah dengan tunai (yang tidak didedahkan). Pegangan teratas GATEX - Gateway Fund Class A Shares ialah Microsoft Corporation (US:MSFT) , NVIDIA Corporation (US:NVDA) , Apple Inc. (US:AAPL) , Amazon.com, Inc. (US:AMZN) , and Meta Platforms, Inc. (US:META) . Kedudukan baharu GATEX - Gateway Fund Class A Shares termasuk Capital One Financial Corporation (US:COF) , Vodafone Group Public Limited Company - Depositary Receipt (Common Stock) (US:VOD) , Jones Lang LaSalle Incorporated (US:JLL) , Essential Utilities, Inc. (US:WTRG) , and Gaming and Leisure Properties, Inc. (US:GLPI) .
Kenaikan Teratas Suku Tahun Ini
Kami menggunakan perubahan dalam peruntukan portfolio kerana ini adalah metrik yang paling bermakna. Perubahan boleh disebabkan oleh perdagangan atau perubahan dalam harga saham.
| Sekuriti | Saham (MM) |
Nilai (MM$) |
Portfolio % | ΔPortfolio % |
|---|---|---|---|---|
| 3.22 | 508.17 | 7.4896 | 1.9260 | |
| 125.52 | 1.8499 | 1.8499 | ||
| 125.52 | 1.8499 | 1.8499 | ||
| 1.03 | 511.11 | 7.5330 | 1.5174 | |
| 0.63 | 175.03 | 2.5796 | 0.9041 | |
| 0.31 | 228.07 | 3.3615 | 0.6222 | |
| 0.14 | 30.74 | 0.4530 | 0.4530 | |
| 1.34 | 293.50 | 4.3258 | 0.4302 | |
| 0.30 | 65.06 | 0.9589 | 0.3291 | |
| 0.07 | 91.74 | 1.3521 | 0.2762 |
Penurunan Teratas Suku Tahun Ini
Kami menggunakan perubahan dalam peruntukan portfolio kerana ini adalah metrik yang paling bermakna. Perubahan boleh disebabkan oleh perdagangan atau perubahan dalam harga saham.
| Sekuriti | Saham (MM) |
Nilai (MM$) |
Portfolio % | ΔPortfolio % |
|---|---|---|---|---|
| 1.99 | 407.81 | 6.0106 | -0.9688 | |
| 0.15 | 48.27 | 0.7115 | -0.5250 | |
| 0.31 | 149.58 | 2.2046 | -0.3786 | |
| -21.61 | -0.3184 | -0.3184 | ||
| -21.61 | -0.3184 | -0.3184 | ||
| -20.79 | -0.3064 | -0.3064 | ||
| -20.79 | -0.3064 | -0.3064 | ||
| -20.37 | -0.3002 | -0.3002 | ||
| -20.37 | -0.3002 | -0.3002 | ||
| -20.21 | -0.2979 | -0.2979 |
13F dan Pemfailan Dana
Borang ini telah difailkan pada 2025-08-29 untuk tempoh pelaporan 2025-06-30. Klik ikon pautan untuk melihat sejarah transaksi penuh.
Tingkatkan untuk membuka data premium dan eksport ke Excel ![]() .
.
| Sekuriti | Jenis | Purata Harga Saham | Saham (MM) |
ΔSaham (%) |
ΔSaham (%) |
Nilai ($MM) |
Portfolio (%) |
ΔPortfolio (%) |
|
|---|---|---|---|---|---|---|---|---|---|
| MSFT / Microsoft Corporation | 1.03 | -2.93 | 511.11 | 28.62 | 7.5330 | 1.5174 | |||
| NVDA / NVIDIA Corporation | 3.22 | -5.15 | 508.17 | 38.27 | 7.4896 | 1.9260 | |||
| AAPL / Apple Inc. | 1.99 | -4.23 | 407.81 | -11.55 | 6.0106 | -0.9688 | |||
| AMZN / Amazon.com, Inc. | 1.34 | -1.09 | 293.50 | 14.05 | 4.3258 | 0.4302 | |||
| META / Meta Platforms, Inc. | 0.31 | -1.58 | 228.07 | 26.04 | 3.3615 | 0.6222 | |||
| GOOG / Alphabet Inc. | 1.12 | -2.60 | 199.26 | 10.59 | 2.9368 | 0.2092 | |||
| AVGO / Broadcom Inc. | 0.63 | -3.95 | 175.03 | 58.13 | 2.5796 | 0.9041 | |||
| JPM / JPMorgan Chase & Co. | 0.53 | -3.39 | 152.73 | 14.18 | 2.2510 | 0.2262 | |||
| BRK.B / Berkshire Hathaway Inc. | 0.31 | -3.90 | 149.58 | -12.34 | 2.2046 | -0.3786 | |||
| V / Visa Inc. | 0.36 | -2.80 | 126.48 | -1.53 | 1.8641 | -0.0802 | |||
| FIXED INC CLEARING CORP.REPO / RA (000000000) | 125.52 | 1.8499 | 1.8499 | ||||||
| FIXED INC CLEARING CORP.REPO / RA (000000000) | 125.52 | 1.8499 | 1.8499 | ||||||
| TSLA / Tesla, Inc. | 0.36 | -1.64 | 113.65 | 20.57 | 1.6750 | 0.2481 | |||
| NFLX / Netflix, Inc. | 0.07 | -10.12 | 91.74 | 29.08 | 1.3521 | 0.2762 | |||
| LLY / Eli Lilly and Company | 0.12 | -0.78 | 91.41 | -6.35 | 1.3472 | -0.1304 | |||
| BAC / Bank of America Corporation | 1.62 | -7.57 | 76.75 | 4.82 | 1.1311 | 0.0227 | |||
| HD / The Home Depot, Inc. | 0.20 | -6.41 | 71.59 | -6.37 | 1.0551 | -0.1023 | |||
| COST / Costco Wholesale Corporation | 0.07 | -8.25 | 67.42 | -3.97 | 0.9937 | -0.0691 | |||
| XOM / Exxon Mobil Corporation | 0.61 | -8.89 | 66.08 | -17.41 | 0.9740 | -0.2373 | |||
| PG / The Procter & Gamble Company | 0.41 | -12.87 | 65.89 | -18.54 | 0.9711 | -0.2534 | |||
| ORCL / Oracle Corporation | 0.30 | 0.00 | 65.06 | 56.38 | 0.9589 | 0.3291 | |||
| RTX / RTX Corporation | 0.44 | -0.78 | 64.02 | 9.38 | 0.9435 | 0.0575 | |||
| WMT / Walmart Inc. | 0.64 | -8.81 | 62.70 | 1.56 | 0.9241 | -0.0105 | |||
| CSCO / Cisco Systems, Inc. | 0.89 | -9.07 | 61.97 | 2.24 | 0.9134 | -0.0042 | |||
| JNJ / Johnson & Johnson | 0.39 | -12.71 | 59.08 | -19.60 | 0.8708 | -0.2416 | |||
| MS / Morgan Stanley | 0.41 | -0.78 | 58.36 | 19.79 | 0.8601 | 0.1226 | |||
| WFC / Wells Fargo & Company | 0.70 | -3.28 | 56.32 | 7.94 | 0.8301 | 0.0402 | |||
| BSX / Boston Scientific Corporation | 0.49 | -0.78 | 53.09 | 5.64 | 0.7825 | 0.0217 | |||
| GOOGL / Alphabet Inc. | 0.29 | -10.30 | 51.85 | 2.22 | 0.7642 | -0.0037 | |||
| ABBV / AbbVie Inc. | 0.28 | -5.69 | 51.60 | -16.44 | 0.7605 | -0.1743 | |||
| ABT / Abbott Laboratories | 0.37 | -12.01 | 49.90 | -9.78 | 0.7355 | -0.1019 | |||
| ISRG / Intuitive Surgical, Inc. | 0.09 | -5.33 | 49.42 | 3.87 | 0.7284 | 0.0081 | |||
| UNH / UnitedHealth Group Incorporated | 0.15 | -0.78 | 48.27 | -40.90 | 0.7115 | -0.5250 | |||
| AJG / Arthur J. Gallagher & Co. | 0.15 | 0.00 | 47.18 | -7.28 | 0.6953 | -0.0749 | |||
| CAT / Caterpillar Inc. | 0.12 | 0.00 | 47.03 | 17.71 | 0.6932 | 0.0883 | |||
| HON / Honeywell International Inc. | 0.20 | 0.00 | 46.68 | 9.98 | 0.6880 | 0.0455 | |||
| ADP / Automatic Data Processing, Inc. | 0.14 | 0.00 | 43.50 | 0.94 | 0.6412 | -0.0113 | |||
| CVX / Chevron Corporation | 0.30 | -4.15 | 42.91 | -17.96 | 0.6324 | -0.1594 | |||
| DIS / The Walt Disney Company | 0.35 | 0.00 | 42.80 | 25.64 | 0.6308 | 0.1151 | |||
| WM / Waste Management, Inc. | 0.19 | 0.00 | 42.49 | -1.16 | 0.6262 | -0.0245 | |||
| ETN / Eaton Corporation plc | 0.12 | 0.00 | 42.38 | 31.33 | 0.6246 | 0.1361 | |||
| NOW / ServiceNow, Inc. | 0.04 | 0.00 | 42.06 | 29.13 | 0.6199 | 0.1268 | |||
| TXN / Texas Instruments Incorporated | 0.20 | -0.84 | 41.66 | 14.57 | 0.6140 | 0.0635 | |||
| AMD / Advanced Micro Devices, Inc. | 0.28 | 0.00 | 40.25 | 38.12 | 0.5932 | 0.1521 | |||
| BKNG / Booking Holdings Inc. | 0.01 | -1.93 | 40.20 | 23.23 | 0.5925 | 0.0987 | |||
| MCD / McDonald's Corporation | 0.14 | -2.43 | 39.87 | -8.74 | 0.5877 | -0.0738 | |||
| ICE / Intercontinental Exchange, Inc. | 0.22 | 0.00 | 39.67 | 6.36 | 0.5846 | 0.0201 | |||
| PH / Parker-Hannifin Corporation | 0.06 | 0.00 | 39.41 | 14.91 | 0.5809 | 0.0617 | |||
| MDLZ / Mondelez International, Inc. | 0.58 | 0.00 | 38.84 | -0.61 | 0.5725 | -0.0191 | |||
| AFL / Aflac Incorporated | 0.37 | 0.00 | 38.81 | -5.15 | 0.5719 | -0.0474 | |||
| PLTR / Palantir Technologies Inc. | 0.28 | 4.24 | 37.60 | 68.37 | 0.5541 | 0.2161 | |||
| HLT / Hilton Worldwide Holdings Inc. | 0.14 | 0.00 | 37.42 | 17.05 | 0.5515 | 0.0675 | |||
| LOW / Lowe's Companies, Inc. | 0.17 | 0.00 | 36.63 | -4.87 | 0.5398 | -0.0430 | |||
| AEP / American Electric Power Company, Inc. | 0.35 | -5.58 | 36.22 | -10.34 | 0.5338 | -0.0777 | |||
| T / AT&T Inc. | 1.24 | -13.49 | 36.01 | -11.47 | 0.5307 | -0.0850 | |||
| PEP / PepsiCo, Inc. | 0.27 | -18.17 | 35.46 | -27.94 | 0.5226 | -0.2222 | |||
| ADBE / Adobe Inc. | 0.09 | 0.00 | 34.59 | 0.87 | 0.5098 | -0.0093 | |||
| DE / Deere & Company | 0.07 | 0.00 | 34.02 | 8.34 | 0.5014 | 0.0260 | |||
| QCOM / QUALCOMM Incorporated | 0.21 | -1.02 | 33.69 | 2.63 | 0.4965 | -0.0004 | |||
| AON / Aon plc | 0.09 | 0.00 | 32.51 | -10.61 | 0.4791 | -0.0714 | |||
| ELV / Elevance Health, Inc. | 0.08 | 0.00 | 30.88 | -10.58 | 0.4552 | -0.0676 | |||
| COF / Capital One Financial Corporation | 0.14 | 30.74 | 0.4530 | 0.4530 | |||||
| MRK / Merck & Co., Inc. | 0.38 | -16.85 | 30.02 | -26.67 | 0.4424 | -0.1773 | |||
| AMGN / Amgen Inc. | 0.11 | -0.78 | 29.96 | -11.08 | 0.4416 | -0.0685 | |||
| BA / The Boeing Company | 0.14 | 0.00 | 29.33 | 22.86 | 0.4322 | 0.0709 | |||
| COP / ConocoPhillips | 0.32 | 0.00 | 29.10 | -14.55 | 0.4289 | -0.0866 | |||
| ADI / Analog Devices, Inc. | 0.12 | -4.71 | 28.82 | 12.47 | 0.4247 | 0.0368 | |||
| CCI / Crown Castle Inc. | 0.28 | -3.93 | 28.41 | -5.31 | 0.4187 | -0.0355 | |||
| HCA / HCA Healthcare, Inc. | 0.07 | 0.00 | 27.93 | 10.87 | 0.4117 | 0.0303 | |||
| VRTX / Vertex Pharmaceuticals Incorporated | 0.06 | 0.00 | 27.92 | -8.17 | 0.4115 | -0.0488 | |||
| CSX / CSX Corporation | 0.84 | 0.00 | 27.31 | 10.87 | 0.4024 | 0.0296 | |||
| SCHW / The Charles Schwab Corporation | 0.30 | 0.00 | 26.94 | 16.55 | 0.3970 | 0.0472 | |||
| CDNS / Cadence Design Systems, Inc. | 0.08 | 0.00 | 26.00 | 21.16 | 0.3832 | 0.0584 | |||
| SYF / Synchrony Financial | 0.39 | 0.00 | 26.00 | 26.07 | 0.3832 | 0.0710 | |||
| CARR / Carrier Global Corporation | 0.36 | 0.00 | 26.00 | 15.44 | 0.3832 | 0.0423 | |||
| PLD / Prologis, Inc. | 0.24 | 14.18 | 25.22 | 7.37 | 0.3717 | 0.0161 | |||
| AEE / Ameren Corporation | 0.26 | 0.00 | 25.06 | -4.34 | 0.3694 | -0.0272 | |||
| CMI / Cummins Inc. | 0.07 | 0.00 | 24.30 | 4.49 | 0.3581 | 0.0061 | |||
| MSCI / MSCI Inc. | 0.04 | 0.00 | 24.11 | 1.99 | 0.3553 | -0.0025 | |||
| WEC / WEC Energy Group, Inc. | 0.23 | 1.66 | 24.11 | -2.80 | 0.3553 | -0.0202 | |||
| MLM / Martin Marietta Materials, Inc. | 0.04 | 0.00 | 23.74 | 14.81 | 0.3499 | 0.0369 | |||
| SBAC / SBA Communications Corporation | 0.10 | 22.67 | 23.60 | 30.94 | 0.3478 | 0.0750 | |||
| PFE / Pfizer Inc. | 0.97 | 0.00 | 23.41 | -4.34 | 0.3450 | -0.0254 | |||
| PAYX / Paychex, Inc. | 0.16 | 0.00 | 23.35 | -5.72 | 0.3442 | -0.0308 | |||
| CRM / Salesforce, Inc. | 0.08 | -41.27 | 22.75 | -40.33 | 0.3354 | -0.2419 | |||
| PYPL / PayPal Holdings, Inc. | 0.30 | 0.00 | 22.35 | 13.90 | 0.3295 | 0.0324 | |||
| MNST / Monster Beverage Corporation | 0.35 | 0.00 | 21.89 | 7.04 | 0.3226 | 0.0130 | |||
| VRSN / VeriSign, Inc. | 0.07 | 0.00 | 20.92 | 13.76 | 0.3084 | 0.0299 | |||
| CPRT / Copart, Inc. | 0.42 | 0.00 | 20.69 | -13.29 | 0.3050 | -0.0563 | |||
| CTVA / Corteva, Inc. | 0.28 | 0.00 | 20.55 | 18.43 | 0.3029 | 0.0402 | |||
| TRGP / Targa Resources Corp. | 0.12 | -0.50 | 20.09 | -13.60 | 0.2960 | -0.0559 | |||
| CMCSA / Comcast Corporation | 0.55 | 0.00 | 19.70 | -3.28 | 0.2903 | -0.0180 | |||
| A / Agilent Technologies, Inc. | 0.17 | 159.80 | 19.64 | 162.09 | 0.2895 | 0.1760 | |||
| UBER / Uber Technologies, Inc. | 0.21 | -28.20 | 19.43 | -8.06 | 0.2864 | -0.0335 | |||
| GEV / GE Vernova Inc. | 0.04 | 17.74 | 18.65 | 104.08 | 0.2749 | 0.1365 | |||
| OKE / ONEOK, Inc. | 0.23 | 0.00 | 18.45 | -17.73 | 0.2720 | -0.0676 | |||
| ED / Consolidated Edison, Inc. | 0.18 | -12.31 | 18.14 | -20.43 | 0.2673 | -0.0777 | |||
| UNM / Unum Group | 0.22 | 0.00 | 17.72 | -0.86 | 0.2612 | -0.0094 | |||
| GLW / Corning Incorporated | 0.33 | 0.00 | 17.38 | 14.88 | 0.2562 | 0.0271 | |||
| CDW / CDW Corporation | 0.10 | 0.00 | 17.34 | 11.44 | 0.2555 | 0.0200 | |||
| CVS / CVS Health Corporation | 0.25 | -16.35 | 17.25 | -14.84 | 0.2542 | -0.0524 | |||
| CRWD / CrowdStrike Holdings, Inc. | 0.03 | 0.25 | 17.05 | 44.82 | 0.2514 | 0.0731 | |||
| DOW / Dow Inc. | 0.62 | 82.79 | 16.51 | 38.61 | 0.2434 | 0.0630 | |||
| LNT / Alliant Energy Corporation | 0.27 | 0.00 | 16.43 | -6.03 | 0.2422 | -0.0225 | |||
| NVR / NVR, Inc. | 0.00 | 0.00 | 15.46 | 1.95 | 0.2278 | -0.0017 | |||
| UPS / United Parcel Service, Inc. | 0.14 | -29.21 | 14.37 | -35.04 | 0.2118 | -0.1231 | |||
| GE / General Electric Company | 0.05 | -52.95 | 13.82 | -39.50 | 0.2036 | -0.1421 | |||
| GPC / Genuine Parts Company | 0.11 | 0.00 | 13.04 | 1.83 | 0.1923 | -0.0017 | |||
| MU / Micron Technology, Inc. | 0.11 | -17.56 | 13.01 | 16.93 | 0.1917 | 0.0233 | |||
| HUBB / Hubbell Incorporated | 0.03 | 0.00 | 12.95 | 23.42 | 0.1909 | 0.0320 | |||
| ODFL / Old Dominion Freight Line, Inc. | 0.08 | 0.00 | 12.54 | -1.91 | 0.1848 | -0.0087 | |||
| PNR / Pentair plc | 0.12 | 0.00 | 12.43 | 17.36 | 0.1832 | 0.0229 | |||
| STZ / Constellation Brands, Inc. | 0.08 | 0.00 | 12.35 | -11.35 | 0.1820 | -0.0289 | |||
| F / Ford Motor Company | 1.11 | -4.54 | 12.06 | 3.26 | 0.1777 | 0.0010 | |||
| LYV / Live Nation Entertainment, Inc. | 0.08 | 0.00 | 12.04 | 15.85 | 0.1774 | 0.0201 | |||
| TOL / Toll Brothers, Inc. | 0.10 | 0.00 | 11.77 | 8.09 | 0.1734 | 0.0086 | |||
| LNG / Cheniere Energy, Inc. | 0.05 | 0.00 | 10.97 | 5.23 | 0.1616 | 0.0039 | |||
| TGT / Target Corporation | 0.11 | 0.00 | 10.95 | -5.47 | 0.1614 | -0.0140 | |||
| NKE / NIKE, Inc. | 0.15 | -29.90 | 10.74 | -54.88 | 0.1583 | -0.2143 | |||
| RPM / RPM International Inc. | 0.10 | 0.00 | 10.54 | -5.06 | 0.1553 | -0.0127 | |||
| ZBRA / Zebra Technologies Corporation | 0.03 | 0.00 | 10.28 | 9.13 | 0.1516 | 0.0089 | |||
| INTC / Intel Corporation | 0.46 | -32.06 | 10.23 | -32.98 | 0.1507 | -0.0803 | |||
| S+P 500 INDEX / DE (000000000) | 10.21 | 0.1505 | 0.1505 | ||||||
| S+P 500 INDEX / DE (000000000) | 10.21 | 0.1505 | 0.1505 | ||||||
| LII / Lennox International Inc. | 0.02 | 0.00 | 10.18 | 2.22 | 0.1501 | -0.0007 | |||
| VEEV / Veeva Systems Inc. | 0.04 | 0.00 | 10.12 | 24.33 | 0.1492 | 0.0259 | |||
| WCN / Waste Connections, Inc. | 0.05 | 0.00 | 9.99 | -4.34 | 0.1472 | -0.0109 | |||
| SCCO / Southern Copper Corporation | 0.10 | 0.99 | 9.65 | 9.32 | 0.1423 | 0.0086 | |||
| TER / Teradyne, Inc. | 0.11 | 0.00 | 9.59 | 8.86 | 0.1413 | 0.0080 | |||
| AVY / Avery Dennison Corporation | 0.05 | 0.00 | 9.54 | -1.41 | 0.1406 | -0.0059 | |||
| OXY / Occidental Petroleum Corporation | 0.22 | 0.00 | 9.31 | -14.90 | 0.1373 | -0.0284 | |||
| FCX / Freeport-McMoRan Inc. | 0.21 | -9.83 | 9.22 | 3.25 | 0.1359 | 0.0007 | |||
| STE / STERIS plc | 0.04 | 0.00 | 8.56 | 6.00 | 0.1261 | 0.0039 | |||
| S+P 500 INDEX / DE (000000000) | 8.46 | 0.1247 | 0.1247 | ||||||
| S+P 500 INDEX / DE (000000000) | 8.46 | 0.1247 | 0.1247 | ||||||
| BTI / British American Tobacco p.l.c. - Depositary Receipt (Common Stock) | 0.17 | 0.00 | 8.11 | 14.42 | 0.1195 | 0.0122 | |||
| AFG / American Financial Group, Inc. | 0.06 | 0.00 | 7.86 | -3.91 | 0.1158 | -0.0080 | |||
| S+P 500 INDEX / DE (000000000) | 7.20 | 0.1062 | 0.1062 | ||||||
| S+P 500 INDEX / DE (000000000) | 7.20 | 0.1062 | 0.1062 | ||||||
| CP / Canadian Pacific Kansas City Limited | 0.09 | 0.00 | 7.05 | 12.91 | 0.1039 | 0.0094 | |||
| Z / Zillow Group, Inc. | 0.10 | 0.00 | 6.96 | 2.17 | 0.1025 | -0.0005 | |||
| S+P 500 INDEX / DE (000000000) | 6.66 | 0.0981 | 0.0981 | ||||||
| S+P 500 INDEX / DE (000000000) | 6.66 | 0.0981 | 0.0981 | ||||||
| MELI / MercadoLibre, Inc. | 0.00 | 0.00 | 6.63 | 33.97 | 0.0978 | 0.0228 | |||
| FDS / FactSet Research Systems Inc. | 0.01 | 0.00 | 6.53 | -1.63 | 0.0963 | -0.0042 | |||
| WDC / Western Digital Corporation | 0.10 | 78.49 | 6.51 | 182.60 | 0.0960 | 0.0611 | |||
| SPF / Spotify Technology S.A. | 0.01 | 34.90 | 6.51 | 88.20 | 0.0960 | 0.0436 | |||
| DELL / Dell Technologies Inc. | 0.05 | 36.36 | 6.42 | 83.40 | 0.0946 | 0.0416 | |||
| MKL / Markel Group Inc. | 0.00 | 0.00 | 6.30 | 6.83 | 0.0929 | 0.0036 | |||
| HAL / Halliburton Company | 0.31 | -10.96 | 6.29 | -28.47 | 0.0926 | -0.0404 | |||
| STLD / Steel Dynamics, Inc. | 0.05 | 0.00 | 6.12 | 2.36 | 0.0902 | -0.0003 | |||
| Smurfit WestRock PLC / EC (IE00028FXN24) | 0.14 | 0.00 | 6.10 | -4.24 | 0.0899 | -0.0065 | |||
| Smurfit WestRock PLC / EC (IE00028FXN24) | 0.14 | 0.00 | 6.10 | -4.24 | 0.0899 | -0.0065 | |||
| HEI / HEICO Corporation | 0.02 | 0.00 | 6.03 | 22.75 | 0.0888 | 0.0145 | |||
| ON / ON Semiconductor Corporation | 0.11 | 68.69 | 5.72 | 117.33 | 0.0843 | 0.0445 | |||
| VVV / Valvoline Inc. | 0.15 | 0.00 | 5.71 | 8.80 | 0.0842 | 0.0047 | |||
| SCI / Service Corporation International | 0.07 | 0.00 | 5.49 | 1.50 | 0.0809 | -0.0010 | |||
| CUBE / CubeSmart | 0.13 | -1.84 | 5.43 | -2.34 | 0.0801 | -0.0041 | |||
| WDAY / Workday, Inc. | 0.02 | -38.19 | 5.42 | -36.47 | 0.0799 | -0.0493 | |||
| AMH / American Homes 4 Rent | 0.14 | 0.00 | 5.12 | -4.60 | 0.0755 | -0.0058 | |||
| VOD / Vodafone Group Public Limited Company - Depositary Receipt (Common Stock) | 0.48 | 5.11 | 0.0753 | 0.0753 | |||||
| UHS / Universal Health Services, Inc. | 0.03 | 0.00 | 5.01 | -3.58 | 0.0738 | -0.0048 | |||
| BIIB / Biogen Inc. | 0.04 | -0.48 | 4.98 | -8.67 | 0.0734 | -0.0091 | |||
| MOH / Molina Healthcare, Inc. | 0.02 | 0.00 | 4.98 | -9.56 | 0.0734 | -0.0100 | |||
| CH1300646267 / Bunge Global SA | 0.06 | 0.00 | 4.96 | 5.04 | 0.0731 | 0.0016 | |||
| MRVL / Marvell Technology, Inc. | 0.06 | 0.00 | 4.87 | 25.72 | 0.0718 | 0.0131 | |||
| S+P 500 INDEX / DE (000000000) | 4.81 | 0.0709 | 0.0709 | ||||||
| S+P 500 INDEX / DE (000000000) | 4.81 | 0.0709 | 0.0709 | ||||||
| WST / West Pharmaceutical Services, Inc. | 0.02 | -56.36 | 4.71 | -57.36 | 0.0694 | -0.0978 | |||
| IJF / ICON Public Limited Company | 0.03 | -13.19 | 4.60 | -27.84 | 0.0678 | -0.0287 | |||
| SHOP / Shopify Inc. | 0.04 | 0.00 | 4.57 | 20.96 | 0.0674 | 0.0102 | |||
| S+P 500 INDEX / DE (000000000) | 4.39 | 0.0646 | 0.0646 | ||||||
| S+P 500 INDEX / DE (000000000) | 4.39 | 0.0646 | 0.0646 | ||||||
| USFD / US Foods Holding Corp. | 0.06 | 0.00 | 4.38 | 17.65 | 0.0646 | 0.0082 | |||
| ILMN / Illumina, Inc. | 0.05 | -18.04 | 4.31 | -1.44 | 0.0635 | -0.0027 | |||
| ALLY / Ally Financial Inc. | 0.11 | 0.00 | 4.15 | 6.81 | 0.0612 | 0.0023 | |||
| CELH / Celsius Holdings, Inc. | 0.09 | -27.34 | 4.00 | -5.37 | 0.0589 | -0.0050 | |||
| DKS / DICK'S Sporting Goods, Inc. | 0.02 | 0.00 | 3.99 | -1.85 | 0.0588 | -0.0027 | |||
| LULU / lululemon athletica inc. | 0.02 | -33.08 | 3.92 | -43.83 | 0.0578 | -0.0479 | |||
| FNF / Fidelity National Financial, Inc. | 0.07 | 0.00 | 3.74 | -13.86 | 0.0551 | -0.0106 | |||
| S+P 500 INDEX / DE (000000000) | 3.70 | 0.0545 | 0.0545 | ||||||
| S+P 500 INDEX / DE (000000000) | 3.70 | 0.0545 | 0.0545 | ||||||
| TWLO / Twilio Inc. | 0.03 | 112.04 | 3.61 | 169.38 | 0.0532 | 0.0329 | |||
| SMCI / Super Micro Computer, Inc. | 0.07 | -23.67 | 3.59 | 9.25 | 0.0530 | 0.0032 | |||
| JLL / Jones Lang LaSalle Incorporated | 0.01 | 3.14 | 0.0462 | 0.0462 | |||||
| ALV / Autoliv, Inc. | 0.03 | 0.00 | 3.10 | 26.52 | 0.0457 | 0.0086 | |||
| XYZ / Block, Inc. | 0.04 | 391.36 | 2.88 | 397.75 | 0.0424 | 0.0338 | |||
| OGE / OGE Energy Corp. | 0.06 | 0.00 | 2.72 | -3.41 | 0.0400 | -0.0025 | |||
| SUI / Sun Communities, Inc. | 0.02 | 35.09 | 2.71 | 32.86 | 0.0400 | 0.0086 | |||
| WPC / W. P. Carey Inc. | 0.04 | 2.41 | 0.0355 | 0.0355 | |||||
| 37C / CNH Industrial N.V. | 0.18 | 396.53 | 2.37 | 424.78 | 0.0350 | 0.0281 | |||
| CASY / Casey's General Stores, Inc. | 0.00 | 0.00 | 2.31 | 17.54 | 0.0341 | 0.0043 | |||
| BN / Brookfield Corporation | 0.04 | 0.00 | 2.28 | 18.00 | 0.0335 | 0.0043 | |||
| CCK / Crown Holdings, Inc. | 0.02 | 0.00 | 2.21 | 15.37 | 0.0326 | 0.0036 | |||
| WTRG / Essential Utilities, Inc. | 0.06 | 2.15 | 0.0317 | 0.0317 | |||||
| GLPI / Gaming and Leisure Properties, Inc. | 0.04 | 2.00 | 0.0294 | 0.0294 | |||||
| LAMR / Lamar Advertising Company | 0.01 | 1.70 | 0.0251 | 0.0251 | |||||
| MGA / Magna International Inc. | 0.04 | 1.68 | 0.0247 | 0.0247 | |||||
| QSR / Restaurant Brands International Inc. | 0.02 | 0.00 | 1.57 | -0.57 | 0.0232 | -0.0008 | |||
| TEVA / Teva Pharmaceutical Industries Limited - Depositary Receipt (Common Stock) | 0.07 | 681.23 | 1.16 | 752.21 | 0.0171 | 0.0150 | |||
| CBOE / Cboe Global Markets, Inc. | 0.00 | 0.85 | 0.0126 | 0.0126 | |||||
| ALNY / Alnylam Pharmaceuticals, Inc. | 0.00 | -1.72 | 0.65 | 18.80 | 0.0096 | 0.0013 | |||
| RACE / Ferrari N.V. | 0.00 | -32.74 | 0.62 | -22.93 | 0.0091 | -0.0030 | |||
| VOYA / Voya Financial, Inc. | 0.01 | -76.96 | 0.57 | -75.86 | 0.0084 | -0.0272 | |||
| BAH / Booz Allen Hamilton Holding Corporation | 0.00 | -15.30 | 0.48 | -15.76 | 0.0071 | -0.0015 | |||
| ARE / Alexandria Real Estate Equities, Inc. | 0.00 | -100.00 | 0.00 | -100.00 | -0.1334 | ||||
| CART / Maplebear Inc. | 0.00 | -100.00 | 0.00 | -100.00 | -0.0074 | ||||
| CEG / Constellation Energy Corporation | 0.00 | -100.00 | 0.00 | -100.00 | -0.1034 | ||||
| CCL / Carnival Corporation & plc | 0.00 | -100.00 | 0.00 | -100.00 | -0.0292 | ||||
| CAG / Conagra Brands, Inc. | 0.00 | -100.00 | 0.00 | -100.00 | -0.0567 | ||||
| YUMC / Yum China Holdings, Inc. | 0.00 | -100.00 | 0.00 | -100.00 | -0.0128 | ||||
| S+P 500 INDEX / DE (000000000) | -10.91 | -0.1608 | -0.1608 | ||||||
| S+P 500 INDEX / DE (000000000) | -10.91 | -0.1608 | -0.1608 | ||||||
| S+P 500 INDEX / DE (000000000) | -13.24 | -0.1952 | -0.1952 | ||||||
| S+P 500 INDEX / DE (000000000) | -13.24 | -0.1952 | -0.1952 | ||||||
| S+P 500 INDEX / DE (000000000) | -16.68 | -0.2458 | -0.2458 | ||||||
| S+P 500 INDEX / DE (000000000) | -16.68 | -0.2458 | -0.2458 | ||||||
| S+P 500 INDEX / DE (000000000) | -16.82 | -0.2478 | -0.2478 | ||||||
| S+P 500 INDEX / DE (000000000) | -16.82 | -0.2478 | -0.2478 | ||||||
| S+P 500 INDEX / DE (000000000) | -17.78 | -0.2620 | -0.2620 | ||||||
| S+P 500 INDEX / DE (000000000) | -17.78 | -0.2620 | -0.2620 | ||||||
| S+P 500 INDEX / DE (000000000) | -20.21 | -0.2979 | -0.2979 | ||||||
| S+P 500 INDEX / DE (000000000) | -20.21 | -0.2979 | -0.2979 | ||||||
| S+P 500 INDEX / DE (000000000) | -20.37 | -0.3002 | -0.3002 | ||||||
| S+P 500 INDEX / DE (000000000) | -20.37 | -0.3002 | -0.3002 | ||||||
| S+P 500 INDEX / DE (000000000) | -20.79 | -0.3064 | -0.3064 | ||||||
| S+P 500 INDEX / DE (000000000) | -20.79 | -0.3064 | -0.3064 | ||||||
| S+P 500 INDEX / DE (000000000) | -21.61 | -0.3184 | -0.3184 | ||||||
| S+P 500 INDEX / DE (000000000) | -21.61 | -0.3184 | -0.3184 |