Statistik Asas
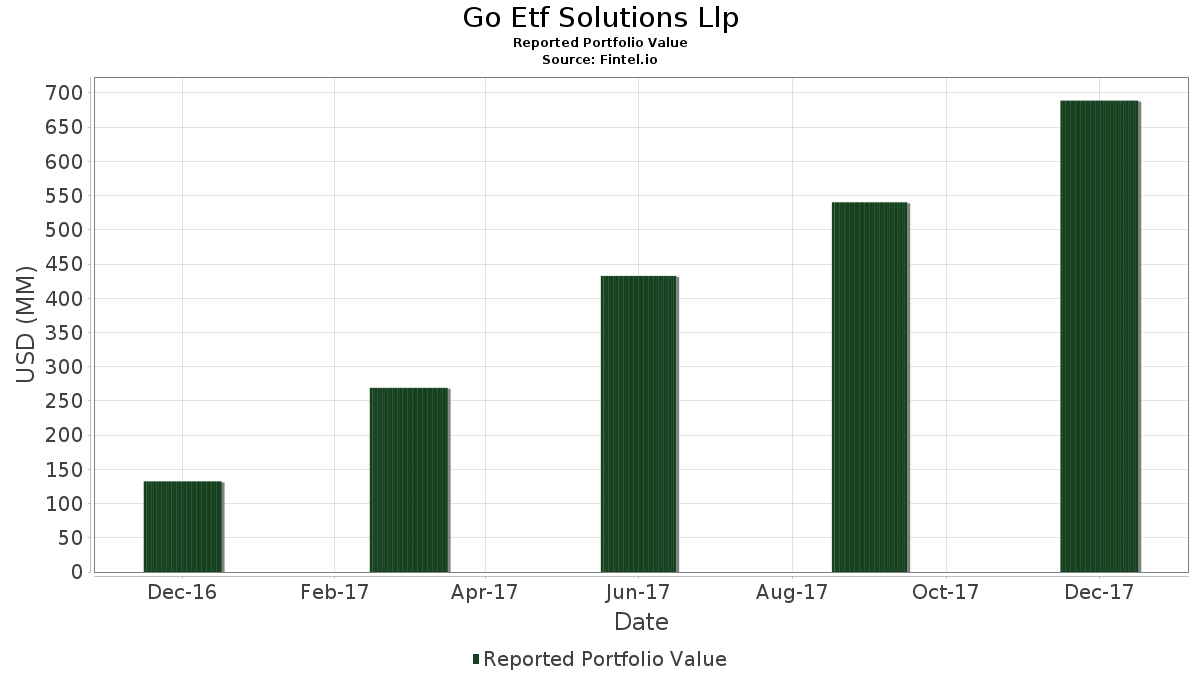
| Nilai Portfolio | $ 688,865,000 |
| Kedudukan Semasa | 62 |
Pegangan Terkini, Prestasi, AUM (dari 13F, 13D)
Go Etf Solutions Llp telah mendedahkan 62 jumlah pegangan dalam pemfailan SEC terkini mereka. Nilai portfolio terkini dikira sebagai $ 688,865,000 USD. Aset Sebenar Di Bawah Pengurusan (AUM) ialah nilai ini ditambah dengan tunai (yang tidak didedahkan). Pegangan teratas Go Etf Solutions Llp ialah iRobot Corporation (US:IRBT) , Oceaneering International, Inc. (US:OII) , IPG Photonics Corporation (US:IPGP) , Rockwell Automation, Inc. (US:ROK) , and Raven Industries, Inc. (US:RAVN) . Kedudukan baharu Go Etf Solutions Llp termasuk Novanta Inc. (US:NOVT) , Okta, Inc. (US:OKTA) , .
Kenaikan Teratas Suku Tahun Ini
Kami menggunakan perubahan dalam peruntukan portfolio kerana ini adalah metrik yang paling bermakna. Perubahan boleh disebabkan oleh perdagangan atau perubahan dalam harga saham.
| Sekuriti | Saham (MM) |
Nilai (MM$) |
Portfolio % | ΔPortfolio % |
|---|---|---|---|---|
| 0.23 | 13.72 | 1.9924 | 1.9924 | |
| 0.11 | 10.89 | 1.5804 | 1.5804 | |
| 0.21 | 10.60 | 1.5383 | 1.5383 | |
| 0.12 | 5.92 | 0.8598 | 0.8598 | |
| 0.12 | 5.81 | 0.8436 | 0.8436 | |
| 0.26 | 20.26 | 2.9409 | 0.7514 | |
| 0.18 | 5.16 | 0.7486 | 0.7486 | |
| 0.12 | 5.11 | 0.7421 | 0.7421 | |
| 0.18 | 4.64 | 0.6737 | 0.6737 | |
| 0.94 | 19.79 | 2.8727 | 0.5637 |
Penurunan Teratas Suku Tahun Ini
Kami menggunakan perubahan dalam peruntukan portfolio kerana ini adalah metrik yang paling bermakna. Perubahan boleh disebabkan oleh perdagangan atau perubahan dalam harga saham.
| Sekuriti | Saham (MM) |
Nilai (MM$) |
Portfolio % | ΔPortfolio % |
|---|---|---|---|---|
| 0.00 | 0.00 | -1.3825 | ||
| 0.00 | 0.00 | -1.3238 | ||
| 0.37 | 10.24 | 1.4872 | -0.7292 | |
| 0.71 | 10.14 | 1.4726 | -0.6315 | |
| 0.08 | 12.05 | 1.7491 | -0.3061 | |
| 0.09 | 5.57 | 0.8092 | -0.2250 | |
| 0.67 | 12.59 | 1.8274 | -0.1682 | |
| 0.26 | 12.44 | 1.8051 | -0.1662 | |
| 0.96 | 4.23 | 0.6136 | -0.1621 | |
| 1.50 | 8.81 | 1.2786 | -0.1539 |
13F dan Pemfailan Dana
Borang ini telah difailkan pada 2018-08-01 untuk tempoh pelaporan 2017-12-31. Klik ikon pautan untuk melihat sejarah transaksi penuh.
Tingkatkan untuk membuka data premium dan eksport ke Excel ![]() .
.
| Sekuriti | Jenis | Purata Harga Saham | Saham (MM) |
ΔSaham (%) |
ΔSaham (%) |
Nilai ($MM) |
Portfolio (%) |
ΔPortfolio (%) |
|
|---|---|---|---|---|---|---|---|---|---|
| IRBT / iRobot Corporation | 0.26 | 72.07 | 20.26 | 71.27 | 2.9409 | 0.7514 | |||
| OII / Oceaneering International, Inc. | 0.94 | 97.14 | 19.79 | 58.64 | 2.8727 | 0.5637 | |||
| IPGP / IPG Photonics Corporation | 0.09 | 26.40 | 18.40 | 46.26 | 2.6708 | 0.3424 | |||
| ROK / Rockwell Automation, Inc. | 0.09 | 29.68 | 17.95 | 42.87 | 2.6065 | 0.2803 | |||
| RAVN / Raven Industries, Inc. | 0.52 | 32.69 | 17.90 | 40.68 | 2.5980 | 0.2432 | |||
| HOLI / Hollysys Automation Technologies Ltd. | 0.77 | 28.60 | 17.24 | 32.52 | 2.5028 | 0.0946 | |||
| ZBRA / Zebra Technologies Corporation | 0.16 | 41.17 | 16.96 | 34.95 | 2.4627 | 0.1358 | |||
| ISRG / Intuitive Surgical, Inc. | 0.05 | 293.68 | 16.95 | 37.37 | 2.4611 | 0.1766 | |||
| CGNX / Cognex Corporation | 0.27 | 150.33 | 16.75 | 38.83 | 2.4321 | 0.1983 | |||
| AKAM / Akamai Technologies, Inc. | 0.25 | 18.79 | 15.99 | 58.59 | 2.3215 | 0.4549 | |||
| SPLK / Splunk Inc. | 0.18 | -0.49 | 14.94 | 24.09 | 2.1686 | -0.0598 | |||
| RDWR / Radware Ltd. | 0.71 | 20.88 | 13.78 | 39.09 | 2.0010 | 0.1666 | |||
| QLYS / Qualys, Inc. | 0.23 | -8.48 | 13.72 | 4.86 | 1.9924 | 1.9924 | |||
| SAIC / Science Applications International Corporation | 0.18 | 20.66 | 13.72 | 38.21 | 1.9918 | 0.1541 | |||
| CSCO / Cisco Systems, Inc. | 0.36 | 8.14 | 13.64 | 23.17 | 1.9805 | -0.0699 | |||
| RPD / Rapid7, Inc. | 0.67 | 10.13 | 12.59 | 16.76 | 1.8274 | -0.1682 | |||
| FARO / FARO Technologies, Inc. | 0.26 | -4.98 | 12.44 | 16.76 | 1.8051 | -0.1662 | |||
| JNPR / Juniper Networks, Inc. | 0.43 | 16.40 | 12.27 | 19.21 | 1.7809 | -0.1240 | |||
| PFPT / Proofpoint Inc | 0.14 | 15.67 | 12.20 | 17.79 | 1.7707 | -0.1462 | |||
| CYBR / CyberArk Software Ltd. | 0.29 | 41.56 | 12.09 | 42.91 | 1.7555 | 0.1892 | |||
| PANW / Palo Alto Networks, Inc. | 0.08 | 7.90 | 12.05 | 8.52 | 1.7491 | -0.3061 | |||
| HLX / Helix Energy Solutions Group, Inc. | 1.56 | 66.01 | 11.79 | 69.38 | 1.7114 | 0.4231 | |||
| NDSN / Nordson Corporation | 0.08 | 30.55 | 11.70 | 61.30 | 1.6990 | 0.3559 | |||
| MANH / Manhattan Associates, Inc. | 0.23 | 43.35 | 11.19 | 70.83 | 1.6238 | 0.4118 | |||
| IMPV / Imperva, Inc. | 0.28 | 28.11 | 10.96 | 17.19 | 1.5907 | -0.1401 | |||
| CHKP / Check Point Software Technologies Ltd. | 0.11 | 11.16 | 10.89 | 1.02 | 1.5804 | 1.5804 | |||
| OSPN / OneSpan Inc. | 0.77 | 34.25 | 10.77 | 54.85 | 1.5630 | 0.2760 | |||
| NUAN / Nuance Communications Inc | 0.65 | 53.10 | 10.65 | 59.25 | 1.5463 | 0.3082 | |||
| NOVT / Novanta Inc. | 0.21 | 10.60 | 1.5383 | 1.5383 | |||||
| TER / Teradyne, Inc. | 0.25 | 33.44 | 10.50 | 49.82 | 1.5248 | 0.2271 | |||
| DE / Deere & Company | 0.07 | 14.63 | 10.49 | 42.86 | 1.5232 | 0.1637 | |||
| NVDA / NVIDIA Corporation | 0.05 | 37.90 | 10.27 | 49.26 | 1.4907 | 0.2172 | |||
| NLOK / NortonLifeLock Inc | 0.37 | 0.05 | 10.24 | -14.44 | 1.4872 | -0.7292 | |||
| MCHP / Microchip Technology Incorporated | 0.12 | 50.32 | 10.22 | 47.15 | 1.4833 | 0.1980 | |||
| US3024451011 / FLIR Systems, Inc. | 0.22 | 25.91 | 10.21 | 50.86 | 1.4826 | 0.2294 | |||
| TDY / Teledyne Technologies Incorporated | 0.06 | 25.99 | 10.20 | 43.37 | 1.4800 | 0.1637 | |||
| JBT / JBT Marel Corporation | 0.09 | 26.99 | 10.18 | 39.18 | 1.4779 | 0.1239 | |||
| FEYE / FireEye Inc | 0.71 | 5.39 | 10.14 | -10.76 | 1.4726 | -0.6315 | |||
| QCOM / QUALCOMM Incorporated | 0.16 | 19.11 | 10.13 | 47.10 | 1.4702 | 0.1958 | |||
| AMBA / Ambarella, Inc. | 0.17 | 15.38 | 10.12 | 38.31 | 1.4691 | 0.1147 | |||
| US92220P1057 / Varian Medical Systems, Inc. | 0.09 | 39.21 | 10.09 | 54.65 | 1.4644 | 0.2570 | |||
| LECO / Lincoln Electric Holdings, Inc. | 0.11 | 43.42 | 10.07 | 43.26 | 1.4624 | 0.1608 | |||
| TRMB / Trimble Inc. | 0.25 | 41.10 | 10.02 | 46.09 | 1.4549 | 0.1851 | |||
| PTC / PTC Inc. | 0.16 | 29.86 | 10.01 | 40.22 | 1.4531 | 0.1317 | |||
| QGEN / Qiagen N.V. | 0.32 | 49.41 | 10.01 | 46.72 | 1.4528 | 0.1902 | |||
| XLNX / Xilinx, Inc. | 0.15 | 46.16 | 10.00 | 39.14 | 1.4512 | 0.1213 | |||
| BRKS / Brooks Automation, Inc. | 0.42 | 71.43 | 9.93 | 34.66 | 1.4421 | 0.0766 | |||
| NATI / National Instruments Corp. | 0.24 | 38.86 | 9.85 | 37.08 | 1.4296 | 0.0998 | |||
| CDNS / Cadence Design Systems, Inc. | 0.23 | 28.81 | 9.76 | 36.48 | 1.4164 | 0.0931 | |||
| SSYS / Stratasys Ltd. | 0.48 | 65.84 | 9.54 | 43.18 | 1.3845 | 0.1515 | |||
| DDD / 3D Systems Corporation | 1.07 | 110.92 | 9.21 | 36.10 | 1.3376 | 0.0844 | |||
| KEYW / KEYW Holdings Corp | 1.50 | 47.55 | 8.81 | 13.81 | 1.2786 | -0.1539 | |||
| VRNS / Varonis Systems, Inc. | 0.12 | -6.93 | 5.92 | 7.83 | 0.8598 | 0.8598 | |||
| MANT / Mantech International Corp - Class A | 0.12 | -1.75 | 5.81 | 11.69 | 0.8436 | 0.8436 | |||
| LDOS / Leidos Holdings, Inc. | 0.09 | -8.50 | 5.57 | -0.23 | 0.8092 | -0.2250 | |||
| FFIV / F5, Inc. | 0.04 | 10.48 | 5.56 | 20.25 | 0.8077 | -0.0488 | |||
| US60739U2042 / MobileIron, Inc. | 1.38 | 71.41 | 5.39 | 80.68 | 0.7822 | 0.2302 | |||
| MIME / Mimecast Ltd | 0.18 | -1.22 | 5.16 | -0.35 | 0.7486 | 0.7486 | |||
| VRNT / Verint Systems Inc. | 0.12 | 1.95 | 5.11 | 1.95 | 0.7421 | 0.7421 | |||
| OKTA / Okta, Inc. | 0.18 | 4.64 | 0.6737 | 0.6737 | |||||
| ZIXI / Zix Corp. | 0.96 | 12.59 | 4.23 | 0.86 | 0.6136 | -0.1621 | |||
| US3021041047 / ExOne Co | 0.15 | -63.93 | 1.27 | -73.32 | 0.1849 | 0.1849 | |||
| FTI / TechnipFMC plc | 0.00 | -100.00 | 0.00 | -100.00 | -1.3238 | ||||
| NOC / Northrop Grumman Corporation | 0.00 | -100.00 | 0.00 | -100.00 | -1.3825 | ||||
| MBLY / Mobileye Global Inc. | 0.00 | 0.00 | 0.0000 | ||||||
| IMMR / Immersion Corporation | 0.00 | -100.00 | 0.00 | -100.00 | 0.0000 |