Statistik Asas
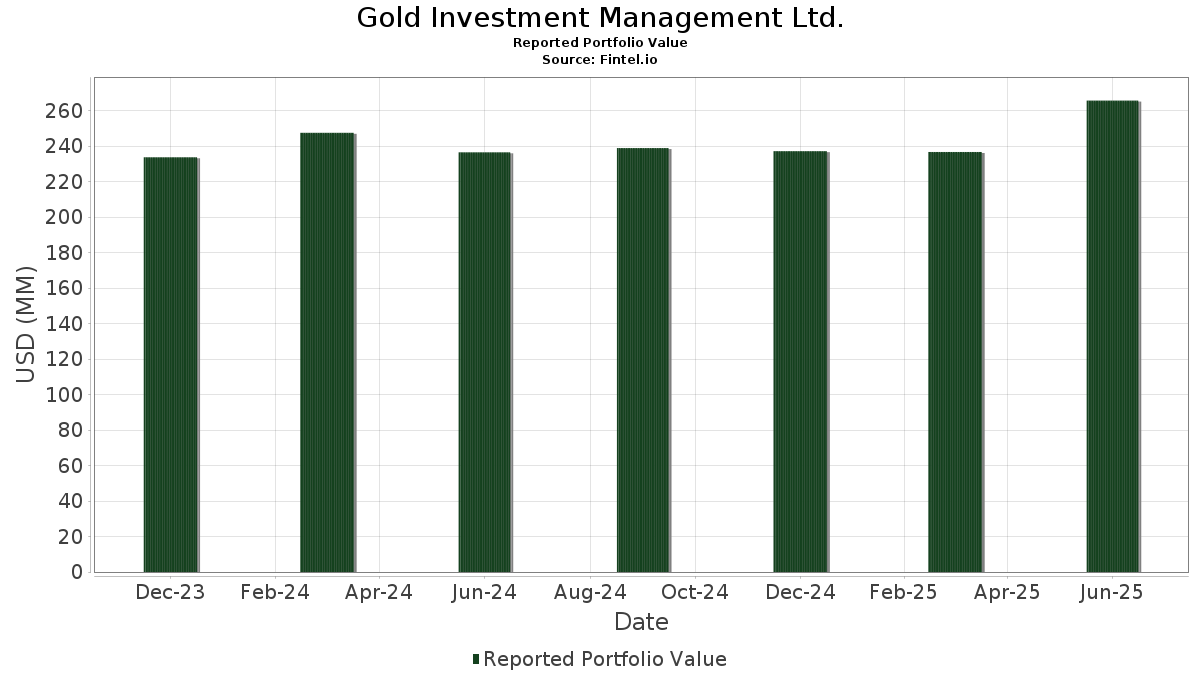
| Nilai Portfolio | $ 265,615,376 |
| Kedudukan Semasa | 203 |
Pegangan Terkini, Prestasi, AUM (dari 13F, 13D)
Gold Investment Management Ltd. telah mendedahkan 203 jumlah pegangan dalam pemfailan SEC terkini mereka. Nilai portfolio terkini dikira sebagai $ 265,615,376 USD. Aset Sebenar Di Bawah Pengurusan (AUM) ialah nilai ini ditambah dengan tunai (yang tidak didedahkan). Pegangan teratas Gold Investment Management Ltd. ialah Microsoft Corporation (US:MSFT) , Taiwan Semiconductor Manufacturing Company Limited - Depositary Receipt (Common Stock) (US:TSM) , The Toronto-Dominion Bank (US:TD) , The Bank of Nova Scotia (US:BNS) , and Canadian Pacific Kansas City Limited (US:CP) . Kedudukan baharu Gold Investment Management Ltd. termasuk Barrick Mining Corporation (US:B) , Emera Incorporated (CA:EMA) , .
Kenaikan Teratas Suku Tahun Ini
Kami menggunakan perubahan dalam peruntukan portfolio kerana ini adalah metrik yang paling bermakna. Perubahan boleh disebabkan oleh perdagangan atau perubahan dalam harga saham.
| Sekuriti | Saham (MM) |
Nilai (MM$) |
Portfolio % | ΔPortfolio % |
|---|---|---|---|---|
| 0.02 | 5.74 | 2.1595 | 0.9165 | |
| 0.04 | 9.25 | 3.4812 | 0.8130 | |
| 0.02 | 9.66 | 3.6373 | 0.7039 | |
| 0.02 | 3.31 | 1.2480 | 0.4883 | |
| 0.03 | 5.67 | 2.1333 | 0.4272 | |
| 0.04 | 3.18 | 1.1976 | 0.3663 | |
| 0.01 | 2.04 | 0.7696 | 0.3647 | |
| 0.11 | 8.46 | 3.1843 | 0.3103 | |
| 0.04 | 3.34 | 1.2573 | 0.2483 | |
| 0.01 | 1.43 | 0.5366 | 0.2416 |
Penurunan Teratas Suku Tahun Ini
Kami menggunakan perubahan dalam peruntukan portfolio kerana ini adalah metrik yang paling bermakna. Perubahan boleh disebabkan oleh perdagangan atau perubahan dalam harga saham.
| Sekuriti | Saham (MM) |
Nilai (MM$) |
Portfolio % | ΔPortfolio % |
|---|---|---|---|---|
| 0.00 | 0.06 | 0.0208 | -0.7625 | |
| 0.01 | 2.00 | 0.7541 | -0.6388 | |
| 0.03 | 1.36 | 0.5125 | -0.6372 | |
| 0.01 | 1.59 | 0.6005 | -0.3499 | |
| 0.06 | 3.26 | 1.2286 | -0.3092 | |
| 0.00 | 0.07 | 0.0264 | -0.3062 | |
| 0.15 | 5.63 | 2.1194 | -0.2890 | |
| 0.02 | 4.77 | 1.7968 | -0.2348 | |
| 0.02 | 2.91 | 1.0970 | -0.2002 | |
| 0.01 | 1.54 | 0.5805 | -0.1804 |
13F dan Pemfailan Dana
Borang ini telah difailkan pada 2025-07-18 untuk tempoh pelaporan 2025-06-30. Klik ikon pautan untuk melihat sejarah transaksi penuh.
Tingkatkan untuk membuka data premium dan eksport ke Excel ![]() .
.
| Sekuriti | Jenis | Purata Harga Saham | Saham (MM) |
ΔSaham (%) |
ΔSaham (%) |
Nilai ($MM) |
Portfolio (%) |
ΔPortfolio (%) |
|
|---|---|---|---|---|---|---|---|---|---|
| MSFT / Microsoft Corporation | 0.02 | 5.70 | 9.66 | 39.17 | 3.6373 | 0.7039 | |||
| TSM / Taiwan Semiconductor Manufacturing Company Limited - Depositary Receipt (Common Stock) | 0.04 | 7.81 | 9.25 | 46.44 | 3.4812 | 0.8130 | |||
| TD / The Toronto-Dominion Bank | 0.11 | 1.18 | 8.46 | 24.36 | 3.1843 | 0.3103 | |||
| BNS / The Bank of Nova Scotia | 0.14 | 2.75 | 7.88 | 19.77 | 2.9657 | 0.1864 | |||
| CP / Canadian Pacific Kansas City Limited | 0.08 | 1.52 | 6.72 | 15.57 | 2.5297 | 0.0726 | |||
| MFC / Manulife Financial Corporation | 0.19 | 1.75 | 6.23 | 4.34 | 2.3450 | -0.1773 | |||
| BN / Brookfield Corporation | 0.10 | 0.78 | 6.12 | 18.65 | 2.3025 | 0.1244 | |||
| RY / Royal Bank of Canada | 0.05 | 1.74 | 6.11 | 19.32 | 2.3016 | 0.1365 | |||
| TSLA / Tesla, Inc. | 0.02 | 68.05 | 5.74 | 95.04 | 2.1595 | 0.9165 | |||
| AMAT / Applied Materials, Inc. | 0.03 | 11.02 | 5.67 | 40.35 | 2.1333 | 0.4272 | |||
| SU / Suncor Energy Inc. | 0.15 | 2.15 | 5.63 | -1.23 | 2.1194 | -0.2890 | |||
| JPM / JPMorgan Chase & Co. | 0.02 | 1.35 | 5.63 | 19.96 | 2.1181 | 0.1360 | |||
| BIP / Brookfield Infrastructure Partners L.P. - Limited Partnership | 0.16 | 4.01 | 5.50 | 17.06 | 2.0695 | 0.0852 | |||
| CNI / Canadian National Railway Company | 0.05 | 1.38 | 5.32 | 8.70 | 2.0048 | -0.0653 | |||
| UNP / Union Pacific Corporation | 0.02 | 0.51 | 4.77 | -0.73 | 1.7968 | -0.2348 | |||
| LMT / Lockheed Martin Corporation | 0.01 | 5.68 | 4.38 | 10.04 | 1.6506 | -0.0331 | |||
| GRPU / Granite Real Estate Investment Trust | 0.08 | -0.48 | 4.22 | 8.46 | 1.5886 | -0.0555 | |||
| BAC / Bank of America Corporation | 0.09 | 0.18 | 4.21 | 14.28 | 1.5850 | 0.0283 | |||
| WMT / Walmart Inc. | 0.04 | 1.29 | 4.08 | 13.10 | 1.5345 | 0.0118 | |||
| CM / Canadian Imperial Bank of Commerce | 0.06 | 0.59 | 4.04 | 26.87 | 1.5219 | 0.1754 | |||
| CSX / CSX Corporation | 0.12 | 2.07 | 4.00 | 14.42 | 1.5063 | 0.0288 | |||
| VEA / Vanguard Tax-Managed Funds - Vanguard FTSE Developed Markets ETF | 0.07 | -0.45 | 3.79 | 11.63 | 1.4276 | -0.0076 | |||
| FTS / Fortis Inc. | 0.08 | 2.18 | 3.66 | 7.05 | 1.3786 | -0.0668 | |||
| SPY / SPDR S&P 500 ETF | 0.01 | 1.53 | 3.61 | 12.17 | 1.3606 | -0.0013 | |||
| NDAQ / Nasdaq, Inc. | 0.04 | 19.17 | 3.34 | 39.88 | 1.2573 | 0.2483 | |||
| ENB / Enbridge Inc. | 0.07 | 1.54 | 3.33 | 4.00 | 1.2537 | -0.0996 | |||
| ORCL / Oracle Corporation | 0.02 | 17.80 | 3.31 | 84.42 | 1.2480 | 0.4883 | |||
| EMXC / iShares, Inc. - iShares MSCI Emerging Markets ex China ETF | 0.05 | 6.20 | 3.27 | 21.91 | 1.2321 | 0.0979 | |||
| O / Realty Income Corporation | 0.06 | -9.97 | 3.26 | -10.33 | 1.2286 | -0.3092 | |||
| IEFA / iShares Trust - iShares Core MSCI EAFE ETF | 0.04 | 46.70 | 3.18 | 61.72 | 1.1976 | 0.3663 | |||
| MA / Mastercard Incorporated | 0.01 | 2.12 | 3.06 | 4.97 | 1.1530 | -0.0796 | |||
| BCE / BCE Inc. | 0.14 | 5.82 | 3.03 | 2.19 | 1.1417 | -0.1123 | |||
| GS / The Goldman Sachs Group, Inc. | 0.00 | 2.29 | 3.00 | 32.38 | 1.1286 | 0.1716 | |||
| CNQ / Canadian Natural Resources Limited | 0.09 | 1.43 | 2.97 | 4.29 | 1.1181 | -0.0853 | |||
| CSCO / Cisco Systems, Inc. | 0.04 | -0.73 | 2.95 | 11.33 | 1.1096 | -0.0093 | |||
| AMZN / Amazon.com, Inc. | 0.01 | -0.44 | 2.94 | 15.07 | 1.1070 | 0.0273 | |||
| TM / Toyota Motor Corporation - Depositary Receipt (Common Stock) | 0.02 | 23.98 | 2.92 | 20.70 | 1.0977 | 0.0769 | |||
| JNJ / Johnson & Johnson | 0.02 | 1.51 | 2.91 | -5.08 | 1.0970 | -0.2002 | |||
| MDT / Medtronic plc | 0.03 | 1.64 | 2.91 | -0.03 | 1.0941 | -0.1343 | |||
| VXUS / Vanguard STAR Funds - Vanguard Total International Stock ETF | 0.04 | 0.72 | 2.86 | 12.12 | 1.0765 | -0.0014 | |||
| SLF / Sun Life Financial Inc. | 0.04 | 0.60 | 2.72 | 16.91 | 1.0257 | 0.0409 | |||
| MKL / Markel Group Inc. | 0.00 | 3.10 | 2.65 | 10.04 | 0.9991 | -0.0201 | |||
| BAM / Brookfield Asset Management Ltd. | 0.05 | 2.52 | 2.58 | 15.72 | 0.9699 | 0.0290 | |||
| DLR / Digital Realty Trust, Inc. | 0.01 | -7.72 | 2.54 | 10.60 | 0.9550 | -0.0141 | |||
| NSC / Norfolk Southern Corporation | 0.01 | 2.88 | 2.53 | 12.68 | 0.9540 | 0.0038 | |||
| GDXD / MicroSectors Gold Miners -3X Inverse Leveraged ETNs due June 29, 2040 | 0.02 | 0.95 | 2.49 | 17.11 | 0.9359 | 0.0391 | |||
| BLK / BlackRock, Inc. | 0.00 | 2.74 | 2.48 | 14.21 | 0.9355 | 0.0164 | |||
| BEP / Brookfield Renewable Partners L.P. - Limited Partnership | 0.10 | 3.04 | 2.43 | 18.58 | 0.9133 | 0.0490 | |||
| LLY / Eli Lilly and Company | 0.00 | 0.00 | 2.24 | -6.04 | 0.8433 | -0.1642 | |||
| IMO / Imperial Oil Limited | 0.03 | 0.28 | 2.24 | 10.20 | 0.8421 | -0.0154 | |||
| C / Citigroup Inc. | 0.03 | 0.38 | 2.16 | 21.27 | 0.8136 | 0.0602 | |||
| AVGO / Broadcom Inc. | 0.01 | 31.82 | 2.04 | 113.36 | 0.7696 | 0.3647 | |||
| XLK / The Select Sector SPDR Trust - The Technology Select Sector SPDR Fund | 0.01 | -50.02 | 2.00 | -39.23 | 0.7541 | -0.6388 | |||
| BRK.B / Berkshire Hathaway Inc. | 0.00 | -0.21 | 1.84 | -8.58 | 0.6939 | -0.1582 | |||
| GD / General Dynamics Corporation | 0.01 | 14.35 | 1.81 | 22.86 | 0.6802 | 0.0589 | |||
| TU / TELUS Corporation | 0.11 | -1.35 | 1.80 | 10.39 | 0.6760 | -0.0112 | |||
| V / Visa Inc. | 0.00 | 0.02 | 1.63 | 1.37 | 0.6149 | -0.0659 | |||
| SOXX / iShares Trust - iShares Semiconductor ETF | 0.01 | -43.85 | 1.59 | -29.12 | 0.6005 | -0.3499 | |||
| MAA / Mid-America Apartment Communities, Inc. | 0.01 | -3.54 | 1.54 | -14.39 | 0.5805 | -0.1804 | |||
| TAK / Takeda Pharmaceutical Company Limited - Depositary Receipt (Common Stock) | 0.10 | 2.55 | 1.54 | 6.21 | 0.5800 | -0.0330 | |||
| ABBV / AbbVie Inc. | 0.01 | 0.32 | 1.51 | -10.21 | 0.5693 | -0.1423 | |||
| ASML / ASML Holding N.V. - Depositary Receipt (Common Stock) | 0.00 | 44.47 | 1.46 | 74.34 | 0.5502 | 0.1957 | |||
| LRCX / Lam Research Corporation | 0.01 | 52.72 | 1.43 | 104.15 | 0.5366 | 0.2416 | |||
| ABT / Abbott Laboratories | 0.01 | 0.27 | 1.41 | 2.91 | 0.5326 | -0.0482 | |||
| XLF / The Select Sector SPDR Trust - The Financial Select Sector SPDR Fund | 0.03 | -52.67 | 1.36 | -49.96 | 0.5125 | -0.6372 | |||
| PFE / Pfizer Inc. | 0.05 | 0.15 | 1.31 | -1.80 | 0.4945 | -0.0709 | |||
| MRK / Merck & Co., Inc. | 0.02 | 0.80 | 1.25 | -9.23 | 0.4704 | -0.1114 | |||
| NOC / Northrop Grumman Corporation | 0.00 | 21.69 | 1.16 | 19.07 | 0.4352 | 0.0252 | |||
| KLAC / KLA Corporation | 0.00 | 76.19 | 1.13 | 132.58 | 0.4247 | 0.2196 | |||
| BBU / Brookfield Business Partners L.P. - Limited Partnership | 0.04 | 6.83 | 1.09 | 18.70 | 0.4113 | 0.0221 | |||
| IVZ / Invesco Ltd. | 0.07 | 4.12 | 1.07 | 10.87 | 0.4034 | -0.0049 | |||
| VTR / Ventas, Inc. | 0.02 | -8.93 | 1.05 | -16.61 | 0.3970 | -0.1374 | |||
| HON / Honeywell International Inc. | 0.00 | 0.11 | 1.04 | 11.43 | 0.3928 | -0.0031 | |||
| OMC / Omnicom Group Inc. | 0.01 | 6.26 | 1.03 | -5.68 | 0.3877 | -0.0733 | |||
| AAPL / Apple Inc. | 0.00 | 0.08 | 0.99 | -6.67 | 0.3742 | -0.0755 | |||
| GOOG / Alphabet Inc. | 0.01 | -0.09 | 0.99 | 13.37 | 0.3736 | 0.0035 | |||
| BEN / Franklin Resources, Inc. | 0.04 | 4.54 | 0.97 | 32.33 | 0.3638 | 0.0549 | |||
| VWO / Vanguard International Equity Index Funds - Vanguard FTSE Emerging Markets ETF | 0.02 | 1.25 | 0.96 | 11.21 | 0.3622 | -0.0035 | |||
| RCI / Rogers Communications Inc. | 0.03 | -4.53 | 0.85 | 5.99 | 0.3198 | -0.0189 | |||
| NVDA / NVIDIA Corporation | 0.01 | -0.35 | 0.84 | 41.15 | 0.3151 | 0.0642 | |||
| AMD / Advanced Micro Devices, Inc. | 0.01 | 65.90 | 0.73 | 126.01 | 0.2749 | 0.1383 | |||
| WCN / Waste Connections, Inc. | 0.00 | 0.00 | 0.62 | -4.21 | 0.2316 | -0.0398 | |||
| PSA / Public Storage | 0.00 | -19.32 | 0.59 | -19.81 | 0.2227 | -0.0889 | |||
| BMY / Bristol-Myers Squibb Company | 0.01 | 0.00 | 0.58 | -23.32 | 0.2192 | -0.1016 | |||
| AEM / Agnico Eagle Mines Limited | 0.00 | 0.59 | 0.57 | 10.70 | 0.2142 | -0.0033 | |||
| IEMG / iShares, Inc. - iShares Core MSCI Emerging Markets ETF | 0.01 | 0.59 | 0.57 | 12.08 | 0.2133 | -0.0004 | |||
| TFII / TFI International Inc. | 0.01 | 0.00 | 0.57 | 15.78 | 0.2129 | 0.0067 | |||
| RTX / RTX Corporation | 0.00 | 0.00 | 0.49 | 8.95 | 0.1834 | -0.0057 | |||
| TRP / TC Energy Corporation | 0.01 | 2.46 | 0.47 | 5.84 | 0.1774 | -0.0107 | |||
| FNV / Franco-Nevada Corporation | 0.00 | 0.15 | 0.44 | 4.50 | 0.1663 | -0.0123 | |||
| LHX / L3Harris Technologies, Inc. | 0.00 | 108.39 | 0.44 | 151.15 | 0.1646 | 0.0908 | |||
| META / Meta Platforms, Inc. | 0.00 | -2.36 | 0.42 | 23.75 | 0.1590 | 0.0148 | |||
| PBA / Pembina Pipeline Corporation | 0.01 | 0.39 | 0.41 | -5.92 | 0.1558 | -0.0299 | |||
| WELL / Welltower Inc. | 0.00 | -41.78 | 0.39 | -41.75 | 0.1452 | -0.1344 | |||
| STN / Stantec Inc. | 0.00 | 0.00 | 0.37 | 31.21 | 0.1395 | 0.0202 | |||
| COST / Costco Wholesale Corporation | 0.00 | 0.00 | 0.32 | 4.23 | 0.1206 | -0.0092 | |||
| ILF / iShares Trust - iShares Latin America 40 ETF | 0.01 | -0.19 | 0.31 | 11.39 | 0.1180 | -0.0012 | |||
| CCJ / Cameco Corporation | 0.00 | 0.00 | 0.31 | 80.59 | 0.1156 | 0.0436 | |||
| VNQ / Vanguard Specialized Funds - Vanguard Real Estate ETF | 0.00 | -5.53 | 0.30 | -6.58 | 0.1125 | -0.0224 | |||
| B / Barrick Mining Corporation | 0.01 | 0.30 | 0.1124 | 0.1124 | |||||
| AMGN / Amgen Inc. | 0.00 | 0.00 | 0.27 | -8.50 | 0.1016 | -0.0228 | |||
| MMM / 3M Company | 0.00 | 0.06 | 0.27 | 3.88 | 0.1011 | -0.0081 | |||
| CVE / Cenovus Energy Inc. | 0.02 | 0.84 | 0.27 | -1.11 | 0.1007 | -0.0136 | |||
| MS / Morgan Stanley | 0.00 | 0.00 | 0.26 | 20.83 | 0.0986 | 0.0071 | |||
| MCD / McDonald's Corporation | 0.00 | 0.35 | 0.25 | -4.15 | 0.0956 | -0.0167 | |||
| LIN / Linde plc | 0.00 | 0.00 | 0.24 | 2.17 | 0.0888 | -0.0085 | |||
| IJH / iShares Trust - iShares Core S&P Mid-Cap ETF | 0.00 | 0.00 | 0.23 | 7.37 | 0.0881 | -0.0038 | |||
| BDX / Becton, Dickinson and Company | 0.00 | 0.00 | 0.20 | -24.81 | 0.0745 | -0.0366 | |||
| WFG / West Fraser Timber Co. Ltd. | 0.00 | 0.00 | 0.20 | -4.37 | 0.0743 | -0.0131 | |||
| TXN / Texas Instruments Incorporated | 0.00 | -2.69 | 0.19 | 13.77 | 0.0718 | 0.0011 | |||
| XLV / The Select Sector SPDR Trust - The Health Care Select Sector SPDR Fund | 0.00 | 0.00 | 0.18 | -6.25 | 0.0680 | -0.0135 | |||
| WPM / Wheaton Precious Metals Corp. | 0.00 | 0.36 | 0.18 | 16.45 | 0.0668 | 0.0023 | |||
| EQIX / Equinix, Inc. | 0.00 | 0.00 | 0.18 | -2.76 | 0.0665 | -0.0100 | |||
| XOM / Exxon Mobil Corporation | 0.00 | 0.88 | 0.17 | -7.45 | 0.0657 | -0.0139 | |||
| HD / The Home Depot, Inc. | 0.00 | 0.00 | 0.17 | 1.83 | 0.0632 | -0.0065 | |||
| IBIT / iShares Bitcoin Trust ETF | 0.00 | 46.08 | 0.16 | 86.21 | 0.0613 | 0.0245 | |||
| MET / MetLife, Inc. | 0.00 | 0.00 | 0.16 | 0.64 | 0.0598 | -0.0067 | |||
| PG / The Procter & Gamble Company | 0.00 | 0.22 | 0.15 | -5.19 | 0.0552 | -0.0102 | |||
| MRVL / Marvell Technology, Inc. | 0.00 | 0.00 | 0.14 | 23.42 | 0.0519 | 0.0049 | |||
| PM / Philip Morris International Inc. | 0.00 | 0.00 | 0.13 | 11.76 | 0.0501 | -0.0002 | |||
| GOOGL / Alphabet Inc. | 0.00 | 0.00 | 0.13 | 13.04 | 0.0493 | 0.0006 | |||
| TER / Teradyne, Inc. | 0.00 | 0.00 | 0.13 | 11.11 | 0.0492 | -0.0004 | |||
| BX / Blackstone Inc. | 0.00 | -26.66 | 0.13 | -20.37 | 0.0489 | -0.0196 | |||
| STAG / STAG Industrial, Inc. | 0.00 | -35.53 | 0.13 | -35.23 | 0.0474 | -0.0343 | |||
| NNN / NNN REIT, Inc. | 0.00 | -64.02 | 0.12 | -63.32 | 0.0441 | -0.0907 | |||
| VOO / Vanguard Index Funds - Vanguard S&P 500 ETF | 0.00 | 0.00 | 0.11 | 9.80 | 0.0425 | -0.0007 | |||
| PNC / The PNC Financial Services Group, Inc. | 0.00 | 0.00 | 0.11 | 8.74 | 0.0425 | -0.0011 | |||
| TECK / Teck Resources Limited | 0.00 | 0.04 | 0.11 | 10.53 | 0.0397 | -0.0005 | |||
| NTR / Nutrien Ltd. | 0.00 | 6.69 | 0.10 | 24.10 | 0.0392 | 0.0041 | |||
| TMO / Thermo Fisher Scientific Inc. | 0.00 | 0.00 | 0.10 | -14.78 | 0.0370 | -0.0120 | |||
| PEP / PepsiCo, Inc. | 0.00 | 0.61 | 0.09 | -9.28 | 0.0335 | -0.0079 | |||
| ALB / Albemarle Corporation | 0.00 | 0.00 | 0.08 | -13.33 | 0.0297 | -0.0086 | |||
| SLV / iShares Silver Trust | 0.00 | 0.00 | 0.08 | 5.56 | 0.0287 | -0.0018 | |||
| CG / The Carlyle Group Inc. | 0.00 | 0.00 | 0.07 | 20.00 | 0.0275 | 0.0020 | |||
| BA / The Boeing Company | 0.00 | 0.00 | 0.07 | 22.03 | 0.0273 | 0.0024 | |||
| XLI / The Select Sector SPDR Trust - The Industrial Select Sector SPDR Fund | 0.00 | -92.09 | 0.07 | -91.11 | 0.0264 | -0.3062 | |||
| TRI / Thomson Reuters Corporation | 0.00 | 0.00 | 0.07 | 15.52 | 0.0254 | 0.0009 | |||
| NEM / Newmont Corporation | 0.00 | 0.00 | 0.06 | 23.08 | 0.0242 | 0.0019 | |||
| KO / The Coca-Cola Company | 0.00 | 0.52 | 0.06 | 0.00 | 0.0209 | -0.0024 | |||
| QQQ / Invesco QQQ Trust, Series 1 | 0.00 | -97.44 | 0.06 | -97.03 | 0.0208 | -0.7625 | |||
| GM / General Motors Company | 0.00 | 0.00 | 0.05 | 10.20 | 0.0206 | -0.0003 | |||
| CVX / Chevron Corporation | 0.00 | 0.00 | 0.05 | -12.73 | 0.0181 | -0.0052 | |||
| LXP / LXP Industrial Trust | 0.01 | 1.48 | 0.04 | -2.27 | 0.0163 | -0.0024 | |||
| COP / ConocoPhillips | 0.00 | 0.00 | 0.04 | -11.11 | 0.0151 | -0.0043 | |||
| XLY / The Select Sector SPDR Trust - The Consumer Discretionary Select Sector SPDR Fund | 0.00 | -85.11 | 0.04 | -83.62 | 0.0144 | -0.0837 | |||
| DIS / The Walt Disney Company | 0.00 | 0.00 | 0.04 | 26.67 | 0.0143 | 0.0015 | |||
| MGA / Magna International Inc. | 0.00 | -21.60 | 0.04 | -11.90 | 0.0142 | -0.0037 | |||
| AVB / AvalonBay Communities, Inc. | 0.00 | -52.91 | 0.04 | -55.56 | 0.0136 | -0.0206 | |||
| CMCSA / Comcast Corporation | 0.00 | 0.00 | 0.04 | 0.00 | 0.0136 | -0.0019 | |||
| CME / CME Group Inc. | 0.00 | 0.00 | 0.03 | 3.03 | 0.0130 | -0.0011 | |||
| GILD / Gilead Sciences, Inc. | 0.00 | 0.00 | 0.03 | 0.00 | 0.0118 | -0.0015 | |||
| GLD / SPDR Gold Trust | 0.00 | 0.00 | 0.03 | 7.14 | 0.0113 | -0.0006 | |||
| AMT / American Tower Corporation | 0.00 | 0.00 | 0.03 | 3.57 | 0.0111 | -0.0010 | |||
| EMA / Emera Incorporated | 0.00 | 0.03 | 0.0099 | 0.0099 | |||||
| GE / General Electric Company | 0.00 | 0.00 | 0.02 | 20.00 | 0.0094 | 0.0009 | |||
| ETN / Eaton Corporation plc | 0.00 | 0.00 | 0.02 | 25.00 | 0.0079 | 0.0011 | |||
| USB / U.S. Bancorp | 0.00 | 0.00 | 0.02 | 11.11 | 0.0079 | -0.0002 | |||
| MKC / McCormick & Company, Incorporated | 0.00 | 0.00 | 0.02 | -5.00 | 0.0073 | -0.0014 | |||
| UDR / UDR, Inc. | 0.00 | 0.00 | 0.02 | -10.00 | 0.0068 | -0.0017 | |||
| EQR / Equity Residential | 0.00 | 0.00 | 0.02 | -5.56 | 0.0064 | -0.0012 | |||
| VCSH / Vanguard Scottsdale Funds - Vanguard Short-Term Corporate Bond ETF | 0.00 | 0.00 | 0.02 | 0.00 | 0.0060 | -0.0007 | |||
| TJX / The TJX Companies, Inc. | 0.00 | 0.00 | 0.01 | 7.69 | 0.0053 | -0.0005 | |||
| TTE / TotalEnergies SE - Depositary Receipt (Common Stock) | 0.00 | 0.00 | 0.01 | 0.00 | 0.0047 | -0.0008 | |||
| BIPC / Brookfield Infrastructure Corporation | 0.00 | 13.95 | 0.01 | 33.33 | 0.0046 | 0.0007 | |||
| AXP / American Express Company | 0.00 | 0.00 | 0.01 | 25.00 | 0.0040 | 0.0003 | |||
| BK / The Bank of New York Mellon Corporation | 0.00 | 0.00 | 0.01 | 12.50 | 0.0034 | -0.0001 | |||
| PLD / Prologis, Inc. | 0.00 | 0.00 | 0.01 | -11.11 | 0.0033 | -0.0006 | |||
| CRM / Salesforce, Inc. | 0.00 | 0.00 | 0.01 | 0.00 | 0.0032 | -0.0003 | |||
| BSX / Boston Scientific Corporation | 0.00 | 0.00 | 0.01 | 0.00 | 0.0030 | -0.0002 | |||
| SPG / Simon Property Group, Inc. | 0.00 | 0.00 | 0.01 | 0.00 | 0.0028 | -0.0004 | |||
| BP / BP p.l.c. - Depositary Receipt (Common Stock) | 0.00 | 1.71 | 0.01 | 0.00 | 0.0027 | -0.0006 | |||
| NVO / Novo Nordisk A/S - Depositary Receipt (Common Stock) | 0.00 | 0.00 | 0.01 | 0.00 | 0.0026 | -0.0003 | |||
| XLP / The Select Sector SPDR Trust - The Consumer Staples Select Sector SPDR Fund | 0.00 | 0.00 | 0.01 | 0.00 | 0.0026 | -0.0003 | |||
| ADBE / Adobe Inc. | 0.00 | 0.00 | 0.01 | 0.00 | 0.0025 | -0.0002 | |||
| ITW / Illinois Tool Works Inc. | 0.00 | 0.00 | 0.01 | 20.00 | 0.0023 | -0.0002 | |||
| XLRE / The Select Sector SPDR Trust - The Real Estate Select Sector SPDR Fund | 0.00 | 0.00 | 0.01 | 0.00 | 0.0023 | -0.0003 | |||
| VET / Vermilion Energy Inc. | 0.00 | 0.00 | 0.01 | -16.67 | 0.0022 | -0.0005 | |||
| SGOV / iShares Trust - iShares 0-3 Month Treasury Bond ETF | 0.00 | 1.75 | 0.01 | 0.00 | 0.0022 | -0.0002 | |||
| SOBO / South Bow Corporation | 0.00 | -0.46 | 0.01 | 0.00 | 0.0021 | -0.0002 | |||
| XLC / The Select Sector SPDR Trust - The Communication Services Select Sector SPDR Fund | 0.00 | 0.00 | 0.01 | 25.00 | 0.0020 | -0.0000 | |||
| MOS / The Mosaic Company | 0.00 | 0.00 | 0.01 | 66.67 | 0.0020 | 0.0004 | |||
| CMI / Cummins Inc. | 0.00 | 0.00 | 0.00 | 0.00 | 0.0019 | -0.0001 | |||
| DEO / Diageo plc - Depositary Receipt (Common Stock) | 0.00 | 0.00 | 0.00 | 0.00 | 0.0018 | -0.0002 | |||
| QCOM / QUALCOMM Incorporated | 0.00 | 0.00 | 0.00 | 0.00 | 0.0015 | -0.0001 | |||
| EXR / Extra Space Storage Inc. | 0.00 | 0.00 | 0.00 | 0.00 | 0.0014 | -0.0001 | |||
| EMR / Emerson Electric Co. | 0.00 | 0.00 | 0.00 | 50.00 | 0.0013 | 0.0001 | |||
| QSR / Restaurant Brands International Inc. | 0.00 | 0.00 | 0.00 | 0.00 | 0.0012 | -0.0001 | |||
| MCK / McKesson Corporation | 0.00 | 0.00 | 0.00 | 0.00 | 0.0011 | -0.0000 | |||
| PGR / The Progressive Corporation | 0.00 | 0.00 | 0.00 | 0.00 | 0.0010 | -0.0002 | |||
| VT / Vanguard International Equity Index Funds - Vanguard Total World Stock ETF | 0.00 | 0.00 | 0.00 | 0.00 | 0.0010 | -0.0000 | |||
| GIB / CGI Inc. | 0.00 | 0.00 | 0.00 | 0.00 | 0.0006 | -0.0000 | |||
| UL / Unilever PLC - Depositary Receipt (Common Stock) | 0.00 | 0.00 | 0.00 | 0.00 | 0.0006 | -0.0001 | |||
| SNY / Sanofi - Depositary Receipt (Common Stock) | 0.00 | 0.00 | 0.00 | 0.00 | 0.0006 | -0.0001 | |||
| TIXT / TELUS International (Cda) Inc. | 0.00 | 0.00 | 0.00 | 0.00 | 0.0005 | 0.0001 | |||
| AZN / AstraZeneca PLC - Depositary Receipt (Common Stock) | 0.00 | 0.00 | 0.00 | 0.00 | 0.0005 | -0.0001 | |||
| NVS / Novartis AG - Depositary Receipt (Common Stock) | 0.00 | 0.00 | 0.00 | 0.00 | 0.0005 | -0.0000 | |||
| VIG / Vanguard Specialized Funds - Vanguard Dividend Appreciation ETF | 0.00 | 0.00 | 0.00 | 0.0004 | -0.0000 | ||||
| NEE / NextEra Energy, Inc. | 0.00 | -90.23 | 0.00 | -100.00 | 0.0004 | -0.0036 | |||
| FCX / Freeport-McMoRan Inc. | 0.00 | 0.00 | 0.00 | 0.0003 | 0.0000 | ||||
| RIO / Rio Tinto Group - Depositary Receipt (Common Stock) | 0.00 | 0.00 | 0.00 | 0.0003 | -0.0000 | ||||
| VIS / Vanguard World Fund - Vanguard Industrials ETF | 0.00 | 0.00 | 0.00 | 0.0002 | 0.0000 | ||||
| SMH / VanEck ETF Trust - VanEck Semiconductor ETF | 0.00 | 0.00 | 0.00 | 0.0002 | 0.0000 | ||||
| VNQI / Vanguard International Equity Index Funds - Vanguard Global ex-U.S. Real Estate ETF | 0.00 | 0.00 | 0.00 | 0.0001 | 0.0000 | ||||
| DOW / Dow Inc. | 0.00 | -100.00 | 0.00 | 0.0000 | |||||
| FEZ / SPDR Index Shares Funds - SPDR EURO STOXX 50 ETF | 0.00 | -100.00 | 0.00 | 0.0000 | |||||
| STKL / SunOpta Inc. | 0.00 | -100.00 | 0.00 | 0.0000 | |||||
| CTVA / Corteva, Inc. | 0.00 | -100.00 | 0.00 | 0.0000 | |||||
| NKE / NIKE, Inc. | 0.00 | -100.00 | 0.00 | 0.0000 | |||||
| GIL / Gildan Activewear Inc. | 0.00 | -100.00 | 0.00 | 0.0000 | |||||
| LYB / LyondellBasell Industries N.V. | 0.00 | -100.00 | 0.00 | 0.0000 | |||||
| F / Ford Motor Company | 0.00 | -100.00 | 0.00 | 0.0000 | |||||
| DD / DuPont de Nemours, Inc. | 0.00 | -100.00 | 0.00 | 0.0000 | |||||
| UNH / UnitedHealth Group Incorporated | 0.00 | -100.00 | 0.00 | 0.0000 | |||||
| TAC / TransAlta Corporation | 0.00 | -100.00 | 0.00 | 0.0000 | |||||
| CLX / The Clorox Company | 0.00 | -100.00 | 0.00 | 0.0000 | |||||
| HUM / Humana Inc. | 0.00 | -100.00 | 0.00 | 0.0000 | |||||
| GOLD / Barrick Mining Corporation | 0.00 | -100.00 | 0.00 | 0.0000 | |||||
| TWLO / Twilio Inc. | 0.00 | -100.00 | 0.00 | 0.0000 |