Statistik Asas
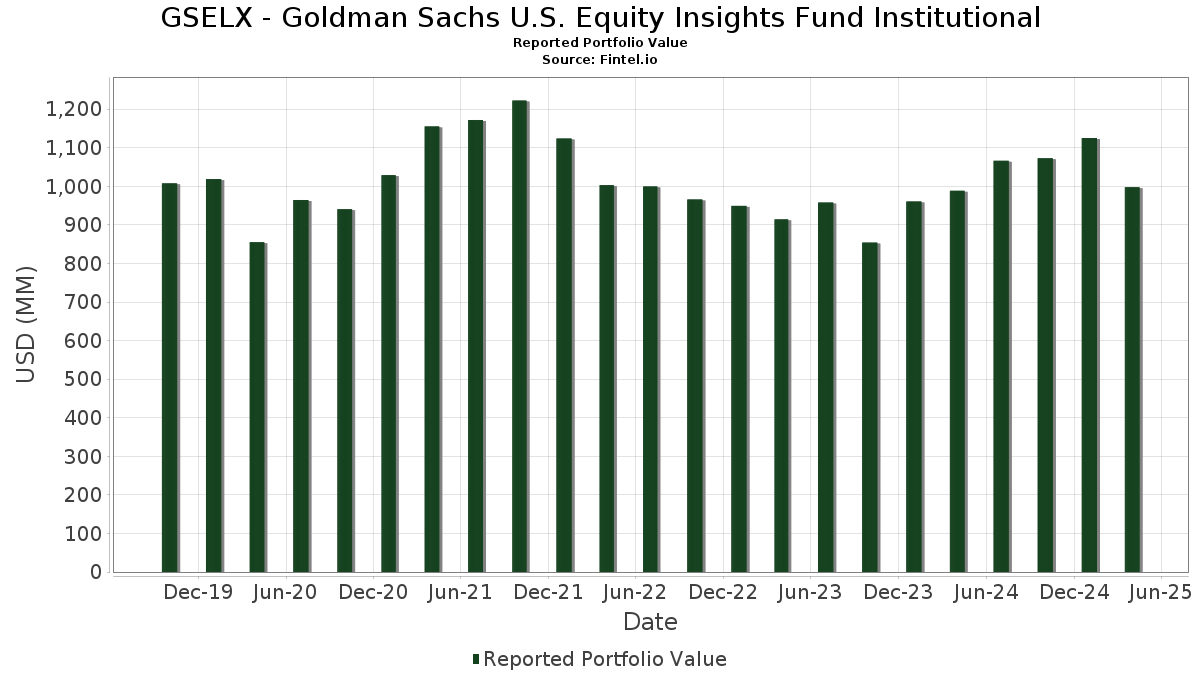
| Nilai Portfolio | $ 997,646,659 |
| Kedudukan Semasa | 148 |
Pegangan Terkini, Prestasi, AUM (dari 13F, 13D)
GSELX - Goldman Sachs U.S. Equity Insights Fund Institutional telah mendedahkan 148 jumlah pegangan dalam pemfailan SEC terkini mereka. Nilai portfolio terkini dikira sebagai $ 997,646,659 USD. Aset Sebenar Di Bawah Pengurusan (AUM) ialah nilai ini ditambah dengan tunai (yang tidak didedahkan). Pegangan teratas GSELX - Goldman Sachs U.S. Equity Insights Fund Institutional ialah Apple Inc. (US:AAPL) , Microsoft Corporation (US:MSFT) , NVIDIA Corporation (US:NVDA) , Amazon.com, Inc. (US:AMZN) , and Alphabet Inc. (US:GOOG) . Kedudukan baharu GSELX - Goldman Sachs U.S. Equity Insights Fund Institutional termasuk BioMarin Pharmaceutical Inc. (US:BMRN) , Williams-Sonoma, Inc. (US:WSM) , Alaska Air Group, Inc. (US:ALK) , Huntington Bancshares Incorporated (US:HBAN) , and GoDaddy Inc. (US:GDDY) .
Kenaikan Teratas Suku Tahun Ini
Kami menggunakan perubahan dalam peruntukan portfolio kerana ini adalah metrik yang paling bermakna. Perubahan boleh disebabkan oleh perdagangan atau perubahan dalam harga saham.
| Sekuriti | Saham (MM) |
Nilai (MM$) |
Portfolio % | ΔPortfolio % |
|---|---|---|---|---|
| 0.18 | 72.72 | 7.2191 | 1.5046 | |
| 0.07 | 14.46 | 1.4351 | 1.3502 | |
| 0.10 | 13.25 | 1.3151 | 1.1582 | |
| 0.09 | 13.64 | 1.3537 | 1.1096 | |
| 0.07 | 10.91 | 1.0835 | 1.0633 | |
| 0.07 | 10.45 | 1.0377 | 0.9944 | |
| 0.02 | 10.62 | 1.0540 | 0.9619 | |
| 0.06 | 12.54 | 1.2446 | 0.9421 | |
| 0.01 | 10.83 | 1.0748 | 0.8842 | |
| 0.07 | 9.25 | 0.9187 | 0.8765 |
Penurunan Teratas Suku Tahun Ini
Kami menggunakan perubahan dalam peruntukan portfolio kerana ini adalah metrik yang paling bermakna. Perubahan boleh disebabkan oleh perdagangan atau perubahan dalam harga saham.
| Sekuriti | Saham (MM) |
Nilai (MM$) |
Portfolio % | ΔPortfolio % |
|---|---|---|---|---|
| 0.04 | 23.95 | 2.3779 | -1.6940 | |
| 0.00 | 0.52 | 0.0512 | -1.6624 | |
| 0.01 | 0.72 | 0.0718 | -1.3079 | |
| 0.01 | 6.07 | 0.6024 | -1.2774 | |
| 0.00 | 1.37 | 0.1362 | -0.9778 | |
| 0.00 | 0.11 | 0.0107 | -0.9027 | |
| 0.01 | 1.49 | 0.1480 | -0.8773 | |
| 0.02 | 2.54 | 0.2525 | -0.8285 | |
| 0.03 | 5.06 | 0.5020 | -0.8123 | |
| 0.02 | 5.98 | 0.5941 | -0.8067 |
13F dan Pemfailan Dana
Borang ini telah difailkan pada 2025-06-25 untuk tempoh pelaporan 2025-04-30. Klik ikon pautan untuk melihat sejarah transaksi penuh.
Tingkatkan untuk membuka data premium dan eksport ke Excel ![]() .
.
| Sekuriti | Jenis | Purata Harga Saham | Saham (MM) |
ΔSaham (%) |
ΔSaham (%) |
Nilai ($MM) |
Portfolio (%) |
ΔPortfolio (%) |
|
|---|---|---|---|---|---|---|---|---|---|
| AAPL / Apple Inc. | 0.36 | -8.95 | 75.72 | -18.01 | 7.5171 | -0.5767 | |||
| MSFT / Microsoft Corporation | 0.18 | 17.11 | 72.72 | 11.52 | 7.2191 | 1.5046 | |||
| NVDA / NVIDIA Corporation | 0.49 | -14.27 | 52.87 | -22.23 | 5.2487 | -0.7093 | |||
| AMZN / Amazon.com, Inc. | 0.22 | -1.45 | 39.86 | -23.53 | 3.9571 | -0.6111 | |||
| GOOG / Alphabet Inc. | 0.20 | 0.00 | 32.67 | -21.75 | 3.2429 | -0.4154 | |||
| AVGO / Broadcom Inc. | 0.14 | -2.36 | 26.38 | -15.07 | 2.6187 | -0.1031 | |||
| META / Meta Platforms, Inc. | 0.04 | -35.28 | 23.95 | -48.45 | 2.3779 | -1.6940 | |||
| PG / The Procter & Gamble Company | 0.11 | -8.47 | 18.33 | -10.35 | 1.8192 | 0.0278 | |||
| TSLA / Tesla, Inc. | 0.05 | -9.82 | 15.29 | -37.11 | 1.5181 | -0.6129 | |||
| GE / General Electric Company | 0.07 | 1,406.30 | 14.46 | 1,391.85 | 1.4351 | 1.3502 | |||
| TXN / Texas Instruments Incorporated | 0.09 | 464.71 | 13.64 | 389.62 | 1.3537 | 1.1096 | |||
| MS / Morgan Stanley | 0.12 | -12.13 | 13.58 | -1.74 | 1.3486 | 0.0653 | |||
| BRK.B / Berkshire Hathaway Inc. | 0.03 | -31.00 | 13.43 | -21.50 | 1.3331 | -0.1660 | |||
| GOOGL / Alphabet Inc. | 0.08 | 170.77 | 13.39 | 110.75 | 1.3290 | 0.7724 | |||
| ABT / Abbott Laboratories | 0.10 | 623.88 | 13.25 | 640.06 | 1.3151 | 1.1582 | |||
| CME / CME Group Inc. | 0.05 | -21.13 | 13.17 | -7.61 | 1.3070 | 0.0582 | |||
| CTAS / Cintas Corporation | 0.06 | 244.16 | 12.54 | 263.29 | 1.2446 | 0.9421 | |||
| TRV / The Travelers Companies, Inc. | 0.05 | -8.05 | 12.49 | -0.95 | 1.2397 | 0.1349 | |||
| VZ / Verizon Communications Inc. | 0.28 | -27.19 | 12.17 | -18.56 | 1.2082 | -0.1014 | |||
| ZTS / Zoetis Inc. | 0.08 | 0.00 | 12.13 | -8.49 | 1.2040 | 0.0426 | |||
| COF / Capital One Financial Corporation | 0.07 | 10.95 | 12.09 | -1.83 | 1.2003 | 0.1210 | |||
| ECL / Ecolab Inc. | 0.05 | -6.19 | 12.03 | -5.72 | 1.1940 | 0.0760 | |||
| GD / General Dynamics Corporation | 0.04 | -14.43 | 11.98 | -9.38 | 1.1889 | 0.0307 | |||
| REGN / Regeneron Pharmaceuticals, Inc. | 0.02 | 14.68 | 11.83 | 2.04 | 1.1746 | 0.1584 | |||
| EFX / Equifax Inc. | 0.05 | -5.32 | 11.72 | -10.37 | 1.1635 | 0.0176 | |||
| CRM / Salesforce, Inc. | 0.04 | 12.66 | 11.14 | 12.57 | 1.1058 | 0.1146 | |||
| PNC / The PNC Financial Services Group, Inc. | 0.07 | 5,821.80 | 10.91 | 4,645.22 | 1.0835 | 1.0633 | |||
| LLY / Eli Lilly and Company | 0.01 | 349.24 | 10.83 | 397.98 | 1.0748 | 0.8842 | |||
| KMI / Kinder Morgan, Inc. | 0.41 | -6.58 | 10.79 | -10.59 | 1.0712 | 0.0136 | |||
| UPS / United Parcel Service, Inc. | 0.11 | 8.53 | 10.66 | -9.46 | 1.0581 | 0.0265 | |||
| ISRG / Intuitive Surgical, Inc. | 0.02 | 1,019.91 | 10.62 | 910.18 | 1.0540 | 0.9619 | |||
| AMP / Ameriprise Financial, Inc. | 0.02 | 24.03 | 10.50 | 7.52 | 1.0420 | 0.1864 | |||
| HCA / HCA Healthcare, Inc. | 0.03 | 354.10 | 10.49 | 331.73 | 1.0415 | 0.8158 | |||
| JPM / JPMorgan Chase & Co. | 0.04 | 119.32 | 10.47 | 100.73 | 1.0391 | 0.5821 | |||
| QCOM / QUALCOMM Incorporated | 0.07 | 2,361.96 | 10.45 | 2,015.99 | 1.0377 | 0.9944 | |||
| MA / Mastercard Incorporated | 0.02 | -48.06 | 10.33 | -48.75 | 1.0251 | -0.7407 | |||
| C / Citigroup Inc. | 0.14 | -26.35 | 9.74 | -38.16 | 0.9665 | -0.4131 | |||
| IQV / IQVIA Holdings Inc. | 0.06 | 0.96 | 9.68 | -22.25 | 0.9610 | -0.1301 | |||
| UHS / Universal Health Services, Inc. | 0.05 | 43.44 | 9.63 | 34.70 | 0.9557 | 0.3294 | |||
| PEP / PepsiCo, Inc. | 0.07 | 2,037.10 | 9.25 | 1,823.91 | 0.9187 | 0.8765 | |||
| HD / The Home Depot, Inc. | 0.02 | -36.18 | 8.97 | -31.16 | 0.8907 | -0.4150 | |||
| BKNG / Booking Holdings Inc. | 0.00 | -40.39 | 8.95 | -35.84 | 0.8884 | -0.3339 | |||
| CVS / CVS Health Corporation | 0.13 | 51.84 | 8.92 | 35.63 | 0.8852 | 0.2049 | |||
| V / Visa Inc. | 0.02 | 2,146.43 | 7.94 | 2,174.79 | 0.7882 | 0.7576 | |||
| TJX / The TJX Companies, Inc. | 0.06 | 391.75 | 7.49 | 407.32 | 0.7434 | 0.6140 | |||
| LIN / Linde plc | 0.02 | -49.15 | 7.24 | -48.34 | 0.7184 | -0.5092 | |||
| VTR / Ventas, Inc. | 0.09 | -56.41 | 6.47 | -37.05 | 0.6419 | -0.4208 | |||
| KO / The Coca-Cola Company | 0.09 | 689.39 | 6.23 | 803.19 | 0.6187 | 0.5582 | |||
| COST / Costco Wholesale Corporation | 0.01 | -73.80 | 6.07 | -70.20 | 0.6024 | -1.2774 | |||
| ADBE / Adobe Inc. | 0.02 | -56.32 | 5.98 | -62.56 | 0.5941 | -0.8067 | |||
| NOW / ServiceNow, Inc. | 0.01 | -58.65 | 5.52 | -61.22 | 0.5483 | -0.6998 | |||
| MPC / Marathon Petroleum Corporation | 0.04 | 116.47 | 5.50 | 104.12 | 0.5460 | 0.3099 | |||
| GLW / Corning Incorporated | 0.12 | -1.81 | 5.47 | 23.85 | 0.5428 | 0.1060 | |||
| DDOG / Datadog, Inc. | 0.05 | 168.58 | 5.47 | 92.26 | 0.5427 | 0.2935 | |||
| WAB / Westinghouse Air Brake Technologies Corporation | 0.03 | -16.40 | 5.40 | -4.15 | 0.5360 | 0.0130 | |||
| SYY / Sysco Corporation | 0.07 | 958.27 | 5.16 | 884.73 | 0.5122 | 0.4556 | |||
| FI / Fiserv, Inc. | 0.03 | -60.53 | 5.06 | -66.28 | 0.5020 | -0.8123 | |||
| WELL / Welltower Inc. | 0.03 | 163.95 | 5.02 | 365.65 | 0.4979 | 0.3868 | |||
| PH / Parker-Hannifin Corporation | 0.01 | -50.42 | 4.82 | -57.58 | 0.4785 | -0.5171 | |||
| NFLX / Netflix, Inc. | 0.00 | 21.39 | 4.73 | 40.65 | 0.4700 | 0.1750 | |||
| AZO / AutoZone, Inc. | 0.00 | 4.69 | 0.4658 | 0.4658 | |||||
| FICO / Fair Isaac Corporation | 0.00 | 10.40 | 4.69 | 17.23 | 0.4656 | 0.1150 | |||
| XEL / Xcel Energy Inc. | 0.06 | -43.82 | 4.48 | -40.89 | 0.4447 | -0.2195 | |||
| PLD / Prologis, Inc. | 0.04 | 2,879.51 | 4.09 | 2,453.75 | 0.4057 | 0.3916 | |||
| AR / Antero Resources Corporation | 0.11 | 60.66 | 3.77 | 49.96 | 0.3746 | 0.1541 | |||
| DASH / DoorDash, Inc. | 0.02 | -53.74 | 3.73 | -52.75 | 0.3701 | -0.3213 | |||
| MDT / Medtronic plc | 0.04 | 0.00 | 3.55 | -6.66 | 0.3522 | 0.0191 | |||
| LOW / Lowe's Companies, Inc. | 0.02 | 582.25 | 3.37 | 521.22 | 0.3343 | 0.2840 | |||
| BMRN / BioMarin Pharmaceutical Inc. | 0.05 | 3.28 | 0.3260 | 0.3260 | |||||
| BSX / Boston Scientific Corporation | 0.03 | -76.78 | 3.27 | -62.25 | 0.3245 | -0.5687 | |||
| MNST / Monster Beverage Corporation | 0.05 | -77.98 | 3.26 | -72.83 | 0.3232 | -0.7269 | |||
| MTZ / MasTec, Inc. | 0.02 | 95.60 | 3.11 | 102.61 | 0.3088 | 0.1671 | |||
| PSA / Public Storage | 0.01 | 3.06 | 0.3039 | 0.3039 | |||||
| NEE / NextEra Energy, Inc. | 0.04 | 175.11 | 2.99 | 135.57 | 0.2966 | 0.1855 | |||
| WSM / Williams-Sonoma, Inc. | 0.02 | 2.96 | 0.2942 | 0.2942 | |||||
| CVX / Chevron Corporation | 0.02 | 83.55 | 2.93 | 67.45 | 0.2911 | 0.1376 | |||
| HWM / Howmet Aerospace Inc. | 0.02 | -79.43 | 2.90 | -44.25 | 0.2875 | -0.2499 | |||
| CFR / Cullen/Frost Bankers, Inc. | 0.02 | 754.68 | 2.86 | 613.97 | 0.2843 | 0.2492 | |||
| MMC / Marsh & McLennan Companies, Inc. | 0.01 | -21.60 | 2.85 | -18.50 | 0.2831 | -0.0235 | |||
| AEE / Ameren Corporation | 0.03 | 2.81 | 0.2785 | 0.2785 | |||||
| BAC / Bank of America Corporation | 0.07 | 297.12 | 2.78 | 278.99 | 0.2758 | 0.2081 | |||
| XP / XP Inc. | 0.17 | 2.75 | 0.2731 | 0.2731 | |||||
| NTRA / Natera, Inc. | 0.02 | -73.11 | 2.71 | -77.06 | 0.2691 | -0.7667 | |||
| ALK / Alaska Air Group, Inc. | 0.06 | 2.69 | 0.2674 | 0.2674 | |||||
| CAT / Caterpillar Inc. | 0.01 | 38.82 | 2.64 | 90.00 | 0.2622 | 0.1001 | |||
| CL / Colgate-Palmolive Company | 0.03 | -49.62 | 2.57 | -43.68 | 0.2547 | -0.1441 | |||
| AME / AMETEK, Inc. | 0.02 | -77.65 | 2.54 | -78.16 | 0.2525 | -0.8285 | |||
| RSG / Republic Services, Inc. | 0.01 | -63.45 | 2.40 | -38.30 | 0.2380 | -0.2148 | |||
| GILD / Gilead Sciences, Inc. | 0.02 | -74.98 | 2.24 | -69.98 | 0.2225 | -0.4669 | |||
| HBAN / Huntington Bancshares Incorporated | 0.15 | 2.13 | 0.2114 | 0.2114 | |||||
| CFG / Citizens Financial Group, Inc. | 0.06 | 204.20 | 2.05 | 195.68 | 0.2038 | 0.1348 | |||
| BIRK / Birkenstock Holding plc | 0.04 | 295.97 | 2.03 | 244.31 | 0.2014 | 0.1498 | |||
| GDDY / GoDaddy Inc. | 0.01 | 1.94 | 0.1927 | 0.1927 | |||||
| NLY / Annaly Capital Management, Inc. | 0.10 | 1.94 | 0.1925 | 0.1925 | |||||
| IT / Gartner, Inc. | 0.00 | -56.34 | 1.94 | -66.14 | 0.1922 | -0.3087 | |||
| VMC / Vulcan Materials Company | 0.01 | -58.97 | 1.85 | -60.74 | 0.1834 | -0.2290 | |||
| HRB / H&R Block, Inc. | 0.03 | -22.73 | 1.80 | -19.51 | 0.1783 | -0.0288 | |||
| US21871X1090 / Corebridge Financial, Inc. | 0.06 | 1.77 | 0.1757 | 0.1757 | |||||
| PANW / Palo Alto Networks, Inc. | 0.01 | -81.03 | 1.69 | -80.57 | 0.1673 | -0.7702 | |||
| PPL / PPL Corporation | 0.04 | 1.62 | 0.1607 | 0.1607 | |||||
| SKX / Skechers U.S.A., Inc. | 0.03 | -72.42 | 1.60 | -78.45 | 0.1590 | -0.5270 | |||
| CEG / Constellation Energy Corporation | 0.01 | 143.06 | 1.57 | 345.61 | 0.1562 | 0.1198 | |||
| EEFT / Euronet Worldwide, Inc. | 0.02 | 54.38 | 1.55 | 55.41 | 0.1540 | 0.0665 | |||
| CMS / CMS Energy Corporation | 0.02 | 236.75 | 1.52 | 335.24 | 0.1508 | 0.1150 | |||
| WSO / Watsco, Inc. | 0.00 | 1.49 | 0.1480 | 0.1480 | |||||
| ABNB / Airbnb, Inc. | 0.01 | -86.29 | 1.49 | -87.26 | 0.1480 | -0.8773 | |||
| EHC / Encompass Health Corporation | 0.01 | 130.17 | 1.39 | 171.29 | 0.1380 | 0.0931 | |||
| UNH / UnitedHealth Group Incorporated | 0.00 | -85.77 | 1.37 | -89.21 | 0.1362 | -0.9778 | |||
| TDY / Teledyne Technologies Incorporated | 0.00 | -57.11 | 1.36 | -48.04 | 0.1354 | -0.1361 | |||
| PINS / Pinterest, Inc. | 0.05 | -36.13 | 1.35 | -51.68 | 0.1339 | -0.1456 | |||
| UAL / United Airlines Holdings, Inc. | 0.02 | -48.70 | 1.31 | -66.65 | 0.1303 | -0.2145 | |||
| MANH / Manhattan Associates, Inc. | 0.01 | 1.17 | 0.1161 | 0.1161 | |||||
| SRE / Sempra | 0.02 | 0.00 | 1.12 | -10.50 | 0.1110 | 0.0016 | |||
| ROKU / Roku, Inc. | 0.02 | 1.09 | 0.1081 | 0.1081 | |||||
| RTX / RTX Corporation | 0.01 | 1.07 | 0.1064 | 0.1064 | |||||
| FTI / TechnipFMC plc | 0.04 | -11.33 | 1.07 | -6.41 | 0.1058 | 0.0007 | |||
| PFE / Pfizer Inc. | 0.04 | -81.23 | 1.04 | -85.00 | 0.1036 | -0.5421 | |||
| WMB / The Williams Companies, Inc. | 0.02 | -87.64 | 1.00 | -76.08 | 0.0992 | -0.3523 | |||
| OHI / Omega Healthcare Investors, Inc. | 0.03 | 224.97 | 1.00 | 249.12 | 0.0988 | 0.0723 | |||
| BFAM / Bright Horizons Family Solutions Inc. | 0.01 | -65.30 | 0.93 | -67.39 | 0.0921 | -0.1707 | |||
| PAG / Penske Automotive Group, Inc. | 0.01 | 0.90 | 0.0896 | 0.0896 | |||||
| AMGN / Amgen Inc. | 0.00 | 136.23 | 0.89 | 141.14 | 0.0879 | 0.0557 | |||
| CI / The Cigna Group | 0.00 | -54.11 | 0.86 | -50.46 | 0.0855 | -0.0749 | |||
| DIS / The Walt Disney Company | 0.01 | -74.25 | 0.81 | -79.03 | 0.0808 | -0.3028 | |||
| PLTR / Palantir Technologies Inc. | 0.01 | 0.81 | 0.0801 | 0.0801 | |||||
| IVZ / Invesco Ltd. | 0.06 | 0.80 | 0.0794 | 0.0794 | |||||
| TXT / Textron Inc. | 0.01 | 0.00 | 0.73 | -8.04 | 0.0727 | 0.0029 | |||
| CSCO / Cisco Systems, Inc. | 0.01 | -95.18 | 0.72 | -95.41 | 0.0718 | -1.3079 | |||
| ANET / Arista Networks Inc | 0.01 | -27.94 | 0.68 | -48.56 | 0.0675 | -0.0483 | |||
| S&P500 EMINI / DE (000000000) | 0.66 | 0.0656 | 0.0656 | ||||||
| BR / Broadridge Financial Solutions, Inc. | 0.00 | 0.61 | 0.0608 | 0.0608 | |||||
| USFD / US Foods Holding Corp. | 0.01 | -46.01 | 0.60 | -11.70 | 0.0592 | -0.0062 | |||
| CARR / Carrier Global Corporation | 0.01 | -84.57 | 0.59 | -76.94 | 0.0586 | -0.2181 | |||
| HAL / Halliburton Company | 0.03 | -86.71 | 0.59 | -89.89 | 0.0584 | -0.4508 | |||
| CVNA / Carvana Co. | 0.00 | 0.00 | 0.56 | -1.23 | 0.0557 | 0.0059 | |||
| FIX / Comfort Systems USA, Inc. | 0.00 | -91.67 | 0.56 | -92.42 | 0.0554 | -0.5901 | |||
| URI / United Rentals, Inc. | 0.00 | 0.54 | 0.0540 | 0.0540 | |||||
| LAD / Lithia Motors, Inc. | 0.00 | 0.54 | 0.0535 | 0.0535 | |||||
| JNJ / Johnson & Johnson | 0.00 | -97.43 | 0.52 | -97.37 | 0.0512 | -1.6624 | |||
| MRVL / Marvell Technology, Inc. | 0.01 | -78.49 | 0.45 | -84.35 | 0.0444 | -0.2188 | |||
| COKE / Coca-Cola Consolidated, Inc. | 0.00 | -61.01 | 0.41 | -61.33 | 0.0405 | -0.0520 | |||
| AM / Antero Midstream Corporation | 0.02 | -66.38 | 0.38 | -61.24 | 0.0378 | -0.0535 | |||
| LVS / Las Vegas Sands Corp. | 0.01 | 268.99 | 0.37 | 176.69 | 0.0366 | 0.0228 | |||
| G / Genpact Limited | 0.01 | 0.34 | 0.0340 | 0.0340 | |||||
| PSX / Phillips 66 | 0.00 | -71.71 | 0.34 | -70.29 | 0.0340 | -0.0905 | |||
| DRI / Darden Restaurants, Inc. | 0.00 | -91.42 | 0.31 | -88.80 | 0.0307 | -0.2456 | |||
| SNV / Synovus Financial Corp. | 0.00 | -70.95 | 0.21 | -40.23 | 0.0207 | -0.0195 | |||
| MTD / Mettler-Toledo International Inc. | 0.00 | -98.64 | 0.11 | -98.82 | 0.0107 | -0.9027 | |||
| BJ / BJ's Wholesale Club Holdings, Inc. | 0.00 | -100.00 | 0.00 | -100.00 | -0.0359 | ||||
| CAR / Avis Budget Group, Inc. | 0.00 | -100.00 | 0.00 | -100.00 | -0.0519 | ||||
| ZBH / Zimmer Biomet Holdings, Inc. | 0.00 | -100.00 | 0.00 | -100.00 | -0.0367 |