Statistik Asas
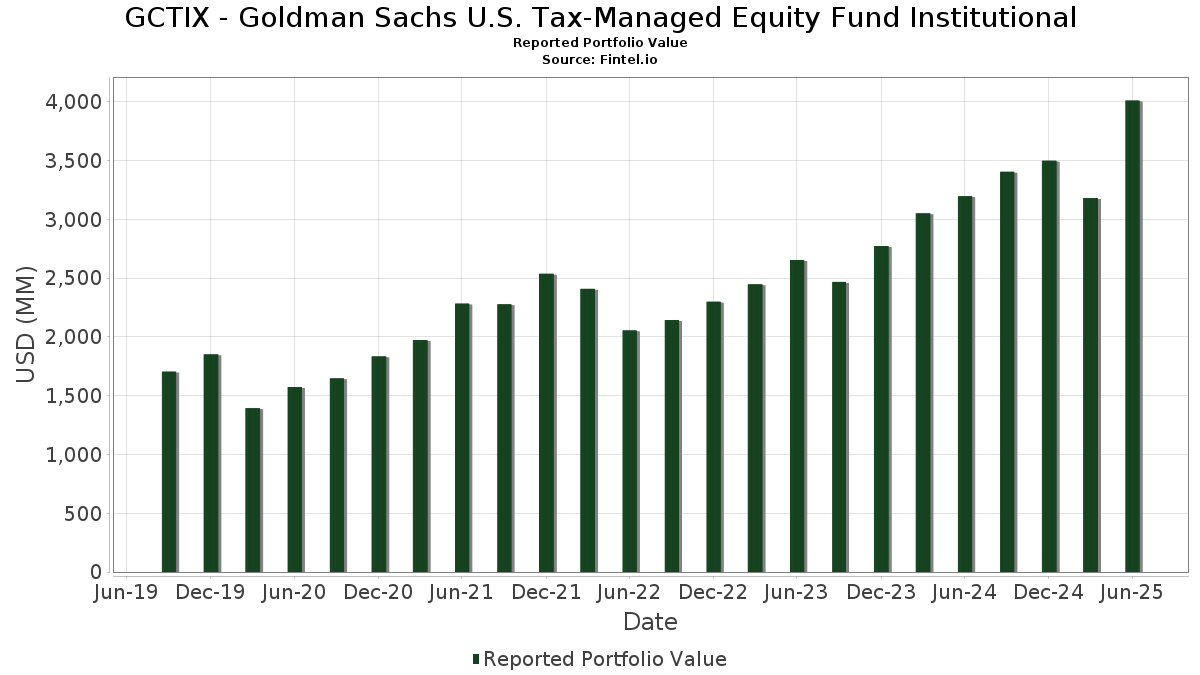
| Nilai Portfolio | $ 4,011,235,325 |
| Kedudukan Semasa | 271 |
Pegangan Terkini, Prestasi, AUM (dari 13F, 13D)
GCTIX - Goldman Sachs U.S. Tax-Managed Equity Fund Institutional telah mendedahkan 271 jumlah pegangan dalam pemfailan SEC terkini mereka. Nilai portfolio terkini dikira sebagai $ 4,011,235,325 USD. Aset Sebenar Di Bawah Pengurusan (AUM) ialah nilai ini ditambah dengan tunai (yang tidak didedahkan). Pegangan teratas GCTIX - Goldman Sachs U.S. Tax-Managed Equity Fund Institutional ialah NVIDIA Corporation (US:NVDA) , Microsoft Corporation (US:MSFT) , Apple Inc. (US:AAPL) , Alphabet Inc. (US:GOOGL) , and Amazon.com, Inc. (US:AMZN) . Kedudukan baharu GCTIX - Goldman Sachs U.S. Tax-Managed Equity Fund Institutional termasuk Welltower Inc. (US:WELL) , General Electric Company (US:GE) , NextEra Energy, Inc. (US:NEE) , Waystar Holding Corp. (US:WAY) , and On Holding AG (CH:CH1134540470) .
Kenaikan Teratas Suku Tahun Ini
Kami menggunakan perubahan dalam peruntukan portfolio kerana ini adalah metrik yang paling bermakna. Perubahan boleh disebabkan oleh perdagangan atau perubahan dalam harga saham.
| Sekuriti | Saham (MM) |
Nilai (MM$) |
Portfolio % | ΔPortfolio % |
|---|---|---|---|---|
| 0.84 | 147.70 | 3.6419 | 1.8737 | |
| 1.53 | 242.13 | 5.9705 | 1.7494 | |
| 0.12 | 55.27 | 1.3627 | 1.2489 | |
| 0.21 | 60.78 | 1.4987 | 1.1870 | |
| 0.97 | 43.76 | 1.0790 | 1.0790 | |
| 0.29 | 44.94 | 1.1081 | 1.0396 | |
| 0.24 | 37.07 | 0.9141 | 0.9141 | |
| 0.13 | 34.48 | 0.8501 | 0.8501 | |
| 0.43 | 30.09 | 0.7418 | 0.7418 | |
| 0.02 | 42.32 | 1.0435 | 0.7032 |
Penurunan Teratas Suku Tahun Ini
Kami menggunakan perubahan dalam peruntukan portfolio kerana ini adalah metrik yang paling bermakna. Perubahan boleh disebabkan oleh perdagangan atau perubahan dalam harga saham.
| Sekuriti | Saham (MM) |
Nilai (MM$) |
Portfolio % | ΔPortfolio % |
|---|---|---|---|---|
| 0.96 | 197.89 | 4.8796 | -1.7794 | |
| 0.00 | 0.00 | -1.3271 | ||
| 0.09 | 46.11 | 1.1371 | -1.0763 | |
| 0.49 | 108.33 | 2.6712 | -1.0199 | |
| 0.01 | 1.23 | 0.0303 | -0.9741 | |
| 0.10 | 17.97 | 0.4432 | -0.9434 | |
| 0.02 | 8.22 | 0.2027 | -0.7622 | |
| 0.10 | 25.79 | 0.6360 | -0.7480 | |
| 0.11 | 19.52 | 0.4812 | -0.6909 | |
| 0.01 | 0.33 | 0.0080 | -0.5512 |
13F dan Pemfailan Dana
Borang ini telah difailkan pada 2025-08-26 untuk tempoh pelaporan 2025-06-30. Klik ikon pautan untuk melihat sejarah transaksi penuh.
Tingkatkan untuk membuka data premium dan eksport ke Excel ![]() .
.
| Sekuriti | Jenis | Purata Harga Saham | Saham (MM) |
ΔSaham (%) |
ΔSaham (%) |
Nilai ($MM) |
Portfolio (%) |
ΔPortfolio (%) |
|
|---|---|---|---|---|---|---|---|---|---|
| NVDA / NVIDIA Corporation | 1.53 | 22.47 | 242.13 | 78.53 | 5.9705 | 1.7494 | |||
| MSFT / Microsoft Corporation | 0.48 | -4.16 | 236.43 | 26.99 | 5.8300 | 0.0356 | |||
| AAPL / Apple Inc. | 0.96 | 0.14 | 197.89 | -7.51 | 4.8796 | -1.7794 | |||
| GOOGL / Alphabet Inc. | 0.84 | 128.11 | 147.70 | 159.96 | 3.6419 | 1.8737 | |||
| AMZN / Amazon.com, Inc. | 0.49 | -20.79 | 108.33 | -8.66 | 2.6712 | -1.0199 | |||
| AVGO / Broadcom Inc. | 0.36 | 0.00 | 98.67 | 64.64 | 2.4329 | 0.5677 | |||
| META / Meta Platforms, Inc. | 0.12 | -12.37 | 91.31 | 12.21 | 2.2514 | -0.2810 | |||
| V / Visa Inc. | 0.23 | 14.02 | 82.26 | 54.24 | 2.0283 | 0.3847 | |||
| COST / Costco Wholesale Corporation | 0.07 | 0.00 | 66.64 | 4.67 | 1.6431 | -0.3383 | |||
| JPM / JPMorgan Chase & Co. | 0.21 | 413.52 | 60.78 | 506.95 | 1.4987 | 1.1870 | |||
| NFLX / Netflix, Inc. | 0.04 | 27.44 | 59.60 | 83.01 | 1.4697 | 0.4561 | |||
| TSLA / Tesla, Inc. | 0.18 | 15.70 | 57.54 | 41.81 | 1.4188 | 0.1560 | |||
| LIN / Linde plc | 0.12 | 1,453.77 | 55.27 | 1,470.03 | 1.3627 | 1.2489 | |||
| BSX / Boston Scientific Corporation | 0.51 | 0.00 | 54.56 | 6.47 | 1.3453 | -0.2495 | |||
| COF / Capital One Financial Corporation | 0.23 | 0.00 | 49.93 | 18.66 | 1.2311 | -0.0784 | |||
| CME / CME Group Inc. | 0.18 | -1.02 | 49.41 | 2.83 | 1.2184 | -0.2771 | |||
| BRK.B / Berkshire Hathaway Inc. | 0.09 | -28.91 | 46.11 | -35.16 | 1.1371 | -1.0763 | |||
| ZTS / Zoetis Inc. | 0.29 | 2,056.21 | 44.94 | 1,942.59 | 1.1081 | 1.0396 | |||
| USB / U.S. Bancorp | 0.97 | 43.76 | 1.0790 | 1.0790 | |||||
| MELI / MercadoLibre, Inc. | 0.02 | 188.88 | 42.32 | 287.04 | 1.0435 | 0.7032 | |||
| MS / Morgan Stanley | 0.30 | 174.02 | 42.23 | 230.84 | 1.0414 | 0.6441 | |||
| JNJ / Johnson & Johnson | 0.27 | 203.75 | 41.07 | 179.79 | 1.0128 | 0.5559 | |||
| TGT / Target Corporation | 0.38 | 105.58 | 37.19 | 30.12 | 0.9171 | 0.0891 | |||
| WELL / Welltower Inc. | 0.24 | 37.07 | 0.9141 | 0.9141 | |||||
| PLD / Prologis, Inc. | 0.35 | 136.76 | 37.01 | 122.64 | 0.9126 | 0.3952 | |||
| AME / AMETEK, Inc. | 0.20 | -1.94 | 35.46 | 3.08 | 0.8743 | -0.1962 | |||
| ANET / Arista Networks Inc | 0.34 | 25.52 | 35.02 | 65.75 | 0.8635 | 0.2059 | |||
| GE / General Electric Company | 0.13 | 34.48 | 0.8501 | 0.8501 | |||||
| NEE / NextEra Energy, Inc. | 0.43 | 30.09 | 0.7418 | 0.7418 | |||||
| GILD / Gilead Sciences, Inc. | 0.25 | 0.00 | 28.27 | -1.05 | 0.6971 | -0.1921 | |||
| VRTX / Vertex Pharmaceuticals Incorporated | 0.06 | 0.00 | 27.75 | -8.17 | 0.6844 | -0.2563 | |||
| WAY / Waystar Holding Corp. | 0.66 | 27.06 | 0.6672 | 0.6672 | |||||
| DELL / Dell Technologies Inc. | 0.22 | -24.08 | 26.87 | 2.11 | 0.6624 | -0.1564 | |||
| BAC / Bank of America Corporation | 0.57 | 117.58 | 26.85 | 146.72 | 0.6621 | 0.3234 | |||
| CH1134540470 / On Holding AG | 0.50 | 26.09 | 0.6434 | 0.6434 | |||||
| PGR / The Progressive Corporation | 0.10 | -38.48 | 25.79 | -41.99 | 0.6360 | -0.7480 | |||
| ALIT / Alight, Inc. | 4.25 | 24.03 | 0.5925 | 0.5925 | |||||
| CRS / Carpenter Technology Corporation | 0.08 | -29.56 | 23.47 | 7.45 | 0.5788 | -0.1011 | |||
| EXR / Extra Space Storage Inc. | 0.16 | 214.50 | 23.33 | 168.49 | 0.5752 | 0.1760 | |||
| PNC / The PNC Financial Services Group, Inc. | 0.12 | -10.22 | 23.28 | -4.78 | 0.5741 | -0.1869 | |||
| IBM / International Business Machines Corporation | 0.08 | 0.00 | 22.78 | 18.55 | 0.5617 | -0.0363 | |||
| LII / Lennox International Inc. | 0.04 | 0.00 | 22.51 | 2.21 | 0.5551 | -0.1304 | |||
| CAT / Caterpillar Inc. | 0.06 | 21.86 | 0.5391 | 0.5391 | |||||
| C / Citigroup Inc. | 0.26 | 21.71 | 0.5353 | 0.5353 | |||||
| IT / Gartner, Inc. | 0.05 | 0.00 | 21.29 | -3.70 | 0.5251 | -0.1631 | |||
| SCCO / Southern Copper Corporation | 0.21 | 3,220.88 | 21.10 | 4,332.56 | 0.5203 | 0.5006 | |||
| NOW / ServiceNow, Inc. | 0.02 | -17.02 | 20.50 | 7.15 | 0.5055 | -0.0899 | |||
| ABNB / Airbnb, Inc. | 0.15 | 212.52 | 20.47 | 246.23 | 0.5048 | 0.3207 | |||
| DDOG / Datadog, Inc. | 0.15 | 40.78 | 20.43 | 90.62 | 0.5039 | 0.1702 | |||
| INTU / Intuit Inc. | 0.03 | 786.64 | 20.29 | 1,037.75 | 0.5002 | 0.4447 | |||
| MHO / M/I Homes, Inc. | 0.18 | -3.38 | 20.28 | -5.12 | 0.5000 | -0.1652 | |||
| ADBE / Adobe Inc. | 0.05 | 0.00 | 20.13 | 0.87 | 0.4963 | -0.1247 | |||
| KO / The Coca-Cola Company | 0.28 | 20.06 | 0.4946 | 0.4946 | |||||
| PSA / Public Storage | 0.07 | 24.57 | 19.80 | 22.12 | 0.4883 | -0.0164 | |||
| GOOG / Alphabet Inc. | 0.11 | -54.36 | 19.52 | -48.18 | 0.4812 | -0.6909 | |||
| ISRG / Intuitive Surgical, Inc. | 0.04 | 0.00 | 19.47 | 9.72 | 0.4800 | -0.0722 | |||
| PANW / Palo Alto Networks, Inc. | 0.09 | 1,140.21 | 19.42 | 1,387.74 | 0.4787 | 0.4381 | |||
| EQH / Equitable Holdings, Inc. | 0.34 | -0.00 | 19.30 | 7.70 | 0.4758 | -0.0818 | |||
| NTRS / Northern Trust Corporation | 0.15 | -15.76 | 18.64 | 8.28 | 0.4597 | -0.0762 | |||
| MGY / Magnolia Oil & Gas Corporation | 0.81 | 1,235.54 | 18.26 | 1,330.72 | 0.4502 | 0.3890 | |||
| IVZ / Invesco Ltd. | 1.15 | 566.40 | 18.21 | 593.00 | 0.4489 | 0.3671 | |||
| CALM / Cal-Maine Foods, Inc. | 0.18 | 693.35 | 18.09 | 1,277.46 | 0.4460 | 0.3992 | |||
| ABBV / AbbVie Inc. | 0.10 | -54.46 | 17.97 | -59.66 | 0.4432 | -0.9434 | |||
| TRV / The Travelers Companies, Inc. | 0.07 | 0.00 | 17.60 | 1.17 | 0.4339 | -0.1074 | |||
| HEIA / Heico Corp. - Class A | 0.07 | 19.19 | 17.33 | 46.19 | 0.4274 | 0.0584 | |||
| NDAQ / Nasdaq, Inc. | 0.19 | -0.00 | 16.93 | 17.88 | 0.4173 | -0.0295 | |||
| VRNS / Varonis Systems, Inc. | 0.33 | 16.90 | 0.4166 | 0.4166 | |||||
| HCA / HCA Healthcare, Inc. | 0.04 | 0.00 | 16.78 | 10.87 | 0.4138 | -0.0573 | |||
| FTI / TechnipFMC plc | 0.48 | 0.00 | 16.42 | 8.68 | 0.4049 | -0.0653 | |||
| NWSA / News Corporation | 0.54 | 0.00 | 15.99 | 9.18 | 0.3944 | -0.0615 | |||
| BPMC / Blueprint Medicines Corporation | 0.12 | 15.49 | 0.3820 | 0.3820 | |||||
| KEYS / Keysight Technologies, Inc. | 0.09 | 0.00 | 15.44 | 9.41 | 0.3808 | -0.0585 | |||
| GSAXX / Goldman Sachs Trust - Goldman Sachs Financial Square Government Fund | 15.29 | 748.67 | 15.29 | 748.92 | 0.3770 | 0.3209 | |||
| CARR / Carrier Global Corporation | 0.21 | 622.40 | 15.23 | 858.40 | 0.3755 | 0.3114 | |||
| WRBY / Warby Parker Inc. | 0.68 | 14.95 | 0.3686 | 0.3686 | |||||
| DASH / DoorDash, Inc. | 0.06 | 29.14 | 14.81 | 74.20 | 0.3651 | 0.1005 | |||
| MDB / MongoDB, Inc. | 0.07 | 396.66 | 14.38 | 494.75 | 0.3546 | 0.2793 | |||
| ITW / Illinois Tool Works Inc. | 0.06 | -40.80 | 14.29 | -40.98 | 0.3523 | -0.4011 | |||
| MPC / Marathon Petroleum Corporation | 0.09 | 1.61 | 14.21 | 15.85 | 0.3503 | -0.0313 | |||
| ZS / Zscaler, Inc. | 0.04 | 0.00 | 13.59 | 58.23 | 0.3351 | 0.0678 | |||
| CFG / Citizens Financial Group, Inc. | 0.30 | 177.31 | 13.55 | 162.65 | 0.3340 | 0.1318 | |||
| TXN / Texas Instruments Incorporated | 0.06 | -17.55 | 13.11 | -4.74 | 0.3232 | -0.1050 | |||
| SYF / Synchrony Financial | 0.20 | -41.51 | 13.10 | -26.27 | 0.3230 | -0.2299 | |||
| UBER / Uber Technologies, Inc. | 0.13 | 12.52 | 0.3087 | 0.3087 | |||||
| TEM / Tempus AI, Inc. | 0.20 | 12.46 | 0.3072 | 0.3072 | |||||
| PTON / Peloton Interactive, Inc. | 1.75 | 12.18 | 0.3003 | 0.3003 | |||||
| LAMR / Lamar Advertising Company | 0.10 | 939.82 | 12.16 | 1,009.22 | 0.2998 | 0.2657 | |||
| EXAS / Exact Sciences Corporation | 0.23 | 12.07 | 0.2976 | 0.2976 | |||||
| MLI / Mueller Industries, Inc. | 0.15 | 0.00 | 12.04 | 4.38 | 0.2969 | -0.0621 | |||
| UNH / UnitedHealth Group Incorporated | 0.04 | -19.89 | 11.99 | -52.28 | 0.2955 | -0.4862 | |||
| NTRA / Natera, Inc. | 0.07 | 11.93 | 0.2941 | 0.2941 | |||||
| PRMB / Primo Brands Corporation | 0.39 | 1,558.04 | 11.67 | 1,284.34 | 0.2878 | 0.2615 | |||
| PBH / Prestige Consumer Healthcare Inc. | 0.15 | 1,122.95 | 11.64 | 1,460.72 | 0.2871 | 0.2570 | |||
| TDY / Teledyne Technologies Incorporated | 0.02 | 90.42 | 11.53 | 96.01 | 0.2843 | 0.1012 | |||
| MTD / Mettler-Toledo International Inc. | 0.01 | 33.60 | 10.92 | 32.91 | 0.2693 | 0.0135 | |||
| ABT / Abbott Laboratories | 0.08 | 2,552.02 | 10.89 | 3,630.48 | 0.2686 | 0.2552 | |||
| MEDP / Medpace Holdings, Inc. | 0.03 | -49.35 | 10.73 | -47.83 | 0.2647 | -0.3757 | |||
| VOYA / Voya Financial, Inc. | 0.15 | -0.00 | 10.73 | 4.77 | 0.2646 | -0.0541 | |||
| PG / The Procter & Gamble Company | 0.07 | -49.23 | 10.65 | -52.54 | 0.2625 | -0.4356 | |||
| TFC / Truist Financial Corporation | 0.25 | 10.61 | 0.2616 | 0.2616 | |||||
| CVLT / Commvault Systems, Inc. | 0.06 | 767.28 | 10.37 | 858.83 | 0.2556 | 0.2219 | |||
| FTAI / FTAI Aviation Ltd. | 0.09 | 113.69 | 10.33 | 121.41 | 0.2548 | 0.1095 | |||
| EOG / EOG Resources, Inc. | 0.09 | 0.00 | 10.31 | -6.72 | 0.2542 | -0.0898 | |||
| MTZ / MasTec, Inc. | 0.06 | 88.00 | 10.19 | 174.57 | 0.2513 | 0.1358 | |||
| UNP / Union Pacific Corporation | 0.04 | 0.00 | 10.12 | -2.61 | 0.2496 | -0.0739 | |||
| RTX / RTX Corporation | 0.07 | -54.48 | 9.96 | -49.82 | 0.2456 | -0.3721 | |||
| CFR / Cullen/Frost Bankers, Inc. | 0.08 | -1.31 | 9.84 | 1.33 | 0.2425 | -0.0596 | |||
| HWM / Howmet Aerospace Inc. | 0.05 | -53.97 | 9.53 | -33.97 | 0.2350 | -0.2141 | |||
| LAD / Lithia Motors, Inc. | 0.03 | 9.51 | 0.2346 | 0.2346 | |||||
| ALNY / Alnylam Pharmaceuticals, Inc. | 0.03 | 0.00 | 9.41 | 20.75 | 0.2322 | -0.0105 | |||
| BRSL / Brightstar Lottery PLC | 0.59 | 59.36 | 9.41 | 54.96 | 0.2319 | 0.0430 | |||
| DLR / Digital Realty Trust, Inc. | 0.05 | 9.37 | 0.2311 | 0.2311 | |||||
| EFX / Equifax Inc. | 0.04 | 0.00 | 9.33 | 6.49 | 0.2301 | -0.0426 | |||
| VMC / Vulcan Materials Company | 0.04 | 0.00 | 9.26 | 11.79 | 0.2284 | -0.0295 | |||
| RDDT / Reddit, Inc. | 0.06 | 8.90 | 0.2195 | 0.2195 | |||||
| CHTR / Charter Communications, Inc. | 0.02 | 2,747.43 | 8.84 | 3,506.12 | 0.2179 | 0.2107 | |||
| MSCI / MSCI Inc. | 0.02 | 8.76 | 0.2161 | 0.2161 | |||||
| UHS / Universal Health Services, Inc. | 0.05 | 185.24 | 8.73 | 175.02 | 0.2153 | 0.1165 | |||
| RL / Ralph Lauren Corporation | 0.03 | 0.00 | 8.53 | 24.26 | 0.2104 | -0.0033 | |||
| HUM / Humana Inc. | 0.03 | 0.00 | 8.45 | -7.61 | 0.2085 | -0.0763 | |||
| XEL / Xcel Energy Inc. | 0.12 | -45.75 | 8.39 | -47.81 | 0.2069 | -0.2934 | |||
| CTAS / Cintas Corporation | 0.04 | -0.01 | 8.33 | 8.43 | 0.2055 | -0.0337 | |||
| ELV / Elevance Health, Inc. | 0.02 | -70.35 | 8.22 | -73.49 | 0.2027 | -0.7622 | |||
| JXN / Jackson Financial Inc. | 0.09 | 7.96 | 0.1964 | 0.1964 | |||||
| COIN / Coinbase Global, Inc. | 0.02 | 515.02 | 7.53 | 1,153.41 | 0.1858 | 0.1670 | |||
| NVT / nVent Electric plc | 0.10 | -0.00 | 7.46 | 39.73 | 0.1839 | 0.0178 | |||
| WRB / W. R. Berkley Corporation | 0.10 | -0.00 | 7.21 | 3.24 | 0.1778 | -0.0396 | |||
| CI / The Cigna Group | 0.02 | 0.00 | 7.19 | 0.48 | 0.1773 | -0.0454 | |||
| EXLS / ExlService Holdings, Inc. | 0.16 | -0.00 | 7.14 | -7.24 | 0.1762 | -0.0636 | |||
| OMF / OneMain Holdings, Inc. | 0.12 | -0.00 | 6.90 | 16.61 | 0.1702 | -0.0140 | |||
| JEF / Jefferies Financial Group Inc. | 0.11 | -0.00 | 5.90 | 2.09 | 0.1454 | -0.0344 | |||
| REGN / Regeneron Pharmaceuticals, Inc. | 0.01 | 76.17 | 5.87 | 45.82 | 0.1446 | 0.0195 | |||
| PSN / Parsons Corporation | 0.08 | -0.00 | 5.69 | 21.19 | 0.1402 | -0.0058 | |||
| FIX / Comfort Systems USA, Inc. | 0.01 | 0.00 | 5.54 | 66.35 | 0.1366 | 0.0330 | |||
| MANH / Manhattan Associates, Inc. | 0.03 | 84.76 | 5.54 | 110.90 | 0.1365 | 0.0548 | |||
| TTD / The Trade Desk, Inc. | 0.08 | -0.00 | 5.47 | 31.56 | 0.1350 | 0.0055 | |||
| ULS / UL Solutions Inc. | 0.07 | -0.00 | 5.26 | 29.18 | 0.1298 | 0.0030 | |||
| CVNA / Carvana Co. | 0.02 | 5.14 | 0.1269 | 0.1269 | |||||
| IRM / Iron Mountain Incorporated | 0.05 | 5.10 | 0.1257 | 0.1257 | |||||
| LLY / Eli Lilly and Company | 0.01 | -22.81 | 5.03 | -27.14 | 0.1241 | -0.0909 | |||
| LRCX / Lam Research Corporation | 0.05 | 0.00 | 4.83 | 33.90 | 0.1190 | 0.0068 | |||
| GM / General Motors Company | 0.10 | 0.00 | 4.82 | 4.63 | 0.1188 | -0.0245 | |||
| OTIS / Otis Worldwide Corporation | 0.05 | 52.21 | 4.78 | 78.59 | 0.1178 | 0.0100 | |||
| BRKR / Bruker Corporation | 0.11 | 4.67 | 0.1151 | 0.1151 | |||||
| AFG / American Financial Group, Inc. | 0.04 | 0.00 | 4.47 | -3.89 | 0.1102 | -0.0345 | |||
| PB / Prosperity Bancshares, Inc. | 0.06 | -26.76 | 4.46 | -27.93 | 0.1100 | -0.0826 | |||
| CASY / Casey's General Stores, Inc. | 0.01 | 0.00 | 4.36 | 17.58 | 0.1075 | -0.0079 | |||
| TGTX / TG Therapeutics, Inc. | 0.12 | 0.00 | 4.31 | -8.73 | 0.1063 | -0.0407 | |||
| EMR / Emerson Electric Co. | 0.03 | 0.00 | 4.31 | 21.60 | 0.1062 | -0.0040 | |||
| PHM / PulteGroup, Inc. | 0.04 | -59.81 | 4.28 | -58.77 | 0.1055 | -0.2175 | |||
| EXP / Eagle Materials Inc. | 0.02 | -35.96 | 4.20 | -41.69 | 0.1036 | -0.1206 | |||
| MSTR / Strategy Inc | 0.01 | 254.94 | 4.17 | 397.61 | 0.1028 | 0.0768 | |||
| URI / United Rentals, Inc. | 0.01 | 0.00 | 4.16 | 20.23 | 0.1025 | -0.0051 | |||
| AFRM / Affirm Holdings, Inc. | 0.06 | 836.47 | 4.14 | 1,336.11 | 0.1020 | 0.0930 | |||
| MORN / Morningstar, Inc. | 0.01 | 4.11 | 0.1013 | 0.1013 | |||||
| AI / C3.ai, Inc. | 0.17 | 4.08 | 0.1005 | 0.1005 | |||||
| BKE / The Buckle, Inc. | 0.09 | 978.27 | 3.95 | 1,114.77 | 0.0974 | 0.0869 | |||
| MAA / Mid-America Apartment Communities, Inc. | 0.03 | -1.24 | 3.91 | -12.79 | 0.0964 | -0.0431 | |||
| VCYT / Veracyte, Inc. | 0.14 | 3.79 | 0.0935 | 0.0935 | |||||
| SITM / SiTime Corporation | 0.02 | 3.73 | 0.0920 | 0.0920 | |||||
| MSGE / Madison Square Garden Entertainment Corp. | 0.09 | 3.67 | 0.0904 | 0.0904 | |||||
| MLM / Martin Marietta Materials, Inc. | 0.01 | 0.00 | 3.65 | 14.83 | 0.0900 | -0.0089 | |||
| THO / THOR Industries, Inc. | 0.04 | 3.61 | 0.0890 | 0.0890 | |||||
| PAY / Paymentus Holdings, Inc. | 0.11 | 3.53 | 0.0869 | 0.0869 | |||||
| DGX / Quest Diagnostics Incorporated | 0.02 | 0.00 | 3.50 | 6.16 | 0.0863 | -0.0163 | |||
| LBRDK / Liberty Broadband Corporation | 0.04 | -5.69 | 3.50 | 9.11 | 0.0862 | -0.0135 | |||
| SCI / Service Corporation International | 0.04 | 0.00 | 3.49 | 1.51 | 0.0861 | -0.0210 | |||
| INFA / Informatica Inc. | 0.14 | 3.48 | 0.0858 | 0.0858 | |||||
| AMP / Ameriprise Financial, Inc. | 0.01 | 3.25 | 0.0800 | 0.0800 | |||||
| ROKU / Roku, Inc. | 0.04 | 163.51 | 3.23 | 251.90 | 0.0797 | 0.0427 | |||
| INTC / Intel Corporation | 0.14 | 352.73 | 3.22 | 171.07 | 0.0795 | 0.0225 | |||
| SLB / Schlumberger Limited | 0.09 | 0.00 | 3.20 | -19.14 | 0.0789 | -0.0442 | |||
| HBAN / Huntington Bancshares Incorporated | 0.19 | 50.32 | 3.19 | 67.88 | 0.0786 | 0.0195 | |||
| RKLB / Rocket Lab Corporation | 0.09 | -0.00 | 3.11 | 100.06 | 0.0766 | 0.0283 | |||
| NSC / Norfolk Southern Corporation | 0.01 | 0.00 | 3.08 | 8.08 | 0.0759 | -0.0127 | |||
| UCB / United Community Banks, Inc. | 0.10 | 3.06 | 0.0755 | 0.0755 | |||||
| AR / Antero Resources Corporation | 0.07 | -40.11 | 2.97 | -40.35 | 0.0731 | -0.0816 | |||
| EE / Excelerate Energy, Inc. | 0.10 | 2.96 | 0.0730 | 0.0730 | |||||
| FR / First Industrial Realty Trust, Inc. | 0.06 | -1.65 | 2.95 | -12.28 | 0.0727 | -0.0319 | |||
| COUR / Coursera, Inc. | 0.34 | -26.11 | 2.95 | -18.48 | 0.0727 | -0.0321 | |||
| KLAC / KLA Corporation | 0.00 | 0.00 | 2.92 | 31.79 | 0.0721 | 0.0030 | |||
| ACM / AECOM | 0.03 | 2.87 | 0.0709 | 0.0709 | |||||
| BNL / Broadstone Net Lease, Inc. | 0.18 | 2.86 | 0.0704 | 0.0704 | |||||
| TDS / Telephone and Data Systems, Inc. | 0.08 | -0.01 | 2.68 | -8.15 | 0.0661 | -0.0247 | |||
| AOS / Amdocs Limited | 0.03 | 39.58 | 2.66 | 109.21 | 0.0656 | -0.0151 | |||
| TXT / Textron Inc. | 0.03 | 987.52 | 2.66 | 1,108.18 | 0.0656 | 0.0587 | |||
| ELS / Equity LifeStyle Properties, Inc. | 0.04 | -0.00 | 2.65 | -7.52 | 0.0652 | -0.0238 | |||
| LNG / Cheniere Energy, Inc. | 0.01 | -70.70 | 2.64 | -69.17 | 0.0650 | -0.2011 | |||
| IBKR / Interactive Brokers Group, Inc. | 0.05 | 49.22 | 2.63 | -50.08 | 0.0649 | -0.0992 | |||
| ALK / Alaska Air Group, Inc. | 0.05 | 0.00 | 2.59 | 0.50 | 0.0640 | -0.0163 | |||
| AU / AngloGold Ashanti plc | 0.06 | 0.00 | 2.57 | 22.78 | 0.0634 | -0.0018 | |||
| MSI / Motorola Solutions, Inc. | 0.01 | 0.00 | 2.55 | -3.95 | 0.0629 | -0.0198 | |||
| MAT / Mattel, Inc. | 0.12 | 2.41 | 0.0594 | 0.0594 | |||||
| IBOC / International Bancshares Corporation | 0.04 | -16.72 | 2.37 | -12.08 | 0.0585 | -0.0255 | |||
| CPT / Camden Property Trust | 0.02 | -0.01 | 2.37 | -7.86 | 0.0584 | -0.0216 | |||
| CHWY / Chewy, Inc. | 0.06 | -15.05 | 2.36 | 11.36 | 0.0583 | -0.0078 | |||
| TYIA / Johnson Controls International plc | 0.02 | 0.00 | 2.32 | 31.86 | 0.0573 | 0.0024 | |||
| TWLO / Twilio Inc. | 0.02 | 25.25 | 2.32 | -51.18 | 0.0571 | -0.1479 | |||
| GHC / Graham Holdings Company | 0.00 | 49.91 | 2.25 | 47.64 | 0.0555 | 0.0080 | |||
| VZ / Verizon Communications Inc. | 0.05 | 2.16 | 0.0533 | 0.0533 | |||||
| SAH / Sonic Automotive, Inc. | 0.03 | 2.08 | 0.0512 | 0.0512 | |||||
| WDAY / Workday, Inc. | 0.01 | -14.43 | 2.08 | -20.39 | 0.0512 | -0.0222 | |||
| MRK / Merck & Co., Inc. | 0.03 | 0.00 | 2.07 | -11.80 | 0.0511 | -0.0220 | |||
| BLX / Banco Latinoamericano de Comercio Exterior, S. A. | 0.05 | -0.01 | 2.02 | 10.10 | 0.0497 | -0.0073 | |||
| G / Genpact Limited | 0.05 | -0.01 | 2.01 | -12.64 | 0.0496 | -0.0221 | |||
| LOPE / Grand Canyon Education, Inc. | 0.01 | 0.00 | 2.00 | 9.21 | 0.0494 | -0.0077 | |||
| CW / Curtiss-Wright Corporation | 0.00 | 0.00 | 1.95 | 54.00 | 0.0480 | 0.0087 | |||
| ORA / Ormat Technologies, Inc. | 0.02 | 1.89 | 0.0465 | 0.0465 | |||||
| SNV / Synovus Financial Corp. | 0.04 | -46.77 | 1.88 | 56.96 | 0.0464 | -0.0393 | |||
| UPWK / Upwork Inc. | 0.14 | 108.77 | 1.83 | 88.73 | 0.0450 | 0.0105 | |||
| VTR / Ventas, Inc. | 0.03 | -79.04 | 1.80 | -80.75 | 0.0443 | -0.2460 | |||
| VLO / Valero Energy Corporation | 0.01 | -58.20 | 1.77 | -57.48 | 0.0436 | -0.0858 | |||
| OHI / Omega Healthcare Investors, Inc. | 0.05 | 0.00 | 1.72 | -3.74 | 0.0425 | -0.0132 | |||
| RCL / Royal Caribbean Cruises Ltd. | 0.01 | 1.71 | 0.0421 | 0.0421 | |||||
| HES / Hess Corporation | 0.01 | 0.00 | 1.70 | -13.23 | 0.0419 | -0.0191 | |||
| BFAM / Bright Horizons Family Solutions Inc. | 0.01 | -78.29 | 1.63 | -78.88 | 0.0401 | -0.1996 | |||
| ESI / Element Solutions Inc | 0.07 | 0.00 | 1.62 | 0.19 | 0.0398 | -0.0104 | |||
| PAG / Penske Automotive Group, Inc. | 0.01 | 93.40 | 1.60 | 131.02 | 0.0395 | 0.0179 | |||
| CNO / CNO Financial Group, Inc. | 0.04 | -0.01 | 1.59 | -7.39 | 0.0393 | -0.0142 | |||
| ODFL / Old Dominion Freight Line, Inc. | 0.01 | 34.89 | 1.54 | -11.97 | 0.0381 | -0.0425 | |||
| GSHD / Goosehead Insurance, Inc | 0.01 | -18.67 | 1.53 | -27.29 | 0.0378 | -0.0278 | |||
| S&P500 EMINI / DE (000000000) | 1.52 | 0.0375 | 0.0375 | ||||||
| CCCS / CCC Intelligent Solutions Holdings Inc. | 0.16 | -54.05 | 1.51 | -52.11 | 0.0371 | -0.0608 | |||
| DAR / Darling Ingredients Inc. | 0.04 | -0.01 | 1.50 | 21.52 | 0.0370 | -0.0015 | |||
| MTG / MGIC Investment Corporation | 0.05 | -54.98 | 1.50 | -49.44 | 0.0369 | -0.0552 | |||
| PEG / Public Service Enterprise Group Incorporated | 0.02 | -7.81 | 1.41 | 10.86 | 0.0347 | -0.0177 | |||
| B3O / Nordic American Tankers Limited | 0.51 | -68.26 | 1.35 | -78.71 | 0.0334 | -0.1723 | |||
| HAS / Hasbro, Inc. | 0.02 | -90.66 | 1.31 | -90.47 | 0.0322 | -0.3650 | |||
| RGA / Reinsurance Group of America, Incorporated | 0.01 | 0.00 | 1.30 | 0.77 | 0.0321 | -0.0081 | |||
| RUN / Sunrun Inc. | 0.16 | 1.29 | 0.0317 | 0.0317 | |||||
| KMI / Kinder Morgan, Inc. | 0.04 | 0.00 | 1.28 | 3.06 | 0.0316 | -0.0071 | |||
| AM / Antero Midstream Corporation | 0.07 | 0.00 | 1.28 | 5.28 | 0.0315 | -0.0063 | |||
| DOCN / DigitalOcean Holdings, Inc. | 0.04 | 1.27 | 0.0312 | 0.0312 | |||||
| RNG / RingCentral, Inc. | 0.04 | 1.26 | 0.0310 | 0.0310 | |||||
| ENR / Energizer Holdings, Inc. | 0.06 | -12.04 | 1.24 | -37.48 | 0.0305 | -0.0642 | |||
| IQV / IQVIA Holdings Inc. | 0.01 | -95.73 | 1.23 | -96.19 | 0.0303 | -0.9741 | |||
| 7PV / Birkenstock Holding plc | 0.02 | 1.21 | 0.0299 | 0.0299 | |||||
| CRGY / Crescent Energy Company | 0.13 | 1.13 | 0.0279 | 0.0279 | |||||
| VRSN / VeriSign, Inc. | 0.00 | -23.95 | 1.09 | -13.47 | 0.0268 | -0.0123 | |||
| XYL / Xylem Inc. | 0.01 | 1.09 | 0.0268 | 0.0268 | |||||
| CSCO / Cisco Systems, Inc. | 0.01 | -90.00 | 0.92 | -88.77 | 0.0228 | -0.2331 | |||
| STRL / Sterling Infrastructure, Inc. | 0.00 | 0.00 | 0.90 | 104.09 | 0.0221 | 0.0084 | |||
| EPAM / EPAM Systems, Inc. | 0.01 | 0.00 | 0.90 | 4.79 | 0.0221 | -0.0045 | |||
| FNB / F.N.B. Corporation | 0.06 | 0.88 | 0.0218 | 0.0218 | |||||
| US21871X1090 / Corebridge Financial, Inc. | 0.02 | 0.88 | 0.0217 | 0.0217 | |||||
| VCTR / Victory Capital Holdings, Inc. | 0.01 | 0.83 | 0.0205 | 0.0205 | |||||
| EHC / Encompass Health Corporation | 0.01 | 0.00 | 0.80 | 21.15 | 0.0198 | -0.0008 | |||
| HRB / H&R Block, Inc. | 0.01 | 0.00 | 0.80 | 0.00 | 0.0198 | -0.0052 | |||
| HXL / Hexcel Corporation | 0.01 | 0.00 | 0.72 | 3.17 | 0.0176 | -0.0039 | |||
| TRUP / Trupanion, Inc. | 0.01 | -31.62 | 0.65 | -71.35 | 0.0160 | -0.0727 | |||
| LMB / Limbach Holdings, Inc. | 0.00 | 0.00 | 0.64 | 88.27 | 0.0158 | 0.0052 | |||
| AGCO / AGCO Corporation | 0.01 | 0.00 | 0.59 | 11.44 | 0.0147 | -0.0019 | |||
| TDC / Teradata Corporation | 0.03 | 0.59 | 0.0145 | 0.0145 | |||||
| RVLV / Revolve Group, Inc. | 0.03 | 0.57 | 0.0141 | 0.0141 | |||||
| KFY / Korn Ferry | 0.01 | -87.12 | 0.51 | -87.55 | 0.0126 | -0.1480 | |||
| LYFT / Lyft, Inc. | 0.03 | -86.06 | 0.50 | -82.98 | 0.0124 | -0.0704 | |||
| TRN / Trinity Industries, Inc. | 0.02 | -0.11 | 0.46 | -3.95 | 0.0114 | -0.0036 | |||
| VFC / V.F. Corporation | 0.04 | 0.44 | 0.0108 | 0.0108 | |||||
| BKNG / Booking Holdings Inc. | 0.00 | -98.36 | 0.41 | -96.41 | 0.0100 | -0.4452 | |||
| SPNS / Sapiens International Corporation N.V. | 0.01 | -35.33 | 0.36 | -30.27 | 0.0090 | -0.0073 | |||
| ACIW / ACI Worldwide, Inc. | 0.01 | -97.84 | 0.33 | -98.19 | 0.0080 | -0.5512 | |||
| DG20 / Diversified Energy Company PLC | 0.02 | -82.86 | 0.30 | -81.41 | 0.0074 | -0.0430 | |||
| CUBE / CubeSmart | 0.01 | 0.00 | 0.22 | -0.45 | 0.0055 | -0.0015 | |||
| E-MINI RUSS 2000 / DE (000000000) | 0.15 | 0.0036 | 0.0036 | ||||||
| SPG / Simon Property Group, Inc. | 0.00 | 0.00 | 0.00 | 0.0000 | -0.0000 | ||||
| FTV / Fortive Corporation | 0.00 | 0.00 | 0.00 | 0.0000 | -0.0000 | ||||
| VNO / Vornado Realty Trust | 0.00 | 0.00 | 0.00 | 0.0000 | -0.0000 | ||||
| VNT / Vontier Corporation | 0.00 | 0.00 | 0.00 | 0.0000 | -0.0000 | ||||
| CADE / Cadence Bank | 0.00 | 0.00 | 0.00 | 0.0000 | -0.0000 | ||||
| VSCO / Victoria's Secret & Co. | 0.00 | 0.00 | 0.00 | 0.0000 | -0.0000 | ||||
| AIV / Apartment Investment and Management Company | 0.00 | 0.00 | 0.00 | 0.0000 | -0.0000 | ||||
| ALRM / Alarm.com Holdings, Inc. | 0.00 | -100.00 | 0.00 | -100.00 | -0.2052 | ||||
| NLY / Annaly Capital Management, Inc. | 0.00 | -100.00 | 0.00 | -100.00 | -0.2589 | ||||
| FCFS / FirstCash Holdings, Inc. | 0.00 | -100.00 | 0.00 | -100.00 | -0.0252 | ||||
| HAL / Halliburton Company | 0.00 | -100.00 | 0.00 | -100.00 | -0.3981 | ||||
| MOV / Movado Group, Inc. | 0.00 | -100.00 | 0.00 | -100.00 | -0.0314 | ||||
| BC / Brunswick Corporation | 0.00 | -100.00 | 0.00 | -100.00 | -0.0379 | ||||
| MOV / Movado Group, Inc. | 0.00 | -100.00 | 0.00 | -100.00 | -0.0314 | ||||
| DIS / The Walt Disney Company | 0.00 | -100.00 | 0.00 | -100.00 | -1.3271 | ||||
| GPC / Genuine Parts Company | 0.00 | -100.00 | 0.00 | -100.00 | -0.0826 | ||||
| ATGE / Adtalem Global Education Inc. | 0.00 | -100.00 | 0.00 | -100.00 | -0.0805 | ||||
| FCFS / FirstCash Holdings, Inc. | 0.00 | -100.00 | 0.00 | -100.00 | -0.0252 | ||||
| NLY / Annaly Capital Management, Inc. | 0.00 | -100.00 | 0.00 | -100.00 | -0.2589 |