Statistik Asas
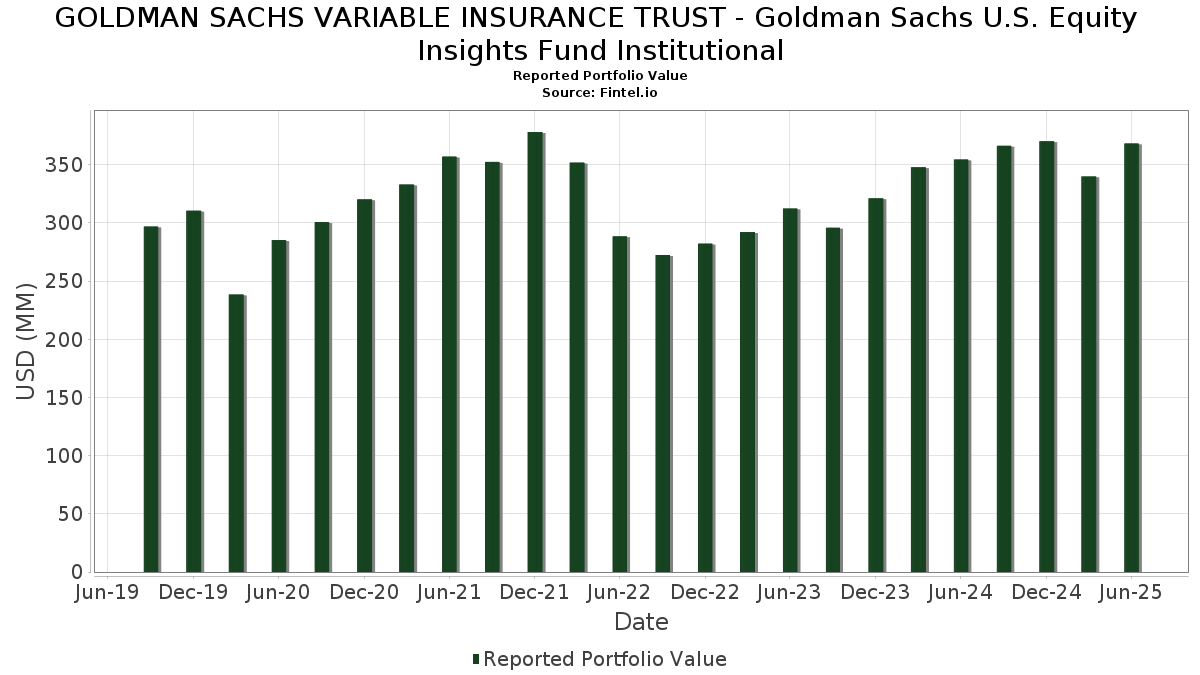
| Nilai Portfolio | $ 368,317,254 |
| Kedudukan Semasa | 158 |
Pegangan Terkini, Prestasi, AUM (dari 13F, 13D)
GOLDMAN SACHS VARIABLE INSURANCE TRUST - Goldman Sachs U.S. Equity Insights Fund Institutional telah mendedahkan 158 jumlah pegangan dalam pemfailan SEC terkini mereka. Nilai portfolio terkini dikira sebagai $ 368,317,254 USD. Aset Sebenar Di Bawah Pengurusan (AUM) ialah nilai ini ditambah dengan tunai (yang tidak didedahkan). Pegangan teratas GOLDMAN SACHS VARIABLE INSURANCE TRUST - Goldman Sachs U.S. Equity Insights Fund Institutional ialah NVIDIA Corporation (US:NVDA) , Apple Inc. (US:AAPL) , Microsoft Corporation (US:MSFT) , Amazon.com, Inc. (US:AMZN) , and Alphabet Inc. (US:GOOG) . Kedudukan baharu GOLDMAN SACHS VARIABLE INSURANCE TRUST - Goldman Sachs U.S. Equity Insights Fund Institutional termasuk Carrier Global Corporation (US:CARR) , Reddit, Inc. (US:RDDT) , Twilio Inc. (US:TWLO) , Exact Sciences Corporation (US:EXAS) , and Truist Financial Corporation (US:TFC) .
Kenaikan Teratas Suku Tahun Ini
Kami menggunakan perubahan dalam peruntukan portfolio kerana ini adalah metrik yang paling bermakna. Perubahan boleh disebabkan oleh perdagangan atau perubahan dalam harga saham.
| Sekuriti | Saham (MM) |
Nilai (MM$) |
Portfolio % | ΔPortfolio % |
|---|---|---|---|---|
| 0.02 | 7.98 | 2.1469 | 1.9811 | |
| 0.01 | 7.34 | 1.9738 | 1.8312 | |
| 0.16 | 25.93 | 6.9721 | 1.8284 | |
| 0.02 | 6.86 | 1.8440 | 1.3822 | |
| 0.04 | 5.36 | 1.4421 | 1.1506 | |
| 0.03 | 4.40 | 1.1843 | 1.1410 | |
| 0.01 | 3.70 | 0.9952 | 0.9540 | |
| 0.01 | 3.27 | 0.8797 | 0.8797 | |
| 0.03 | 3.37 | 0.9052 | 0.8471 | |
| 0.02 | 3.44 | 0.9248 | 0.6656 |
Penurunan Teratas Suku Tahun Ini
Kami menggunakan perubahan dalam peruntukan portfolio kerana ini adalah metrik yang paling bermakna. Perubahan boleh disebabkan oleh perdagangan atau perubahan dalam harga saham.
| Sekuriti | Saham (MM) |
Nilai (MM$) |
Portfolio % | ΔPortfolio % |
|---|---|---|---|---|
| 0.01 | 1.51 | 0.4055 | -1.2578 | |
| 0.01 | 1.12 | 0.3014 | -1.1966 | |
| 0.01 | 8.21 | 2.2074 | -1.0723 | |
| 0.00 | 0.39 | 0.1057 | -1.0200 | |
| 0.00 | 0.79 | 0.2125 | -0.9847 | |
| 0.01 | 1.50 | 0.4033 | -0.8834 | |
| 0.02 | 1.32 | 0.3551 | -0.8809 | |
| 0.07 | 14.28 | 3.8395 | -0.8466 | |
| 0.00 | 2.25 | 0.6056 | -0.8012 | |
| 0.00 | 2.26 | 0.6079 | -0.7946 |
13F dan Pemfailan Dana
Borang ini telah difailkan pada 2025-08-26 untuk tempoh pelaporan 2025-06-30. Klik ikon pautan untuk melihat sejarah transaksi penuh.
Tingkatkan untuk membuka data premium dan eksport ke Excel ![]() .
.
| Sekuriti | Jenis | Purata Harga Saham | Saham (MM) |
ΔSaham (%) |
ΔSaham (%) |
Nilai ($MM) |
Portfolio (%) |
ΔPortfolio (%) |
|
|---|---|---|---|---|---|---|---|---|---|
| NVDA / NVIDIA Corporation | 0.16 | 0.75 | 25.93 | 46.86 | 6.9721 | 1.8284 | |||
| AAPL / Apple Inc. | 0.12 | 5.27 | 24.83 | -2.77 | 6.6775 | -0.7637 | |||
| MSFT / Microsoft Corporation | 0.05 | -18.82 | 22.81 | 7.56 | 6.1335 | -0.0449 | |||
| AMZN / Amazon.com, Inc. | 0.07 | -23.01 | 14.28 | -11.22 | 3.8395 | -0.8466 | |||
| GOOG / Alphabet Inc. | 0.07 | 0.00 | 11.86 | 13.54 | 3.1902 | 0.1459 | |||
| AVGO / Broadcom Inc. | 0.03 | -29.77 | 9.02 | 15.62 | 2.4248 | 0.1526 | |||
| META / Meta Platforms, Inc. | 0.01 | -43.05 | 8.21 | -27.07 | 2.2074 | -1.0723 | |||
| V / Visa Inc. | 0.02 | 1,285.40 | 7.98 | 1,305.46 | 2.1469 | 1.9811 | |||
| NFLX / Netflix, Inc. | 0.01 | 944.00 | 7.34 | 1,400.82 | 1.9738 | 1.8312 | |||
| TSLA / Tesla, Inc. | 0.02 | -11.79 | 6.86 | 8.12 | 1.8452 | -0.0040 | |||
| JPM / JPMorgan Chase & Co. | 0.02 | 266.03 | 6.86 | 332.62 | 1.8440 | 1.3822 | |||
| PG / The Procter & Gamble Company | 0.04 | 0.87 | 6.23 | -5.70 | 1.6765 | -0.2499 | |||
| ABT / Abbott Laboratories | 0.04 | 422.84 | 5.36 | 436.20 | 1.4421 | 1.1506 | |||
| LIN / Linde plc | 0.01 | 27.48 | 5.30 | 28.45 | 1.4254 | 0.2230 | |||
| MS / Morgan Stanley | 0.03 | -12.71 | 4.88 | 5.37 | 1.3136 | -0.0370 | |||
| TXN / Texas Instruments Incorporated | 0.02 | -9.55 | 4.73 | 4.49 | 1.2720 | -0.0469 | |||
| BRK.B / Berkshire Hathaway Inc. | 0.01 | 8.67 | 4.50 | -0.88 | 1.2098 | -0.1127 | |||
| CME / CME Group Inc. | 0.02 | -6.29 | 4.43 | -2.64 | 1.1911 | -0.1345 | |||
| WELL / Welltower Inc. | 0.03 | 2,856.35 | 4.40 | 2,875.00 | 1.1843 | 1.1410 | |||
| PNC / The PNC Financial Services Group, Inc. | 0.02 | 0.00 | 4.27 | 6.06 | 1.1486 | -0.0248 | |||
| C / Citigroup Inc. | 0.05 | -16.31 | 4.20 | 0.36 | 1.1295 | -0.0901 | |||
| ZTS / Zoetis Inc. | 0.03 | 0.00 | 4.05 | -5.26 | 1.0891 | -0.1568 | |||
| NEE / NextEra Energy, Inc. | 0.06 | 5.00 | 3.99 | -21.92 | 1.0737 | -0.2677 | |||
| GOOGL / Alphabet Inc. | 0.02 | 112.15 | 3.97 | 141.83 | 1.0666 | 0.5886 | |||
| GE / General Electric Company | 0.01 | 1,936.54 | 3.70 | 2,524.11 | 0.9952 | 0.9540 | |||
| VZ / Verizon Communications Inc. | 0.08 | -31.94 | 3.50 | -35.08 | 0.9422 | -0.6302 | |||
| UPS / United Parcel Service, Inc. | 0.03 | -8.38 | 3.49 | -15.91 | 0.9383 | -0.2708 | |||
| REGN / Regeneron Pharmaceuticals, Inc. | 0.01 | 4.50 | 3.49 | -13.51 | 0.9382 | -0.2370 | |||
| AME / AMETEK, Inc. | 0.02 | 267.78 | 3.44 | 286.73 | 0.9248 | 0.6656 | |||
| ANET / Arista Networks Inc | 0.03 | 1,178.17 | 3.37 | 1,590.95 | 0.9052 | 0.8471 | |||
| MA / Mastercard Incorporated | 0.01 | 6.03 | 3.30 | 8.74 | 0.8869 | 0.0029 | |||
| TMUS / T-Mobile US, Inc. | 0.01 | 3.27 | 0.8797 | 0.8797 | |||||
| UHS / Universal Health Services, Inc. | 0.02 | 89.93 | 3.23 | 83.12 | 0.8693 | 0.3549 | |||
| PSA / Public Storage | 0.01 | 68.31 | 2.98 | 65.01 | 0.8016 | 0.2752 | |||
| IQV / IQVIA Holdings Inc. | 0.02 | -10.51 | 2.94 | -20.03 | 0.7916 | -0.2807 | |||
| COF / Capital One Financial Corporation | 0.01 | -42.13 | 2.90 | -31.31 | 0.7804 | -0.4509 | |||
| AMP / Ameriprise Financial, Inc. | 0.00 | -14.71 | 2.64 | -5.99 | 0.7096 | -0.1081 | |||
| QCOM / QUALCOMM Incorporated | 0.02 | -31.08 | 2.60 | -28.56 | 0.6990 | -0.3610 | |||
| MPC / Marathon Petroleum Corporation | 0.02 | 85.44 | 2.52 | 111.48 | 0.6787 | 0.3309 | |||
| KO / The Coca-Cola Company | 0.04 | -2.59 | 2.51 | -3.76 | 0.6748 | -0.0850 | |||
| COST / Costco Wholesale Corporation | 0.00 | 79.14 | 2.40 | 87.56 | 0.6448 | 0.2722 | |||
| HWM / Howmet Aerospace Inc. | 0.01 | 2.51 | 2.30 | 47.09 | 0.6183 | 0.1628 | |||
| ISRG / Intuitive Surgical, Inc. | 0.00 | -57.20 | 2.26 | -53.04 | 0.6079 | -0.7946 | |||
| EFX / Equifax Inc. | 0.01 | -45.31 | 2.26 | -41.75 | 0.6067 | -0.5221 | |||
| TRV / The Travelers Companies, Inc. | 0.01 | -48.94 | 2.26 | -48.36 | 0.6067 | -0.6658 | |||
| BKNG / Booking Holdings Inc. | 0.00 | -62.88 | 2.25 | -53.36 | 0.6056 | -0.8012 | |||
| PGR / The Progressive Corporation | 0.01 | -53.50 | 2.17 | -48.21 | 0.5844 | -0.5363 | |||
| WDAY / Workday, Inc. | 0.01 | 62.09 | 2.17 | 50.76 | 0.5831 | 0.1990 | |||
| UBER / Uber Technologies, Inc. | 0.02 | -60.41 | 2.17 | -38.77 | 0.5829 | -0.3625 | |||
| PANW / Palo Alto Networks, Inc. | 0.01 | 2.12 | 0.5714 | 0.5714 | |||||
| HD / The Home Depot, Inc. | 0.01 | 937.34 | 2.06 | 879.52 | 0.5533 | 0.4971 | |||
| NTRA / Natera, Inc. | 0.01 | 134.30 | 2.02 | 180.17 | 0.5434 | 0.3331 | |||
| DASH / DoorDash, Inc. | 0.01 | 305.39 | 1.96 | 447.08 | 0.5283 | 0.4236 | |||
| SYY / Sysco Corporation | 0.02 | 75.57 | 1.84 | 77.14 | 0.4961 | 0.1928 | |||
| KMI / Kinder Morgan, Inc. | 0.06 | -37.72 | 1.81 | -35.83 | 0.4879 | -0.3358 | |||
| CARR / Carrier Global Corporation | 0.02 | 1.81 | 0.4855 | 0.4855 | |||||
| UNH / UnitedHealth Group Incorporated | 0.01 | 44.92 | 1.79 | -13.66 | 0.4810 | -0.1228 | |||
| EQIX / Equinix, Inc. | 0.00 | 131.00 | 1.73 | 125.26 | 0.4655 | 0.2417 | |||
| INTU / Intuit Inc. | 0.00 | 16.80 | 1.70 | 46.35 | 0.4579 | 0.1472 | |||
| TDY / Teledyne Technologies Incorporated | 0.00 | 179.55 | 1.60 | 188.09 | 0.4294 | 0.2677 | |||
| CVX / Chevron Corporation | 0.01 | 114.07 | 1.58 | 111.65 | 0.4253 | 0.2257 | |||
| BFAM / Bright Horizons Family Solutions Inc. | 0.01 | 1.55 | 0.4178 | 0.4178 | |||||
| DDOG / Datadog, Inc. | 0.01 | 29.11 | 1.54 | 74.89 | 0.4139 | 0.1573 | |||
| TGT / Target Corporation | 0.02 | 499.54 | 1.54 | 337.89 | 0.4134 | 0.3195 | |||
| 7PV / Birkenstock Holding plc | 0.03 | 95.75 | 1.52 | 109.96 | 0.4083 | 0.1976 | |||
| CAT / Caterpillar Inc. | 0.00 | 169.07 | 1.51 | 217.02 | 0.4059 | 0.2670 | |||
| JNJ / Johnson & Johnson | 0.01 | -77.08 | 1.51 | -75.80 | 0.4055 | -1.2578 | |||
| GD / General Dynamics Corporation | 0.01 | -68.26 | 1.50 | -66.06 | 0.4033 | -0.8834 | |||
| RDDT / Reddit, Inc. | 0.01 | 1.45 | 0.3911 | 0.3911 | |||||
| SCCO / Southern Copper Corporation | 0.01 | 1.45 | 0.3898 | 0.3898 | |||||
| ABNB / Airbnb, Inc. | 0.01 | -60.26 | 1.42 | -55.97 | 0.3830 | -0.5596 | |||
| CVS / CVS Health Corporation | 0.02 | -69.43 | 1.32 | -68.88 | 0.3551 | -0.8809 | |||
| EXR / Extra Space Storage Inc. | 0.01 | 196.04 | 1.31 | 180.94 | 0.3531 | 0.2224 | |||
| BAC / Bank of America Corporation | 0.03 | 1.31 | 0.3529 | 0.3529 | |||||
| NOW / ServiceNow, Inc. | 0.00 | -19.66 | 1.30 | 3.76 | 0.3492 | -0.0155 | |||
| PH / Parker-Hannifin Corporation | 0.00 | -71.49 | 1.28 | -67.24 | 0.3432 | -0.7918 | |||
| RNG / RingCentral, Inc. | 0.04 | 1.27 | 0.3405 | 0.3405 | |||||
| LAMR / Lamar Advertising Company | 0.01 | 59.78 | 1.23 | 95.39 | 0.3306 | 0.1323 | |||
| LLY / Eli Lilly and Company | 0.00 | 5.22 | 1.21 | -0.74 | 0.3256 | -0.0296 | |||
| ACM / AECOM | 0.01 | 82.34 | 1.17 | 215.90 | 0.3152 | 0.1876 | |||
| TWLO / Twilio Inc. | 0.01 | 1.17 | 0.3151 | 0.3151 | |||||
| CFG / Citizens Financial Group, Inc. | 0.03 | 326.01 | 1.16 | 365.20 | 0.3128 | 0.2450 | |||
| PINS / Pinterest, Inc. | 0.03 | 856.45 | 1.15 | 889.66 | 0.3090 | 0.2758 | |||
| VEEV / Veeva Systems Inc. | 0.00 | 274.08 | 1.14 | 366.39 | 0.3062 | 0.2363 | |||
| 3IW / Invesco Ltd. | 0.07 | 1.13 | 0.3028 | 0.3028 | |||||
| ABBV / AbbVie Inc. | 0.01 | -80.70 | 1.12 | -76.90 | 0.3014 | -1.1966 | |||
| AR / Antero Resources Corporation | 0.03 | -22.03 | 1.11 | -22.37 | 0.2998 | -0.1184 | |||
| VRTX / Vertex Pharmaceuticals Incorporated | 0.00 | -28.75 | 1.09 | -21.22 | 0.2926 | -0.0763 | |||
| IT / Gartner, Inc. | 0.00 | 46.00 | 1.08 | 40.65 | 0.2895 | 0.0664 | |||
| USB / U.S. Bancorp | 0.02 | -39.69 | 1.06 | -31.25 | 0.2840 | -0.1454 | |||
| HBAN / Huntington Bancshares Incorporated | 0.06 | 442.30 | 1.05 | 506.94 | 0.2826 | 0.2320 | |||
| CFR / Cullen/Frost Bankers, Inc. | 0.01 | -13.53 | 1.05 | 2.45 | 0.2817 | -0.0341 | |||
| MTZ / MasTec, Inc. | 0.01 | 20.40 | 1.02 | 75.91 | 0.2730 | 0.1047 | |||
| BMRN / BioMarin Pharmaceutical Inc. | 0.02 | 212.22 | 1.00 | 142.96 | 0.2692 | 0.1491 | |||
| ALK / Alaska Air Group, Inc. | 0.02 | 0.00 | 0.97 | 0.52 | 0.2595 | -0.0202 | |||
| AFRM / Affirm Holdings, Inc. | 0.01 | 628.31 | 0.88 | 1,025.64 | 0.2363 | 0.2133 | |||
| VMC / Vulcan Materials Company | 0.00 | -48.24 | 0.87 | -42.14 | 0.2345 | -0.2047 | |||
| EXAS / Exact Sciences Corporation | 0.02 | 0.85 | 0.2277 | 0.2277 | |||||
| KHC / The Kraft Heinz Company | 0.03 | -2.37 | 0.82 | -25.09 | 0.2201 | -0.1456 | |||
| DLR / Digital Realty Trust, Inc. | 0.00 | -7.95 | 0.82 | 12.10 | 0.2192 | 0.0071 | |||
| CTAS / Cintas Corporation | 0.00 | -82.26 | 0.79 | -80.77 | 0.2125 | -0.9847 | |||
| INTC / Intel Corporation | 0.03 | 45.19 | 0.78 | -26.35 | 0.2090 | -0.0922 | |||
| COIN / Coinbase Global, Inc. | 0.00 | 0.77 | 0.2062 | 0.2062 | |||||
| TFC / Truist Financial Corporation | 0.02 | 0.76 | 0.2041 | 0.2041 | |||||
| MSI / Motorola Solutions, Inc. | 0.00 | 0.76 | 0.2036 | 0.2036 | |||||
| MDB / MongoDB, Inc. | 0.00 | 226.58 | 0.75 | 195.65 | 0.2012 | 0.1334 | |||
| LAD / Lithia Motors, Inc. | 0.00 | 0.72 | 0.1941 | 0.1941 | |||||
| MDT / Medtronic plc | 0.01 | 0.00 | 0.70 | -3.03 | 0.1892 | -0.0221 | |||
| OTIS / Otis Worldwide Corporation | 0.01 | 65.97 | 0.67 | 65.51 | 0.1795 | 0.0644 | |||
| ROKU / Roku, Inc. | 0.01 | 76.84 | 0.67 | 120.53 | 0.1793 | 0.0913 | |||
| CPNG / Coupang, Inc. | 0.02 | 0.64 | 0.1715 | 0.1715 | |||||
| AJG / Arthur J. Gallagher & Co. | 0.00 | 0.62 | 0.1663 | 0.1663 | |||||
| RCL / Royal Caribbean Cruises Ltd. | 0.00 | 0.62 | 0.1656 | 0.1656 | |||||
| FICO / Fair Isaac Corporation | 0.00 | -63.68 | 0.61 | -64.04 | 0.1632 | -0.3279 | |||
| MTD / Mettler-Toledo International Inc. | 0.00 | -22.94 | 0.57 | -35.22 | 0.1538 | -0.0930 | |||
| RBLX / Roblox Corporation | 0.01 | 611.25 | 0.55 | 1,197.62 | 0.1467 | 0.1343 | |||
| DOCS / Doximity, Inc. | 0.01 | 0.54 | 0.1456 | 0.1456 | |||||
| HRB / H&R Block, Inc. | 0.01 | 71.02 | 0.52 | 73.18 | 0.1409 | 0.0563 | |||
| Z / Zillow Group, Inc. | 0.01 | 0.48 | 0.1296 | 0.1296 | |||||
| GEHC / GE HealthCare Technologies Inc. | 0.01 | 0.48 | 0.1289 | 0.1289 | |||||
| MAT / Mattel, Inc. | 0.02 | 0.46 | 0.1247 | 0.1247 | |||||
| DLB / Dolby Laboratories, Inc. | 0.01 | -17.74 | 0.46 | -38.11 | 0.1232 | -0.0974 | |||
| PFG / Principal Financial Group, Inc. | 0.01 | 165.23 | 0.44 | 150.28 | 0.1193 | 0.0675 | |||
| LULU / lululemon athletica inc. | 0.00 | -73.08 | 0.43 | -77.42 | 0.1166 | -0.4425 | |||
| EEFT / Euronet Worldwide, Inc. | 0.00 | -30.03 | 0.42 | -33.60 | 0.1117 | -0.0706 | |||
| MOH / Molina Healthcare, Inc. | 0.00 | -85.97 | 0.39 | -87.35 | 0.1057 | -1.0200 | |||
| PLTR / Palantir Technologies Inc. | 0.00 | 0.39 | 0.1045 | 0.1045 | |||||
| PSN / Parsons Corporation | 0.01 | 0.39 | 0.1042 | 0.1042 | |||||
| MSCI / MSCI Inc. | 0.00 | -6.19 | 0.38 | -9.86 | 0.1034 | -0.0105 | |||
| LYFT / Lyft, Inc. | 0.02 | 0.37 | 0.0999 | 0.0999 | |||||
| AM / Antero Midstream Corporation | 0.02 | -81.60 | 0.36 | -76.38 | 0.0959 | -0.3254 | |||
| PFE / Pfizer Inc. | 0.01 | -58.03 | 0.35 | -59.86 | 0.0953 | -0.1618 | |||
| BR / Broadridge Financial Solutions, Inc. | 0.00 | -68.78 | 0.33 | -68.73 | 0.0884 | -0.2175 | |||
| ERIE / Erie Indemnity Company | 0.00 | 0.33 | 0.0880 | 0.0880 | |||||
| NWSA / News Corporation | 0.01 | 33.98 | 0.32 | 49.53 | 0.0854 | 0.0279 | |||
| JBL / Jabil Inc. | 0.00 | -87.47 | 0.31 | -77.20 | 0.0832 | -0.2837 | |||
| DRI / Darden Restaurants, Inc. | 0.00 | -87.04 | 0.31 | -81.35 | 0.0826 | -0.3776 | |||
| PEG / Public Service Enterprise Group Incorporated | 0.00 | 562.56 | 0.25 | 583.78 | 0.0681 | 0.0572 | |||
| FTI / TechnipFMC plc | 0.01 | 0.00 | 0.25 | 9.09 | 0.0678 | 0.0002 | |||
| GAP / The Gap, Inc. | 0.01 | -34.21 | 0.25 | -57.31 | 0.0675 | -0.0959 | |||
| MET / MetLife, Inc. | 0.00 | -22.44 | 0.24 | -11.24 | 0.0638 | -0.0108 | |||
| FIX / Comfort Systems USA, Inc. | 0.00 | 0.00 | 0.22 | 66.67 | 0.0593 | 0.0207 | |||
| CVNA / Carvana Co. | 0.00 | -24.66 | 0.20 | 20.96 | 0.0546 | 0.0059 | |||
| ENPH / Enphase Energy, Inc. | 0.01 | 49.49 | 0.20 | -78.67 | 0.0544 | -0.2897 | |||
| SNV / Synovus Financial Corp. | 0.00 | 0.19 | 0.0512 | 0.0512 | |||||
| IRM / Iron Mountain Incorporated | 0.00 | 0.18 | 0.0484 | 0.0484 | |||||
| GDDY / GoDaddy Inc. | 0.00 | -84.57 | 0.18 | -84.59 | 0.0479 | -0.2887 | |||
| CHWY / Chewy, Inc. | 0.00 | 89.71 | 0.16 | 347.22 | 0.0433 | 0.0312 | |||
| MTSI / MACOM Technology Solutions Holdings, Inc. | 0.00 | 0.15 | 0.0413 | 0.0413 | |||||
| MORN / Morningstar, Inc. | 0.00 | 0.15 | 0.0393 | 0.0393 | |||||
| PPC / Pilgrim's Pride Corporation | 0.00 | 0.15 | 0.0390 | 0.0390 | |||||
| G / Genpact Limited | 0.00 | 0.14 | 0.0390 | 0.0390 | |||||
| RTX / RTX Corporation | 0.00 | 0.14 | 0.0373 | 0.0373 | |||||
| TXT / Textron Inc. | 0.00 | -58.46 | 0.13 | -53.79 | 0.0345 | -0.0465 | |||
| IOT / Samsara Inc. | 0.00 | 0.11 | 0.0308 | 0.0308 | |||||
| DOCU / DocuSign, Inc. | 0.00 | -50.66 | 0.10 | -74.74 | 0.0258 | -0.0740 | |||
| S&P500 EMINI / DE (000000000) | 0.07 | 0.0196 | 0.0196 | ||||||
| S&P500 EMINI / DE (000000000) | 0.07 | 0.0196 | 0.0196 |