Statistik Asas
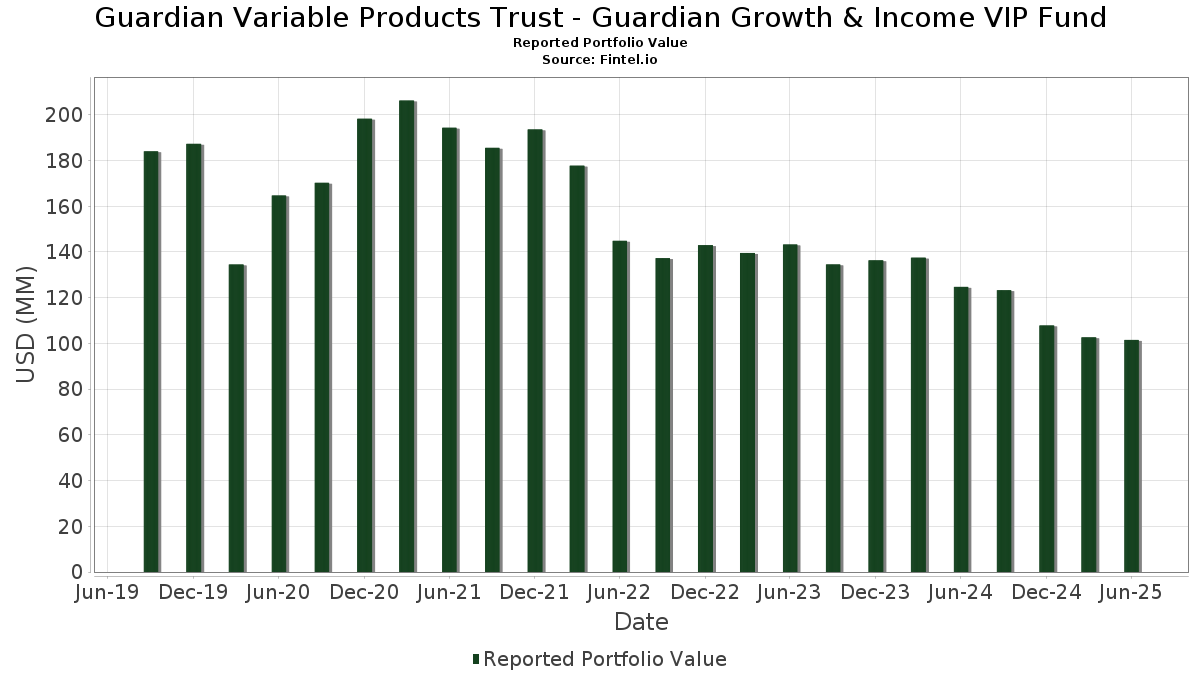
| Nilai Portfolio | $ 101,512,267 |
| Kedudukan Semasa | 74 |
Pegangan Terkini, Prestasi, AUM (dari 13F, 13D)
Guardian Variable Products Trust - Guardian Growth & Income VIP Fund telah mendedahkan 74 jumlah pegangan dalam pemfailan SEC terkini mereka. Nilai portfolio terkini dikira sebagai $ 101,512,267 USD. Aset Sebenar Di Bawah Pengurusan (AUM) ialah nilai ini ditambah dengan tunai (yang tidak didedahkan). Pegangan teratas Guardian Variable Products Trust - Guardian Growth & Income VIP Fund ialah JPMorgan Chase & Co. (US:JPM) , Berkshire Hathaway Inc. (US:BRK.B) , Philip Morris International Inc. (US:PM) , Johnson & Johnson (US:JNJ) , and Walmart Inc. (US:WMT) . Kedudukan baharu Guardian Variable Products Trust - Guardian Growth & Income VIP Fund termasuk The Walt Disney Company (US:DIS) , Agilent Technologies, Inc. (US:A) , Uber Technologies, Inc. (US:UBER) , Mondelez International, Inc. (US:MDLZ) , and Zebra Technologies Corporation (US:ZBRA) .
Kenaikan Teratas Suku Tahun Ini
Kami menggunakan perubahan dalam peruntukan portfolio kerana ini adalah metrik yang paling bermakna. Perubahan boleh disebabkan oleh perdagangan atau perubahan dalam harga saham.
| Sekuriti | Saham (MM) |
Nilai (MM$) |
Portfolio % | ΔPortfolio % |
|---|---|---|---|---|
| 2.13 | 2.1000 | 2.1000 | ||
| 0.01 | 1.78 | 1.7481 | 1.7481 | |
| 0.04 | 1.19 | 1.1729 | 1.1729 | |
| 0.01 | 0.99 | 0.9759 | 0.9759 | |
| 0.01 | 0.96 | 0.9434 | 0.9434 | |
| 0.02 | 4.36 | 4.2960 | 0.9150 | |
| 0.01 | 0.70 | 0.6873 | 0.6873 | |
| 0.02 | 1.70 | 1.6713 | 0.5720 | |
| 0.00 | 0.49 | 0.4820 | 0.4820 | |
| 0.01 | 2.59 | 2.5470 | 0.4784 |
Penurunan Teratas Suku Tahun Ini
Kami menggunakan perubahan dalam peruntukan portfolio kerana ini adalah metrik yang paling bermakna. Perubahan boleh disebabkan oleh perdagangan atau perubahan dalam harga saham.
| Sekuriti | Saham (MM) |
Nilai (MM$) |
Portfolio % | ΔPortfolio % |
|---|---|---|---|---|
| 0.01 | 2.26 | 2.2291 | -1.1281 | |
| 0.03 | 2.18 | 2.1507 | -1.0601 | |
| 0.02 | 1.87 | 1.8399 | -1.0225 | |
| 0.01 | 0.94 | 0.9212 | -0.7263 | |
| 0.01 | 0.68 | 0.6671 | -0.7072 | |
| 0.00 | 2.50 | 2.4630 | -0.6905 | |
| 0.01 | 0.65 | 0.6414 | -0.6791 | |
| 0.01 | 2.21 | 2.1735 | -0.6534 | |
| 0.00 | 2.04 | 2.0078 | -0.5830 | |
| 0.00 | 0.32 | 0.3113 | -0.5357 |
13F dan Pemfailan Dana
Borang ini telah difailkan pada 2025-08-15 untuk tempoh pelaporan 2025-06-30. Klik ikon pautan untuk melihat sejarah transaksi penuh.
Tingkatkan untuk membuka data premium dan eksport ke Excel ![]() .
.
| Sekuriti | Jenis | Purata Harga Saham | Saham (MM) |
ΔSaham (%) |
ΔSaham (%) |
Nilai ($MM) |
Portfolio (%) |
ΔPortfolio (%) |
|
|---|---|---|---|---|---|---|---|---|---|
| JPM / JPMorgan Chase & Co. | 0.02 | 6.28 | 4.36 | 25.62 | 4.2960 | 0.9150 | |||
| BRK.B / Berkshire Hathaway Inc. | 0.01 | -0.32 | 3.95 | -9.07 | 3.8877 | -0.3391 | |||
| PM / Philip Morris International Inc. | 0.02 | -23.51 | 3.81 | -12.24 | 3.7552 | -0.4745 | |||
| JNJ / Johnson & Johnson | 0.02 | 8.47 | 3.72 | -0.11 | 3.6598 | 0.0387 | |||
| WMT / Walmart Inc. | 0.03 | -12.58 | 3.33 | -2.63 | 3.2820 | -0.0499 | |||
| RTX / RTX Corporation | 0.02 | 3.65 | 3.21 | 14.29 | 3.1572 | 0.4257 | |||
| TXN / Texas Instruments Incorporated | 0.01 | 5.34 | 2.59 | 21.74 | 2.5470 | 0.4784 | |||
| SPGI / S&P Global Inc. | 0.00 | -25.60 | 2.50 | -22.81 | 2.4630 | -0.6905 | |||
| EOG / EOG Resources, Inc. | 0.02 | 19.80 | 2.50 | 11.76 | 2.4603 | 0.2837 | |||
| FI / Fiserv, Inc. | 0.01 | -15.93 | 2.26 | -34.38 | 2.2291 | -1.1281 | |||
| ELV / Elevance Health, Inc. | 0.01 | 23.89 | 2.21 | 10.76 | 2.1802 | 0.2349 | |||
| ACN / Accenture plc | 0.01 | -20.66 | 2.21 | -24.03 | 2.1735 | -0.6534 | |||
| C / Citigroup Inc. | 0.03 | -44.78 | 2.18 | -33.80 | 2.1507 | -1.0601 | |||
| FIXED INC CLEARING CORP.REPO / RA (000000000) | 2.13 | 2.1000 | 2.1000 | ||||||
| REGN / Regeneron Pharmaceuticals, Inc. | 0.00 | -7.46 | 2.04 | -23.40 | 2.0078 | -0.5830 | |||
| WFC / Wells Fargo & Company | 0.02 | -0.61 | 1.99 | 10.91 | 1.9625 | 0.2136 | |||
| AXS / AXIS Capital Holdings Limited | 0.02 | -5.41 | 1.98 | -2.03 | 1.9479 | -0.0176 | |||
| GILD / Gilead Sciences, Inc. | 0.02 | -35.78 | 1.87 | -36.45 | 1.8399 | -1.0225 | |||
| DGX / Quest Diagnostics Incorporated | 0.01 | 15.53 | 1.85 | 22.67 | 1.8166 | 0.3525 | |||
| DIS / The Walt Disney Company | 0.01 | 1.78 | 1.7481 | 1.7481 | |||||
| GNRC / Generac Holdings Inc. | 0.01 | 6.83 | 1.72 | 20.83 | 1.6905 | 0.3072 | |||
| COR / Cencora, Inc. | 0.01 | -27.98 | 1.70 | -22.34 | 1.6769 | -0.4577 | |||
| MET / MetLife, Inc. | 0.02 | 50.04 | 1.70 | 50.31 | 1.6713 | 0.5720 | |||
| VLTO / Veralto Corporation | 0.02 | 6.37 | 1.62 | 10.22 | 1.5920 | 0.1639 | |||
| WAB / Westinghouse Air Brake Technologies Corporation | 0.01 | -1.26 | 1.60 | 13.93 | 1.5788 | 0.2096 | |||
| TSM / Taiwan Semiconductor Manufacturing Company Limited - Depositary Receipt (Common Stock) | 0.01 | -14.30 | 1.55 | 16.93 | 1.5230 | 0.2354 | |||
| MA / Mastercard Incorporated | 0.00 | 15.79 | 1.48 | 18.73 | 1.4604 | 0.2443 | |||
| DKS / DICK'S Sporting Goods, Inc. | 0.01 | 22.13 | 1.37 | 19.91 | 1.3520 | 0.2369 | |||
| ULTA / Ulta Beauty, Inc. | 0.00 | -15.73 | 1.35 | 7.56 | 1.3300 | 0.1077 | |||
| CMCSA / Comcast Corporation | 0.04 | -8.60 | 1.34 | -11.64 | 1.3230 | -0.1564 | |||
| EA / Electronic Arts Inc. | 0.01 | -26.58 | 1.33 | -18.89 | 1.3107 | -0.2862 | |||
| CVX / Chevron Corporation | 0.01 | -16.49 | 1.29 | -28.51 | 1.2690 | -0.4860 | |||
| CASY / Casey's General Stores, Inc. | 0.00 | -26.36 | 1.26 | -13.48 | 1.2392 | -0.1757 | |||
| COP / ConocoPhillips | 0.01 | -0.81 | 1.23 | -15.25 | 1.2153 | -0.2020 | |||
| T / AT&T Inc. | 0.04 | 1.19 | 1.1729 | 1.1729 | |||||
| ROST / Ross Stores, Inc. | 0.01 | -5.54 | 1.13 | -5.74 | 1.1171 | -0.0539 | |||
| RHHBY / Roche Holding AG - Depositary Receipt (Common Stock) | 0.03 | -8.84 | 1.12 | -9.73 | 1.1060 | -0.1048 | |||
| CSX / CSX Corporation | 0.03 | 31.26 | 1.11 | 45.59 | 1.0879 | 0.3490 | |||
| JBHT / J.B. Hunt Transport Services, Inc. | 0.01 | -23.25 | 1.05 | -25.46 | 1.0348 | -0.3383 | |||
| HCA / HCA Healthcare, Inc. | 0.00 | 10.94 | 1.03 | 22.98 | 1.0171 | 0.1997 | |||
| PPG / PPG Industries, Inc. | 0.01 | 16.11 | 1.02 | 20.75 | 1.0089 | 0.1832 | |||
| PCAR / PACCAR Inc | 0.01 | 31.23 | 1.00 | 28.04 | 0.9850 | 0.2250 | |||
| A / Agilent Technologies, Inc. | 0.01 | 0.99 | 0.9759 | 0.9759 | |||||
| UBER / Uber Technologies, Inc. | 0.01 | 0.96 | 0.9434 | 0.9434 | |||||
| CF / CF Industries Holdings, Inc. | 0.01 | -29.21 | 0.94 | -16.70 | 0.9289 | -0.1730 | |||
| PSX / Phillips 66 | 0.01 | -42.79 | 0.94 | -44.77 | 0.9212 | -0.7263 | |||
| STLD / Steel Dynamics, Inc. | 0.01 | -24.69 | 0.90 | -22.97 | 0.8888 | -0.2511 | |||
| OTIS / Otis Worldwide Corporation | 0.01 | 27.33 | 0.88 | 22.08 | 0.8660 | 0.1653 | |||
| LOW / Lowe's Companies, Inc. | 0.00 | 10.14 | 0.83 | -4.07 | 0.8134 | 0.1877 | |||
| NICE / NICE Ltd. - Depositary Receipt (Common Stock) | 0.00 | -1.24 | 0.78 | 8.18 | 0.7685 | 0.0664 | |||
| PSA / Public Storage | 0.00 | 22.07 | 0.78 | 19.85 | 0.7669 | 0.1334 | |||
| MDLZ / Mondelez International, Inc. | 0.01 | 0.70 | 0.6873 | 0.6873 | |||||
| UTHR / United Therapeutics Corporation | 0.00 | -18.01 | 0.69 | -23.51 | 0.6823 | -0.2002 | |||
| CW / Curtiss-Wright Corporation | 0.00 | -30.42 | 0.68 | 7.09 | 0.6699 | 0.0519 | |||
| NKE / NIKE, Inc. | 0.01 | -48.48 | 0.68 | -42.35 | 0.6675 | -0.4769 | |||
| GEHC / GE HealthCare Technologies Inc. | 0.01 | -47.71 | 0.68 | -52.05 | 0.6671 | -0.7072 | |||
| NVT / nVent Electric plc | 0.01 | -36.68 | 0.67 | -11.51 | 0.6587 | -0.0772 | |||
| BXSL / Blackstone Secured Lending Fund | 0.02 | -8.50 | 0.66 | -13.00 | 0.6459 | -0.0884 | |||
| ALLE / Allegion plc | 0.00 | -0.18 | 0.65 | 10.29 | 0.6444 | 0.0668 | |||
| SBUX / Starbucks Corporation | 0.01 | -48.60 | 0.65 | -52.03 | 0.6414 | -0.6791 | |||
| MSM / MSC Industrial Direct Co., Inc. | 0.01 | 19.08 | 0.61 | 30.36 | 0.6049 | 0.1462 | |||
| LRCX / Lam Research Corporation | 0.01 | -37.77 | 0.60 | -16.71 | 0.5893 | -0.1098 | |||
| ALSN / Allison Transmission Holdings, Inc. | 0.01 | -0.68 | 0.51 | -1.35 | 0.5042 | -0.0012 | |||
| CSCO / Cisco Systems, Inc. | 0.01 | -62.26 | 0.51 | -44.96 | 0.5010 | -0.2389 | |||
| ZBRA / Zebra Technologies Corporation | 0.00 | 0.49 | 0.4820 | 0.4820 | |||||
| CSL / Carlisle Companies Incorporated | 0.00 | 0.45 | 0.4389 | 0.4389 | |||||
| MTG / MGIC Investment Corporation | 0.01 | -12.89 | 0.41 | -2.16 | 0.4020 | -0.0041 | |||
| RMD / ResMed Inc. | 0.00 | 0.40 | 0.3967 | 0.3967 | |||||
| BWA / BorgWarner Inc. | 0.01 | -29.58 | 0.35 | -17.65 | 0.3449 | -0.0694 | |||
| FCN / FTI Consulting, Inc. | 0.00 | -30.88 | 0.35 | -32.03 | 0.3434 | -0.1556 | |||
| LULU / lululemon athletica inc. | 0.00 | -56.72 | 0.32 | -63.68 | 0.3113 | -0.5357 | |||
| WHD / Cactus, Inc. | 0.01 | 53.19 | 0.31 | 46.63 | 0.3005 | 0.0972 | |||
| LSTR / Landstar System, Inc. | 0.00 | 0.25 | 0.2437 | 0.2437 | |||||
| JLL / Jones Lang LaSalle Incorporated | 0.00 | 0.21 | 0.2029 | 0.2029 |