Statistik Asas
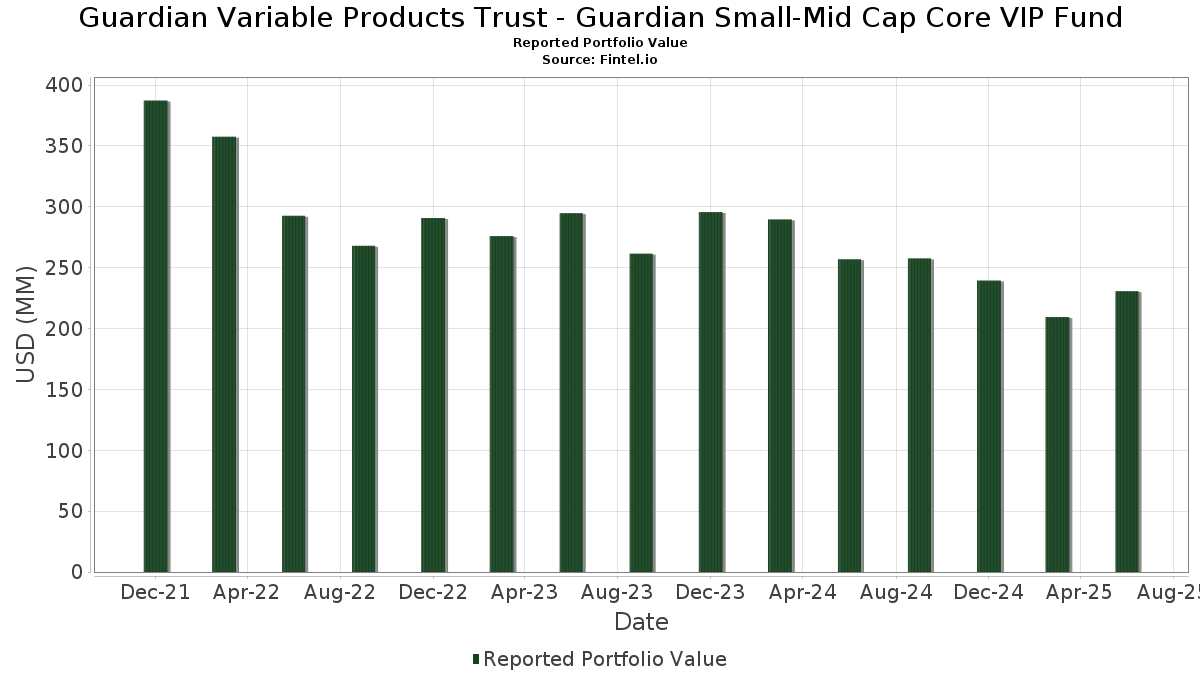
| Nilai Portfolio | $ 230,668,967 |
| Kedudukan Semasa | 74 |
Pegangan Terkini, Prestasi, AUM (dari 13F, 13D)
Guardian Variable Products Trust - Guardian Small-Mid Cap Core VIP Fund telah mendedahkan 74 jumlah pegangan dalam pemfailan SEC terkini mereka. Nilai portfolio terkini dikira sebagai $ 230,668,967 USD. Aset Sebenar Di Bawah Pengurusan (AUM) ialah nilai ini ditambah dengan tunai (yang tidak didedahkan). Pegangan teratas Guardian Variable Products Trust - Guardian Small-Mid Cap Core VIP Fund ialah Marvell Technology, Inc. (US:MRVL) , Air Lease Corporation (US:AL) , Carlisle Companies Incorporated (US:CSL) , National Vision Holdings, Inc. (US:EYE) , and QXO, Inc. (US:QXO) . Kedudukan baharu Guardian Variable Products Trust - Guardian Small-Mid Cap Core VIP Fund termasuk Antero Resources Corporation (US:AR) , BWX Technologies, Inc. (US:BWXT) , AZZ Inc. (US:AZZ) , Chewy, Inc. (US:CHWY) , and DraftKings Inc. (US:DKNG) .
Kenaikan Teratas Suku Tahun Ini
Kami menggunakan perubahan dalam peruntukan portfolio kerana ini adalah metrik yang paling bermakna. Perubahan boleh disebabkan oleh perdagangan atau perubahan dalam harga saham.
| Sekuriti | Saham (MM) |
Nilai (MM$) |
Portfolio % | ΔPortfolio % |
|---|---|---|---|---|
| 0.09 | 3.46 | 1.5018 | 1.5018 | |
| 0.02 | 3.39 | 1.4683 | 1.4683 | |
| 0.03 | 2.95 | 1.2813 | 1.2813 | |
| 0.07 | 2.93 | 1.2716 | 1.2716 | |
| 0.06 | 2.56 | 1.1122 | 1.1122 | |
| 0.10 | 2.44 | 1.0587 | 1.0587 | |
| 0.08 | 6.05 | 2.6241 | 0.9460 | |
| 0.22 | 5.13 | 2.2236 | 0.8036 | |
| 0.14 | 1.65 | 0.7152 | 0.7152 | |
| 0.21 | 4.62 | 2.0031 | 0.6965 |
Penurunan Teratas Suku Tahun Ini
Kami menggunakan perubahan dalam peruntukan portfolio kerana ini adalah metrik yang paling bermakna. Perubahan boleh disebabkan oleh perdagangan atau perubahan dalam harga saham.
| Sekuriti | Saham (MM) |
Nilai (MM$) |
Portfolio % | ΔPortfolio % |
|---|---|---|---|---|
| 0.04 | 2.78 | 1.2040 | -0.7689 | |
| 0.03 | 1.48 | 0.6428 | -0.5896 | |
| 0.06 | 2.86 | 1.2407 | -0.5464 | |
| 0.03 | 2.96 | 1.2842 | -0.5436 | |
| 0.02 | 1.88 | 0.8162 | -0.5400 | |
| 0.03 | 3.06 | 1.3255 | -0.5246 | |
| 0.02 | 1.75 | 0.7592 | -0.4060 | |
| 0.01 | 2.15 | 0.9312 | -0.3637 | |
| 0.02 | 1.53 | 0.6656 | -0.3602 | |
| 0.01 | 3.01 | 1.3069 | -0.3486 |
13F dan Pemfailan Dana
Borang ini telah difailkan pada 2025-08-15 untuk tempoh pelaporan 2025-06-30. Klik ikon pautan untuk melihat sejarah transaksi penuh.
Tingkatkan untuk membuka data premium dan eksport ke Excel ![]() .
.
| Sekuriti | Jenis | Purata Harga Saham | Saham (MM) |
ΔSaham (%) |
ΔSaham (%) |
Nilai ($MM) |
Portfolio (%) |
ΔPortfolio (%) |
|
|---|---|---|---|---|---|---|---|---|---|
| MRVL / Marvell Technology, Inc. | 0.08 | 36.98 | 6.05 | 72.25 | 2.6241 | 0.9460 | |||
| AL / Air Lease Corporation | 0.10 | 2.58 | 5.79 | 24.21 | 2.5103 | 0.2846 | |||
| CSL / Carlisle Companies Incorporated | 0.01 | 8.25 | 5.15 | 18.73 | 2.2322 | 0.1615 | |||
| EYE / National Vision Holdings, Inc. | 0.22 | -4.22 | 5.13 | 72.45 | 2.2236 | 0.8036 | |||
| QXO / QXO, Inc. | 0.21 | 6.12 | 4.62 | 68.82 | 2.0031 | 0.6965 | |||
| APG / APi Group Corporation | 0.09 | -8.48 | 4.39 | 30.66 | 1.9058 | 0.2995 | |||
| DT / Dynatrace, Inc. | 0.08 | 6.33 | 4.39 | 24.52 | 1.9025 | 0.2198 | |||
| WNS / WNS (Holdings) Limited | 0.07 | 7.88 | 4.34 | 10.95 | 1.8807 | 0.0140 | |||
| HQY / HealthEquity, Inc. | 0.04 | -4.97 | 4.32 | 12.65 | 1.8737 | 0.0422 | |||
| PLNT / Planet Fitness, Inc. | 0.04 | 22.93 | 4.23 | 38.75 | 1.8343 | 0.3785 | |||
| TDY / Teledyne Technologies Incorporated | 0.01 | 1.96 | 4.21 | 4.96 | 1.8271 | -0.0900 | |||
| 27M / Melrose Industries PLC | 0.57 | -17.73 | 4.18 | -2.70 | 1.8108 | -0.2386 | |||
| SBAC / SBA Communications Corporation | 0.02 | 9.72 | 4.16 | 17.13 | 1.8034 | 0.1077 | |||
| CCK / Crown Holdings, Inc. | 0.04 | 3.81 | 4.06 | 19.78 | 1.7624 | 0.1419 | |||
| RGA / Reinsurance Group of America, Incorporated | 0.02 | 4.67 | 3.99 | 5.47 | 1.7303 | -0.0767 | |||
| OKTA / Okta, Inc. | 0.04 | 16.77 | 3.94 | 10.96 | 1.7084 | 0.0126 | |||
| KEX / Kirby Corporation | 0.03 | 23.59 | 3.86 | 38.78 | 1.6732 | 0.3454 | |||
| RJF / Raymond James Financial, Inc. | 0.03 | 12.13 | 3.84 | 23.80 | 1.6672 | 0.1842 | |||
| UNM / Unum Group | 0.05 | 13.57 | 3.84 | 12.62 | 1.6641 | 0.0366 | |||
| AR / Antero Resources Corporation | 0.09 | 3.46 | 1.5018 | 1.5018 | |||||
| SUI / Sun Communities, Inc. | 0.03 | 1.44 | 3.46 | -0.26 | 1.5017 | -0.1562 | |||
| ALNT / Allient Inc. | 0.09 | 18.90 | 3.45 | 96.41 | 1.4940 | 0.6564 | |||
| BWXT / BWX Technologies, Inc. | 0.02 | 3.39 | 1.4683 | 1.4683 | |||||
| US7587501039 / Regal-Beloit Corp. | 0.02 | -20.20 | 3.38 | 1.62 | 1.4671 | -0.1230 | |||
| CCCS / CCC Intelligent Solutions Holdings Inc. | 0.36 | 7.04 | 3.37 | 11.57 | 1.4593 | 0.0186 | |||
| TRU / TransUnion | 0.04 | 5.76 | 3.36 | 12.14 | 1.4585 | 0.0263 | |||
| ABCB / Ameris Bancorp | 0.05 | 15.55 | 3.35 | 29.88 | 1.4516 | 0.2207 | |||
| RSG / Republic Services, Inc. | 0.01 | 8.21 | 3.33 | 10.19 | 1.4444 | 0.0010 | |||
| CUBE / CubeSmart | 0.08 | 16.06 | 3.30 | 15.49 | 1.4324 | 0.0666 | |||
| LPX / Louisiana-Pacific Corporation | 0.04 | 18.51 | 3.25 | 10.77 | 1.4098 | 0.0085 | |||
| SPSC / SPS Commerce, Inc. | 0.02 | 19.30 | 3.24 | 22.31 | 1.4053 | 0.1402 | |||
| WTFC / Wintrust Financial Corporation | 0.03 | 16.19 | 3.20 | 28.11 | 1.3898 | 0.1950 | |||
| ALGM / Allegro MicroSystems, Inc. | 0.09 | 6.64 | 3.18 | 45.12 | 1.3810 | 0.3328 | |||
| BIO / Bio-Rad Laboratories, Inc. | 0.01 | -2.74 | 3.18 | -3.60 | 1.3804 | -0.1970 | |||
| AN / AutoNation, Inc. | 0.02 | -3.59 | 3.17 | 18.30 | 1.3766 | 0.0949 | |||
| ACGL / Arch Capital Group Ltd. | 0.03 | -16.66 | 3.06 | -21.12 | 1.3255 | -0.5246 | |||
| WBS / Webster Financial Corporation | 0.06 | -2.62 | 3.01 | 3.15 | 1.3069 | -0.0885 | |||
| BURL / Burlington Stores, Inc. | 0.01 | -10.94 | 3.01 | -13.07 | 1.3069 | -0.3486 | |||
| TRNO / Terreno Realty Corporation | 0.05 | -0.28 | 3.00 | -11.57 | 1.3031 | -0.3194 | |||
| ESNT / Essent Group Ltd. | 0.05 | 1.86 | 2.97 | 7.15 | 1.2875 | -0.0355 | |||
| AXS / AXIS Capital Holdings Limited | 0.03 | -25.30 | 2.96 | -22.63 | 1.2842 | -0.5436 | |||
| AZZ / AZZ Inc. | 0.03 | 2.95 | 1.2813 | 1.2813 | |||||
| CHWY / Chewy, Inc. | 0.07 | 2.93 | 1.2716 | 1.2716 | |||||
| QTWO / Q2 Holdings, Inc. | 0.03 | -2.93 | 2.93 | 13.54 | 1.2694 | 0.0383 | |||
| CHD / Church & Dwight Co., Inc. | 0.03 | 18.97 | 2.91 | 3.85 | 1.2632 | -0.0762 | |||
| ON / ON Semiconductor Corporation | 0.06 | -30.30 | 2.89 | -10.21 | 1.2512 | -0.2837 | |||
| FAF / First American Financial Corporation | 0.05 | 17.06 | 2.88 | 9.50 | 1.2501 | -0.0072 | |||
| IP / International Paper Company | 0.06 | -12.90 | 2.86 | -23.57 | 1.2407 | -0.5464 | |||
| XBI / SPDR Series Trust - SPDR S&P Biotech ETF | 0.03 | 1.69 | 2.79 | 3.99 | 1.2109 | -0.0715 | |||
| HAE / Haemonetics Corporation | 0.04 | 0.08 | 2.78 | 17.53 | 1.2040 | 0.0756 | |||
| WLK / Westlake Corporation | 0.04 | -11.47 | 2.78 | -32.80 | 1.2040 | -0.7689 | |||
| AZTA / Azenta, Inc. | 0.09 | 36.49 | 2.76 | 21.30 | 1.1980 | 0.1102 | |||
| PNFP / Pinnacle Financial Partners, Inc. | 0.02 | -14.07 | 2.68 | -10.52 | 1.1618 | -0.2682 | |||
| LFUS / Littelfuse, Inc. | 0.01 | -24.86 | 2.64 | -13.41 | 1.1430 | -0.3106 | |||
| DKNG / DraftKings Inc. | 0.06 | 2.56 | 1.1122 | 1.1122 | |||||
| RVLV / Revolve Group, Inc. | 0.13 | 4.86 | 2.53 | -2.16 | 1.0983 | -0.1380 | |||
| LIVN / LivaNova PLC | 0.06 | -13.44 | 2.50 | -0.79 | 1.0855 | -0.1195 | |||
| CBOE / Cboe Global Markets, Inc. | 0.01 | 25.17 | 2.49 | 28.99 | 1.0808 | 0.1581 | |||
| COG / Cabot Oil & Gas Corp. | 0.10 | 2.44 | 1.0587 | 1.0587 | |||||
| CMC / Commercial Metals Company | 0.05 | -19.30 | 2.34 | -14.23 | 1.0169 | -0.2884 | |||
| HRI / Herc Holdings Inc. | 0.02 | -8.15 | 2.31 | -9.91 | 1.0016 | -0.2228 | |||
| PB / Prosperity Bancshares, Inc. | 0.03 | -13.09 | 2.25 | -14.47 | 0.9745 | -0.2801 | |||
| HCI / HCI Group, Inc. | 0.01 | -22.35 | 2.15 | -20.80 | 0.9312 | -0.3637 | |||
| BRKR / Bruker Corporation | 0.05 | -6.01 | 1.96 | -7.23 | 0.8518 | -0.1593 | |||
| HUM / Humana Inc. | 0.01 | 12.29 | 1.93 | 3.77 | 0.8367 | -0.0513 | |||
| ITGR / Integer Holdings Corporation | 0.02 | -36.40 | 1.88 | -33.71 | 0.8162 | -0.5400 | |||
| AAON / AAON, Inc. | 0.02 | -23.98 | 1.75 | -28.25 | 0.7592 | -0.4060 | |||
| PTLO / Portillo's Inc. | 0.14 | 1.65 | 0.7152 | 0.7152 | |||||
| SCI / Service Corporation International | 0.02 | -29.60 | 1.53 | -28.55 | 0.6656 | -0.3602 | |||
| ASH / Ashland Inc. | 0.03 | -32.27 | 1.48 | -42.56 | 0.6428 | -0.5896 | |||
| RSKD / Riskified Ltd. | 0.28 | 26.24 | 1.38 | 36.39 | 0.6001 | 0.1155 | |||
| THRM / Gentherm Incorporated | 0.04 | -20.12 | 1.18 | -15.50 | 0.5131 | -0.1555 | |||
| SDGR / Schrödinger, Inc. | 0.05 | 27.31 | 1.04 | 29.80 | 0.4516 | 0.0684 | |||
| FIXED INC CLEARING CORP.REPO / RA (000000000) | 0.92 | 0.3979 | 0.3979 |