Statistik Asas
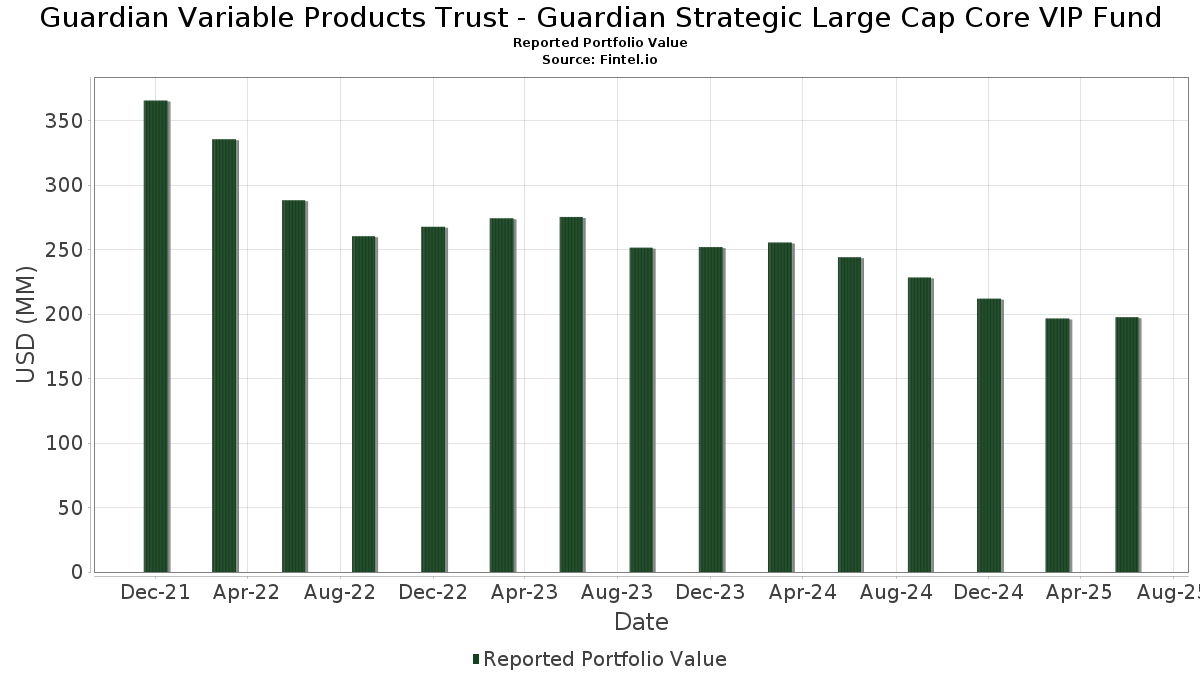
| Nilai Portfolio | $ 197,614,556 |
| Kedudukan Semasa | 83 |
Pegangan Terkini, Prestasi, AUM (dari 13F, 13D)
Guardian Variable Products Trust - Guardian Strategic Large Cap Core VIP Fund telah mendedahkan 83 jumlah pegangan dalam pemfailan SEC terkini mereka. Nilai portfolio terkini dikira sebagai $ 197,614,556 USD. Aset Sebenar Di Bawah Pengurusan (AUM) ialah nilai ini ditambah dengan tunai (yang tidak didedahkan). Pegangan teratas Guardian Variable Products Trust - Guardian Strategic Large Cap Core VIP Fund ialah Microsoft Corporation (US:MSFT) , Apple Inc. (US:AAPL) , Broadcom Inc. (US:AVGO) , NVIDIA Corporation (US:NVDA) , and Alphabet Inc. (US:GOOG) . Kedudukan baharu Guardian Variable Products Trust - Guardian Strategic Large Cap Core VIP Fund termasuk Roper Technologies, Inc. (US:ROP) , Netflix, Inc. (US:NFLX) , Monster Beverage Corporation (US:MNST) , Veralto Corporation (US:VLTO) , and The Hanover Insurance Group, Inc. (US:THG) .
Kenaikan Teratas Suku Tahun Ini
Kami menggunakan perubahan dalam peruntukan portfolio kerana ini adalah metrik yang paling bermakna. Perubahan boleh disebabkan oleh perdagangan atau perubahan dalam harga saham.
| Sekuriti | Saham (MM) |
Nilai (MM$) |
Portfolio % | ΔPortfolio % |
|---|---|---|---|---|
| 0.03 | 16.99 | 8.5988 | 1.6042 | |
| 0.02 | 6.63 | 3.3530 | 1.2861 | |
| 0.04 | 6.29 | 3.1852 | 1.2677 | |
| 0.01 | 2.85 | 1.4441 | 0.9450 | |
| 0.00 | 1.42 | 0.7170 | 0.7170 | |
| 1.41 | 0.7153 | 0.7153 | ||
| 0.02 | 3.62 | 1.8342 | 0.6708 | |
| 0.00 | 3.53 | 1.7853 | 0.6685 | |
| 0.00 | 1.23 | 0.6234 | 0.6234 | |
| 0.01 | 2.12 | 1.0707 | 0.5964 |
Penurunan Teratas Suku Tahun Ini
Kami menggunakan perubahan dalam peruntukan portfolio kerana ini adalah metrik yang paling bermakna. Perubahan boleh disebabkan oleh perdagangan atau perubahan dalam harga saham.
| Sekuriti | Saham (MM) |
Nilai (MM$) |
Portfolio % | ΔPortfolio % |
|---|---|---|---|---|
| 0.02 | 2.82 | 1.4283 | -1.1325 | |
| 0.01 | 1.88 | 0.9528 | -0.8097 | |
| 0.00 | 0.57 | 0.2882 | -0.7441 | |
| 0.02 | 2.83 | 1.4324 | -0.7413 | |
| 0.03 | 2.12 | 1.0742 | -0.5016 | |
| 0.02 | 2.20 | 1.1152 | -0.5000 | |
| 0.04 | 8.41 | 4.2530 | -0.4898 | |
| 0.01 | 1.91 | 0.9677 | -0.4844 | |
| 0.02 | 4.49 | 2.2734 | -0.4304 | |
| 0.00 | 1.02 | 0.5162 | -0.4200 |
13F dan Pemfailan Dana
Borang ini telah difailkan pada 2025-08-15 untuk tempoh pelaporan 2025-06-30. Klik ikon pautan untuk melihat sejarah transaksi penuh.
Tingkatkan untuk membuka data premium dan eksport ke Excel ![]() .
.
| Sekuriti | Jenis | Purata Harga Saham | Saham (MM) |
ΔSaham (%) |
ΔSaham (%) |
Nilai ($MM) |
Portfolio (%) |
ΔPortfolio (%) |
|
|---|---|---|---|---|---|---|---|---|---|
| MSFT / Microsoft Corporation | 0.03 | -6.74 | 16.99 | 23.58 | 8.5988 | 1.6042 | |||
| AAPL / Apple Inc. | 0.04 | -2.41 | 8.41 | -9.86 | 4.2530 | -0.4898 | |||
| AVGO / Broadcom Inc. | 0.02 | -0.95 | 6.63 | 63.08 | 3.3530 | 1.2861 | |||
| NVDA / NVIDIA Corporation | 0.04 | 14.55 | 6.29 | 66.99 | 3.1852 | 1.2677 | |||
| GOOG / Alphabet Inc. | 0.03 | -12.73 | 5.59 | -0.90 | 2.8280 | -0.0409 | |||
| META / Meta Platforms, Inc. | 0.01 | -3.57 | 4.78 | 23.50 | 2.4204 | 0.4501 | |||
| AMZN / Amazon.com, Inc. | 0.02 | -26.70 | 4.49 | -15.48 | 2.2734 | -0.4304 | |||
| V / Visa Inc. | 0.01 | -6.18 | 4.42 | -4.95 | 2.2367 | -0.1288 | |||
| INTU / Intuit Inc. | 0.01 | -6.51 | 4.40 | 19.91 | 2.2278 | 0.3606 | |||
| MCK / McKesson Corporation | 0.01 | -14.65 | 3.84 | -7.07 | 1.9436 | -0.1588 | |||
| ORCL / Oracle Corporation | 0.02 | 1.34 | 3.62 | 58.46 | 1.8342 | 0.6708 | |||
| NOW / ServiceNow, Inc. | 0.00 | 24.44 | 3.53 | 60.73 | 1.7853 | 0.6685 | |||
| ADP / Automatic Data Processing, Inc. | 0.01 | -5.74 | 3.34 | -4.84 | 1.6901 | -0.0956 | |||
| AZO / AutoZone, Inc. | 0.00 | -6.19 | 3.26 | -8.65 | 1.6511 | -0.1661 | |||
| JPM / JPMorgan Chase & Co. | 0.01 | -16.75 | 3.14 | -1.63 | 1.5891 | -0.0345 | |||
| MRK / Merck & Co., Inc. | 0.04 | -5.74 | 3.13 | -16.88 | 1.5845 | -0.3316 | |||
| GILD / Gilead Sciences, Inc. | 0.03 | -6.31 | 3.11 | -7.28 | 1.5731 | -0.1328 | |||
| CMPGY / Compass Group PLC - Depositary Receipt (Common Stock) | 0.08 | -2.36 | 2.93 | 1.42 | 1.4817 | 0.0133 | |||
| AEP / American Electric Power Company, Inc. | 0.03 | -6.31 | 2.86 | -11.04 | 1.4485 | -0.1881 | |||
| TSM / Taiwan Semiconductor Manufacturing Company Limited - Depositary Receipt (Common Stock) | 0.01 | 113.18 | 2.85 | 190.93 | 1.4441 | 0.9450 | |||
| BAC / Bank of America Corporation | 0.06 | 13.38 | 2.85 | 28.60 | 1.4428 | 0.3147 | |||
| PM / Philip Morris International Inc. | 0.02 | -42.27 | 2.83 | -33.77 | 1.4324 | -0.7413 | |||
| FI / Fiserv, Inc. | 0.02 | -28.19 | 2.82 | -43.94 | 1.4283 | -1.1325 | |||
| CRM / Salesforce, Inc. | 0.01 | 28.71 | 2.75 | 30.77 | 1.3918 | 0.3221 | |||
| ABBV / AbbVie Inc. | 0.01 | -6.90 | 2.63 | -17.53 | 1.3289 | -0.2907 | |||
| SHEL / Shell plc - Depositary Receipt (Common Stock) | 0.04 | -18.15 | 2.58 | -21.36 | 1.3043 | -0.3629 | |||
| MA / Mastercard Incorporated | 0.00 | -1.09 | 2.56 | 1.39 | 1.2937 | 0.0113 | |||
| BKNG / Booking Holdings Inc. | 0.00 | -8.64 | 2.45 | 14.82 | 1.2391 | 0.1542 | |||
| CBOE / Cboe Global Markets, Inc. | 0.01 | -12.16 | 2.35 | -9.46 | 1.1871 | -0.1311 | |||
| BAESY / BAE Systems plc - Depositary Receipt (Common Stock) | 0.02 | -18.87 | 2.35 | 3.67 | 1.1866 | 0.0360 | |||
| EXPGY / Experian plc - Depositary Receipt (Common Stock) | 0.05 | 4.19 | 2.31 | 15.35 | 1.1710 | 0.1503 | |||
| ADI / Analog Devices, Inc. | 0.01 | 57.88 | 2.21 | 86.33 | 1.1176 | 0.5147 | |||
| AEE / Ameren Corporation | 0.02 | -27.44 | 2.20 | -30.58 | 1.1152 | -0.5000 | |||
| LHX / L3Harris Technologies, Inc. | 0.01 | -4.72 | 2.17 | 14.20 | 1.0993 | 0.1315 | |||
| KO / The Coca-Cola Company | 0.03 | -30.63 | 2.12 | -31.48 | 1.0742 | -0.5016 | |||
| LDOS / Leidos Holdings, Inc. | 0.01 | 94.11 | 2.12 | 127.04 | 1.0707 | 0.5964 | |||
| LLY / Eli Lilly and Company | 0.00 | -8.83 | 2.07 | -13.98 | 1.0468 | -0.1760 | |||
| NICE / NICE Ltd. - Depositary Receipt (Common Stock) | 0.01 | 50.30 | 2.00 | 64.72 | 1.0113 | 0.3940 | |||
| TRV / The Travelers Companies, Inc. | 0.01 | -10.33 | 2.00 | -9.31 | 1.0104 | -0.1093 | |||
| CPAY / Corpay, Inc. | 0.01 | 73.87 | 1.98 | 65.52 | 1.0010 | 0.3928 | |||
| NYT / The New York Times Company | 0.04 | 5.91 | 1.97 | 19.57 | 0.9955 | 0.1583 | |||
| G / Genpact Limited | 0.04 | -8.68 | 1.93 | -20.26 | 0.9764 | -0.2540 | |||
| MMC / Marsh & McLennan Companies, Inc. | 0.01 | -25.23 | 1.91 | -33.01 | 0.9677 | -0.4844 | |||
| MDT / Medtronic plc | 0.02 | -9.49 | 1.90 | -12.18 | 0.9594 | -0.1390 | |||
| UNH / UnitedHealth Group Incorporated | 0.01 | -8.77 | 1.88 | -45.66 | 0.9528 | -0.8097 | |||
| ADBE / Adobe Inc. | 0.00 | 21.48 | 1.88 | 22.54 | 0.9520 | 0.1711 | |||
| RELX / RELX PLC - Depositary Receipt (Common Stock) | 0.03 | -6.32 | 1.86 | 0.98 | 0.9411 | 0.0043 | |||
| DOX / Amdocs Limited | 0.02 | -5.19 | 1.78 | -5.46 | 0.9027 | -0.0571 | |||
| PG / The Procter & Gamble Company | 0.01 | -26.38 | 1.54 | -31.19 | 0.7807 | -0.3595 | |||
| STN / Stantec Inc. | 0.01 | -6.42 | 1.53 | 22.84 | 0.7757 | 0.1406 | |||
| CL / Colgate-Palmolive Company | 0.02 | -0.47 | 1.53 | -3.40 | 0.7752 | -0.0319 | |||
| CMCSA / Comcast Corporation | 0.04 | -27.18 | 1.50 | -29.58 | 0.7593 | -0.3243 | |||
| LULU / lululemon athletica inc. | 0.01 | -5.45 | 1.44 | -20.63 | 0.7303 | -0.1947 | |||
| WTY / Willis Towers Watson Public Limited Company | 0.00 | -8.12 | 1.42 | -16.65 | 0.7198 | -0.1485 | |||
| ROP / Roper Technologies, Inc. | 0.00 | 1.42 | 0.7170 | 0.7170 | |||||
| FIXED INC CLEARING CORP.REPO / RA (000000000) | 1.41 | 0.7153 | 0.7153 | ||||||
| J / Jacobs Solutions Inc. | 0.01 | -7.10 | 1.39 | 1.02 | 0.7052 | 0.0035 | |||
| EA / Electronic Arts Inc. | 0.01 | -17.88 | 1.38 | -9.22 | 0.6978 | -0.0752 | |||
| MSCI / MSCI Inc. | 0.00 | 6.46 | 1.33 | 8.58 | 0.6729 | 0.0499 | |||
| SPGI / S&P Global Inc. | 0.00 | -7.79 | 1.25 | -4.30 | 0.6313 | -0.0319 | |||
| NFLX / Netflix, Inc. | 0.00 | 1.23 | 0.6234 | 0.6234 | |||||
| PSA / Public Storage | 0.00 | -7.48 | 1.20 | -9.25 | 0.6057 | -0.0656 | |||
| XOM / Exxon Mobil Corporation | 0.01 | -8.57 | 1.08 | -17.16 | 0.5473 | -0.1165 | |||
| YUM / Yum! Brands, Inc. | 0.01 | -28.36 | 1.06 | -32.55 | 0.5352 | -0.2623 | |||
| SHW / The Sherwin-Williams Company | 0.00 | -43.63 | 1.02 | -44.57 | 0.5162 | -0.4200 | |||
| MTB / M&T Bank Corporation | 0.01 | -9.51 | 1.01 | -1.84 | 0.5135 | -0.0121 | |||
| MNST / Monster Beverage Corporation | 0.02 | 1.00 | 0.5052 | 0.5052 | |||||
| VLTO / Veralto Corporation | 0.01 | 0.99 | 0.5031 | 0.5031 | |||||
| THG / The Hanover Insurance Group, Inc. | 0.01 | 0.98 | 0.4934 | 0.4934 | |||||
| ORLY / O'Reilly Automotive, Inc. | 0.01 | 1,400.00 | 0.97 | -5.63 | 0.4918 | -0.0321 | |||
| GEN / Gen Digital Inc. | 0.03 | -9.49 | 0.97 | 0.21 | 0.4892 | -0.0013 | |||
| ADRNY / Koninklijke Ahold Delhaize N.V. - Depositary Receipt (Common Stock) | 0.02 | -41.78 | 0.96 | -35.04 | 0.4872 | -0.2663 | |||
| RGA / Reinsurance Group of America, Incorporated | 0.00 | -9.23 | 0.96 | -8.52 | 0.4835 | -0.0480 | |||
| TMO / Thermo Fisher Scientific Inc. | 0.00 | -8.48 | 0.87 | -25.49 | 0.4427 | -0.1541 | |||
| AFG / American Financial Group, Inc. | 0.01 | 0.00 | 0.87 | -3.88 | 0.4383 | -0.0202 | |||
| WTKWY / Wolters Kluwer N.V. - Depositary Receipt (Common Stock) | 0.01 | 0.85 | 0.4297 | 0.4297 | |||||
| ETN / Eaton Corporation plc | 0.00 | -12.14 | 0.78 | 15.45 | 0.3934 | 0.0507 | |||
| CME / CME Group Inc. | 0.00 | -41.92 | 0.68 | -39.65 | 0.3452 | -0.2298 | |||
| FR / First Industrial Realty Trust, Inc. | 0.01 | 0.00 | 0.68 | -10.89 | 0.3441 | -0.0437 | |||
| VRTX / Vertex Pharmaceuticals Incorporated | 0.00 | -29.88 | 0.58 | -35.68 | 0.2960 | -0.1661 | |||
| BAH / Booz Allen Hamilton Holding Corporation | 0.01 | -14.79 | 0.58 | -15.19 | 0.2914 | -0.0539 | |||
| EG / Everest Group, Ltd. | 0.00 | -70.00 | 0.57 | -71.96 | 0.2882 | -0.7441 | |||
| WMT / Walmart Inc. | 0.00 | -37.50 | 0.48 | -30.36 | 0.2450 | -0.1087 |