Statistik Asas
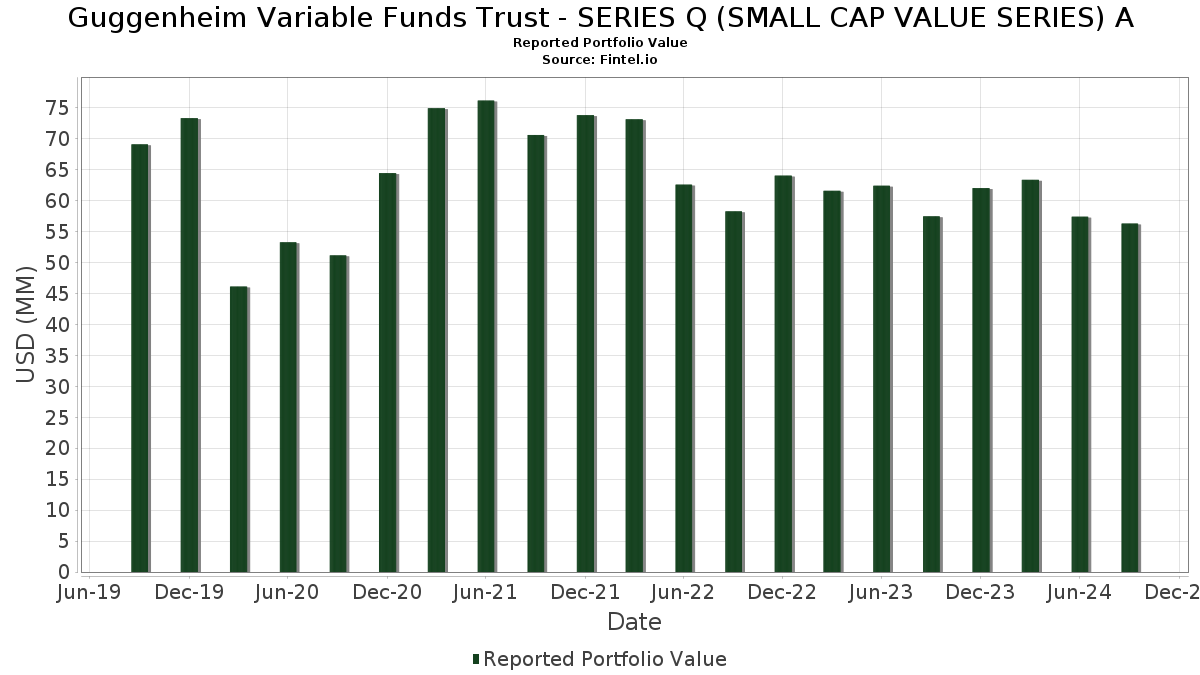
| Nilai Portfolio | $ 56,288,611 |
| Kedudukan Semasa | 100 |
Pegangan Terkini, Prestasi, AUM (dari 13F, 13D)
Guggenheim Variable Funds Trust - SERIES Q (SMALL CAP VALUE SERIES) A telah mendedahkan 100 jumlah pegangan dalam pemfailan SEC terkini mereka. Nilai portfolio terkini dikira sebagai $ 56,288,611 USD. Aset Sebenar Di Bawah Pengurusan (AUM) ialah nilai ini ditambah dengan tunai (yang tidak didedahkan). Pegangan teratas Guggenheim Variable Funds Trust - SERIES Q (SMALL CAP VALUE SERIES) A ialah Dreyfus Treasury Securities Cash Management - Dreyfus Treasury Securities Cash Management Institutional Shares (US:DIRXX) , iShares Trust - iShares Russell 2000 Value ETF (US:IWN) , CNX Resources Corporation (US:CNX) , Stifel Financial Corp. (US:SF) , and Rush Enterprises, Inc. (US:RUSHA) .
Kenaikan Teratas Suku Tahun Ini
Kami menggunakan perubahan dalam peruntukan portfolio kerana ini adalah metrik yang paling bermakna. Perubahan boleh disebabkan oleh perdagangan atau perubahan dalam harga saham.
| Sekuriti | Saham (MM) |
Nilai (MM$) |
Portfolio % | ΔPortfolio % |
|---|---|---|---|---|
| 1.71 | 1.71 | 3.0464 | 0.5314 | |
| 0.04 | 1.24 | 2.2110 | 0.5081 | |
| 0.01 | 1.58 | 2.8018 | 0.2932 | |
| 0.00 | 0.88 | 1.5618 | 0.2325 | |
| 0.01 | 1.01 | 1.7936 | 0.2309 | |
| 0.00 | 0.81 | 1.4458 | 0.2098 | |
| 0.03 | 0.45 | 0.7998 | 0.2043 | |
| 0.01 | 0.64 | 1.1423 | 0.1890 | |
| 0.01 | 0.53 | 0.9441 | 0.1817 | |
| 0.01 | 1.05 | 1.8642 | 0.1704 |
Penurunan Teratas Suku Tahun Ini
Kami menggunakan perubahan dalam peruntukan portfolio kerana ini adalah metrik yang paling bermakna. Perubahan boleh disebabkan oleh perdagangan atau perubahan dalam harga saham.
| Sekuriti | Saham (MM) |
Nilai (MM$) |
Portfolio % | ΔPortfolio % |
|---|---|---|---|---|
| 0.01 | 1.08 | 1.9209 | -1.1284 | |
| 0.03 | 0.88 | 1.5661 | -0.4099 | |
| 0.01 | 1.14 | 2.0217 | -0.3388 | |
| 0.02 | 0.54 | 0.9553 | -0.3344 | |
| 0.05 | 0.41 | 0.7199 | -0.2865 | |
| 0.05 | 1.02 | 1.8112 | -0.2348 | |
| 0.01 | 0.67 | 1.1915 | -0.2219 | |
| 0.00 | 0.17 | 0.3054 | -0.2067 | |
| 0.01 | 1.05 | 1.8700 | -0.1538 | |
| 0.01 | 0.91 | 1.6183 | -0.1242 |
13F dan Pemfailan Dana
Borang ini telah difailkan pada 2024-11-29 untuk tempoh pelaporan 2024-09-30. Klik ikon pautan untuk melihat sejarah transaksi penuh.
Tingkatkan untuk membuka data premium dan eksport ke Excel ![]() .
.
| Sekuriti | Jenis | Purata Harga Saham | Saham (MM) |
ΔSaham (%) |
ΔSaham (%) |
Nilai ($MM) |
Portfolio (%) |
ΔPortfolio (%) |
|
|---|---|---|---|---|---|---|---|---|---|
| DIRXX / Dreyfus Treasury Securities Cash Management - Dreyfus Treasury Securities Cash Management Institutional Shares | 1.71 | 18.80 | 1.71 | 18.78 | 3.0464 | 0.5314 | |||
| IWN / iShares Trust - iShares Russell 2000 Value ETF | 0.01 | 0.00 | 1.58 | 9.59 | 2.8018 | 0.2932 | |||
| CNX / CNX Resources Corporation | 0.04 | -5.00 | 1.24 | 27.33 | 2.2110 | 0.5081 | |||
| SF / Stifel Financial Corp. | 0.01 | -15.75 | 1.17 | -6.01 | 2.0830 | -0.0899 | |||
| RUSHA / Rush Enterprises, Inc. | 0.02 | -17.76 | 1.17 | 3.72 | 2.0830 | 0.1143 | |||
| EHC / Encompass Health Corporation | 0.01 | -25.43 | 1.14 | -15.95 | 2.0217 | -0.3388 | |||
| OGE / OGE Energy Corp. | 0.03 | -10.01 | 1.13 | 3.39 | 2.0048 | 0.1032 | |||
| KEX / Kirby Corporation | 0.01 | -4.99 | 1.09 | -2.85 | 1.9410 | -0.0184 | |||
| XBI / SPDR Series Trust - SPDR S&P Biotech ETF | 0.01 | -42.03 | 1.08 | -38.23 | 1.9209 | -1.1284 | |||
| MGPI / MGP Ingredients, Inc. | 0.01 | -19.01 | 1.05 | -9.39 | 1.8700 | -0.1538 | |||
| ACA / Arcosa, Inc. | 0.01 | -4.99 | 1.05 | 7.92 | 1.8642 | 0.1704 | |||
| LBRT / Liberty Energy Inc. | 0.05 | -5.00 | 1.02 | -13.20 | 1.8112 | -0.2348 | |||
| SAIC / Science Applications International Corporation | 0.01 | -4.99 | 1.01 | 12.49 | 1.7936 | 0.2309 | |||
| ONB / Old National Bancorp | 0.05 | -5.00 | 0.97 | 3.21 | 1.7144 | 0.0840 | |||
| EEFT / Euronet Worldwide, Inc. | 0.01 | -5.00 | 0.91 | -8.90 | 1.6183 | -0.1242 | |||
| MUR / Murphy Oil Corporation | 0.03 | -5.00 | 0.88 | -22.31 | 1.5661 | -0.4099 | |||
| CW / Curtiss-Wright Corporation | 0.00 | -5.01 | 0.88 | 15.20 | 1.5618 | 0.2325 | |||
| CATY / Cathay General Bancorp | 0.02 | -5.00 | 0.87 | 8.06 | 1.5489 | 0.1447 | |||
| HEES / H&E Equipment Services, Inc. | 0.02 | -5.00 | 0.86 | 4.62 | 1.5310 | 0.0970 | |||
| STAG / STAG Industrial, Inc. | 0.02 | -5.00 | 0.84 | 2.94 | 1.4921 | 0.0712 | |||
| SUM / Summit Materials, Inc. | 0.02 | -5.00 | 0.83 | 1.35 | 1.4659 | 0.0465 | |||
| MOGA / Moog, Inc. - Class A | 0.00 | -5.00 | 0.81 | 14.67 | 1.4458 | 0.2098 | |||
| DOC / Healthpeak Properties, Inc. | 0.03 | -5.00 | 0.79 | 10.89 | 1.4117 | 0.1628 | |||
| AVNT / Avient Corporation | 0.02 | -4.99 | 0.76 | 9.58 | 1.3414 | 0.1402 | |||
| FHN / First Horizon Corporation | 0.05 | -5.00 | 0.74 | -6.42 | 1.3211 | -0.0637 | |||
| ENOV / Enovis Corporation | 0.02 | -5.00 | 0.71 | -9.53 | 1.2650 | -0.1061 | |||
| ORI / Old Republic International Corporation | 0.02 | -5.00 | 0.71 | 9.06 | 1.2613 | 0.1254 | |||
| RDNT / RadNet, Inc. | 0.01 | -4.99 | 0.70 | 11.86 | 1.2407 | 0.1532 | |||
| KNX / Knight-Swift Transportation Holdings Inc. | 0.01 | -5.00 | 0.69 | 2.67 | 1.2316 | 0.0552 | |||
| MDU / MDU Resources Group, Inc. | 0.03 | -5.00 | 0.69 | 3.78 | 1.2218 | 0.0668 | |||
| UNM / Unum Group | 0.01 | -28.91 | 0.67 | -17.39 | 1.1915 | -0.2219 | |||
| AEIS / Advanced Energy Industries, Inc. | 0.01 | -5.00 | 0.67 | -8.10 | 1.1899 | -0.0796 | |||
| FRME / First Merchants Corporation | 0.02 | -5.00 | 0.66 | 6.16 | 1.1643 | 0.0887 | |||
| JEF / Jefferies Financial Group Inc. | 0.01 | -4.99 | 0.64 | 17.55 | 1.1423 | 0.1890 | |||
| LXP / LXP Industrial Trust | 0.06 | -5.00 | 0.64 | 4.75 | 1.1374 | 0.0719 | |||
| ADUS / Addus HomeCare Corporation | 0.00 | -4.99 | 0.64 | 8.87 | 1.1333 | 0.1122 | |||
| HAFC / Hanmi Financial Corporation | 0.03 | -5.00 | 0.63 | 5.72 | 1.1165 | 0.0804 | |||
| INGR / Ingredion Incorporated | 0.00 | -5.00 | 0.62 | 13.79 | 1.1000 | 0.1523 | |||
| PB / Prosperity Bancshares, Inc. | 0.01 | -4.99 | 0.61 | 12.13 | 1.0840 | 0.1347 | |||
| HWC / Hancock Whitney Corporation | 0.01 | -4.99 | 0.59 | 1.54 | 1.0548 | 0.0370 | |||
| FAF / First American Financial Corporation | 0.01 | -5.00 | 0.59 | 16.34 | 1.0504 | 0.1642 | |||
| CENTA / Central Garden & Pet Company | 0.02 | -5.00 | 0.58 | -9.78 | 1.0332 | -0.0887 | |||
| ESAB / ESAB Corporation | 0.01 | -4.99 | 0.57 | 6.94 | 1.0141 | 0.0843 | |||
| SON / Sonoco Products Company | 0.01 | -4.99 | 0.55 | 2.22 | 0.9820 | 0.0408 | |||
| GPK / Graphic Packaging Holding Company | 0.02 | -5.00 | 0.54 | 7.36 | 0.9594 | 0.0821 | |||
| AMKR / Amkor Technology, Inc. | 0.02 | -5.00 | 0.54 | -27.43 | 0.9553 | -0.3344 | |||
| CIEN / Ciena Corporation | 0.01 | -5.00 | 0.53 | 21.51 | 0.9441 | 0.1817 | |||
| ASH / Ashland Inc. | 0.01 | -5.00 | 0.52 | -12.52 | 0.9186 | -0.1117 | |||
| LIVN / LivaNova PLC | 0.01 | -4.99 | 0.52 | -8.99 | 0.9178 | -0.0707 | |||
| ALK / Alaska Air Group, Inc. | 0.01 | -4.99 | 0.52 | 6.40 | 0.9150 | 0.0709 | |||
| ICFI / ICF International, Inc. | 0.00 | -5.01 | 0.50 | 6.79 | 0.8936 | 0.0724 | |||
| SAH / Sonic Automotive, Inc. | 0.01 | -5.00 | 0.50 | 1.85 | 0.8828 | 0.0340 | |||
| CMC / Commercial Metals Company | 0.01 | -5.00 | 0.47 | -5.07 | 0.8326 | -0.0274 | |||
| SR / Spire Inc. | 0.01 | -4.99 | 0.46 | 5.23 | 0.8232 | 0.0563 | |||
| MP / MP Materials Corp. | 0.03 | -5.00 | 0.45 | 31.96 | 0.7998 | 0.2043 | |||
| PRDO / Perdoceo Education Corporation | 0.02 | -4.99 | 0.44 | -1.35 | 0.7807 | 0.0045 | |||
| WETF / Wisdomtree Investments Inc | 0.04 | -5.00 | 0.44 | -4.15 | 0.7804 | -0.0188 | |||
| JLL / Jones Lang LaSalle Incorporated | 0.00 | -5.01 | 0.43 | 24.71 | 0.7726 | 0.1657 | |||
| BKH / Black Hills Corporation | 0.01 | -5.00 | 0.43 | 6.72 | 0.7636 | 0.0622 | |||
| APLE / Apple Hospitality REIT, Inc. | 0.03 | -5.00 | 0.43 | -2.97 | 0.7565 | -0.0081 | |||
| SNV / Synovus Financial Corp. | 0.01 | -5.00 | 0.42 | 5.00 | 0.7474 | 0.0501 | |||
| PTEN / Patterson-UTI Energy, Inc. | 0.05 | -5.00 | 0.41 | -29.81 | 0.7199 | -0.2865 | |||
| IBTX / Independent Bank Group, Inc. | 0.01 | -4.99 | 0.40 | 20.36 | 0.7150 | 0.1323 | |||
| LFUS / Littelfuse, Inc. | 0.00 | -4.98 | 0.40 | -1.48 | 0.7101 | 0.0039 | |||
| CALX / Calix, Inc. | 0.01 | -5.00 | 0.39 | 4.01 | 0.6926 | 0.0395 | |||
| STC / Stewart Information Services Corporation | 0.01 | -4.99 | 0.38 | 14.59 | 0.6699 | 0.0955 | |||
| MSM / MSC Industrial Direct Co., Inc. | 0.00 | -4.99 | 0.37 | 3.06 | 0.6581 | 0.0321 | |||
| ITGR / Integer Holdings Corporation | 0.00 | -4.98 | 0.36 | 6.49 | 0.6427 | 0.0518 | |||
| AN / AutoNation, Inc. | 0.00 | -4.99 | 0.36 | 6.80 | 0.6414 | 0.0516 | |||
| PKE / Park Aerospace Corp. | 0.03 | -5.00 | 0.35 | -9.49 | 0.6273 | -0.0526 | |||
| AVA / Avista Corporation | 0.01 | -5.00 | 0.35 | 6.36 | 0.6251 | 0.0487 | |||
| ALE / ALLETE, Inc. | 0.01 | -4.99 | 0.35 | -2.23 | 0.6250 | -0.0017 | |||
| SHO / Sunstone Hotel Investors, Inc. | 0.03 | -5.00 | 0.35 | -6.22 | 0.6171 | -0.0286 | |||
| FANG / Diamondback Energy, Inc. | 0.00 | -5.00 | 0.35 | -18.16 | 0.6168 | -0.1226 | |||
| HUN / Huntsman Corporation | 0.01 | -5.00 | 0.33 | 0.93 | 0.5816 | 0.0167 | |||
| HZO / MarineMax, Inc. | 0.01 | -4.99 | 0.31 | 3.67 | 0.5532 | 0.0291 | |||
| BTE / Baytex Energy Corp. | 0.10 | -5.00 | 0.31 | -19.00 | 0.5464 | -0.1145 | |||
| TGNA / TEGNA Inc. | 0.02 | -5.00 | 0.30 | 7.64 | 0.5270 | 0.0464 | |||
| GTES / Gates Industrial Corporation plc | 0.02 | -5.00 | 0.30 | 5.34 | 0.5270 | 0.0369 | |||
| TALO / Talos Energy Inc. | 0.03 | -5.00 | 0.29 | -19.15 | 0.5109 | -0.1082 | |||
| FHB / First Hawaiian, Inc. | 0.01 | -5.00 | 0.29 | 5.95 | 0.5065 | 0.0376 | |||
| UBSI / United Bankshares, Inc. | 0.01 | -4.99 | 0.28 | 8.85 | 0.5028 | 0.0490 | |||
| CERT / Certara, Inc. | 0.02 | -5.00 | 0.27 | -19.53 | 0.4832 | -0.1068 | |||
| RRC / Range Resources Corporation | 0.01 | -5.00 | 0.26 | -12.75 | 0.4624 | -0.0579 | |||
| AZTA / Azenta, Inc. | 0.01 | -5.00 | 0.25 | -12.41 | 0.4515 | -0.0548 | |||
| UCB / United Community Banks, Inc. | 0.01 | -5.00 | 0.24 | 8.22 | 0.4223 | 0.0406 | |||
| BOKF / BOK Financial Corporation | 0.00 | -5.00 | 0.24 | 8.26 | 0.4202 | 0.0402 | |||
| PUMP / ProPetro Holding Corp. | 0.03 | -5.00 | 0.24 | -16.07 | 0.4177 | -0.0703 | |||
| PDM / Piedmont Realty Trust, Inc. | 0.02 | -5.00 | 0.22 | 32.93 | 0.3879 | 0.1004 | |||
| M / Macy's, Inc. | 0.01 | -5.00 | 0.20 | -22.22 | 0.3487 | -0.0918 | |||
| RMR / The RMR Group Inc. | 0.01 | -5.00 | 0.17 | 6.75 | 0.3092 | 0.0250 | |||
| AAP / Advance Auto Parts, Inc. | 0.00 | -5.00 | 0.17 | -41.64 | 0.3054 | -0.2067 | |||
| CCS / Century Communities, Inc. | 0.00 | -5.00 | 0.17 | 19.72 | 0.3024 | 0.0548 | |||
| NWL / Newell Brands Inc. | 0.02 | -4.99 | 0.17 | 13.70 | 0.2963 | 0.0410 | |||
| TKR / The Timken Company | 0.00 | -5.01 | 0.16 | 0.00 | 0.2812 | 0.0052 | |||
| GTN / Gray Media, Inc. | 0.02 | -5.00 | 0.13 | -1.49 | 0.2347 | -0.0003 | |||
| MEI / Methode Electronics, Inc. | 0.01 | -4.99 | 0.12 | 9.01 | 0.2167 | 0.0231 | |||
| LUNA / Luna Innovations Incorporated | 0.04 | -5.00 | 0.10 | -30.77 | 0.1776 | -0.0720 | |||
| SRI / Stoneridge, Inc. | 0.01 | -5.00 | 0.07 | -33.02 | 0.1262 | -0.0596 | |||
| Thermoenergy Corp. / EP (N/A) | 0.12 | 0.00 | 0.0001 | 0.0001 |