Statistik Asas
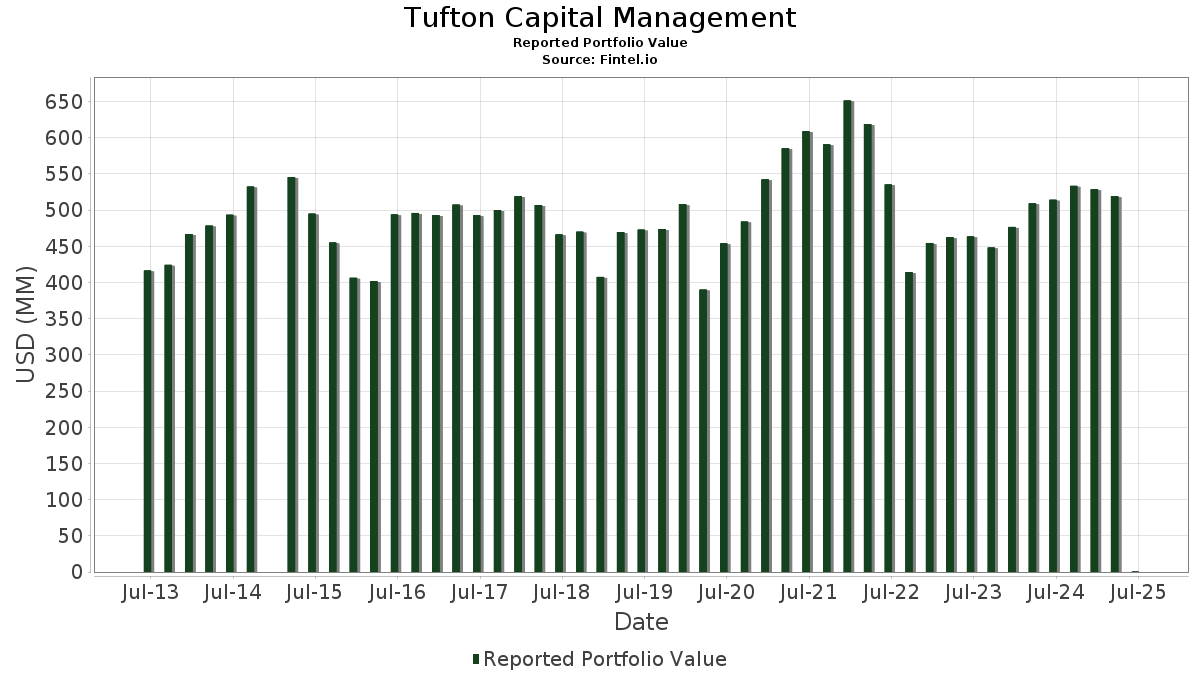
| Nilai Portfolio | $ 525,944 |
| Kedudukan Semasa | 117 |
Pegangan Terkini, Prestasi, AUM (dari 13F, 13D)
Tufton Capital Management telah mendedahkan 117 jumlah pegangan dalam pemfailan SEC terkini mereka. Nilai portfolio terkini dikira sebagai $ 525,944 USD. Aset Sebenar Di Bawah Pengurusan (AUM) ialah nilai ini ditambah dengan tunai (yang tidak didedahkan). Pegangan teratas Tufton Capital Management ialah Microsoft Corporation (US:MSFT) , JPMorgan Chase & Co. (US:JPM) , Apple Inc. (US:AAPL) , Automatic Data Processing, Inc. (GB:0HJI) , and Alphabet Inc. (US:GOOG) .
Kenaikan Teratas Suku Tahun Ini
Kami menggunakan perubahan dalam peruntukan portfolio kerana ini adalah metrik yang paling bermakna. Perubahan boleh disebabkan oleh perdagangan atau perubahan dalam harga saham.
| Sekuriti | Saham (MM) |
Nilai (MM$) |
Portfolio % | ΔPortfolio % |
|---|---|---|---|---|
| 0.07 | 0.04 | 7.0000 | 1.5067 | |
| 0.07 | 0.02 | 4.0932 | 0.4717 | |
| 0.07 | 0.01 | 2.8222 | 0.3914 | |
| 0.03 | 0.01 | 1.1760 | 0.2838 | |
| 0.07 | 0.01 | 1.8553 | 0.2737 | |
| 0.06 | 0.01 | 1.4587 | 0.2380 | |
| 0.02 | 0.01 | 1.8443 | 0.2198 | |
| 0.04 | 0.01 | 1.3197 | 0.1772 | |
| 0.21 | 0.01 | 2.0953 | 0.1737 | |
| 0.24 | 0.01 | 2.1211 | 0.1555 |
Penurunan Teratas Suku Tahun Ini
Kami menggunakan perubahan dalam peruntukan portfolio kerana ini adalah metrik yang paling bermakna. Perubahan boleh disebabkan oleh perdagangan atau perubahan dalam harga saham.
| Sekuriti | Saham (MM) |
Nilai (MM$) |
Portfolio % | ΔPortfolio % |
|---|---|---|---|---|
| 0.10 | 0.02 | 3.7437 | -0.6216 | |
| 0.07 | 0.01 | 1.8114 | -0.4111 | |
| 0.08 | 0.01 | 1.6893 | -0.3845 | |
| 0.06 | 0.01 | 1.9489 | -0.3671 | |
| 0.10 | 0.01 | 1.5296 | -0.2823 | |
| 0.07 | 0.00 | 0.6468 | -0.2705 | |
| 0.06 | 0.01 | 1.6026 | -0.2272 | |
| 0.06 | 0.01 | 1.8749 | -0.2198 | |
| 0.03 | 0.01 | 1.9002 | -0.1896 | |
| 0.06 | 0.01 | 1.0802 | -0.1608 |
13F dan Pemfailan Dana
Borang ini telah difailkan pada 2025-08-05 untuk tempoh pelaporan 2025-06-30. Klik ikon pautan untuk melihat sejarah transaksi penuh.
Tingkatkan untuk membuka data premium dan eksport ke Excel ![]() .
.
| Sekuriti | Jenis | Purata Harga Saham | Saham (MM) |
ΔSaham (%) |
ΔSaham (%) |
Nilai ($MM) |
Portfolio (%) |
ΔPortfolio (%) |
|
|---|---|---|---|---|---|---|---|---|---|
| MSFT / Microsoft Corporation | 0.07 | -2.57 | 0.04 | -99.87 | 7.0000 | 1.5067 | |||
| JPM / JPMorgan Chase & Co. | 0.07 | -3.11 | 0.02 | -99.89 | 4.0932 | 0.4717 | |||
| AAPL / Apple Inc. | 0.10 | -5.93 | 0.02 | -99.92 | 3.7437 | -0.6216 | |||
| 0HJI / Automatic Data Processing, Inc. | 0.05 | -2.87 | 0.02 | -99.91 | 3.0224 | -0.1007 | |||
| GOOG / Alphabet Inc. | 0.09 | -14.10 | 0.02 | -99.91 | 3.0032 | -0.1162 | |||
| TJX / The TJX Companies, Inc. | 0.13 | -4.03 | 0.02 | -99.91 | 2.9547 | -0.1216 | |||
| AMZN / Amazon.com, Inc. | 0.07 | 2.01 | 0.01 | -99.89 | 2.8222 | 0.3914 | |||
| BAC / Bank of America Corporation | 0.24 | -3.59 | 0.01 | -99.89 | 2.1211 | 0.1555 | |||
| GLW / Corning Incorporated | 0.21 | -3.83 | 0.01 | -99.89 | 2.0953 | 0.1737 | |||
| QCOM / QUALCOMM Incorporated | 0.07 | -2.73 | 0.01 | -99.91 | 2.0831 | -0.0097 | |||
| RTX / RTX Corporation | 0.07 | -4.67 | 0.01 | -99.90 | 1.9956 | 0.0717 | |||
| ABBV / AbbVie Inc. | 0.06 | -3.76 | 0.01 | -99.92 | 1.9489 | -0.3671 | |||
| CB / Chubb Limited | 0.03 | -3.98 | 0.01 | -99.92 | 1.9002 | -0.1896 | |||
| PG / The Procter & Gamble Company | 0.06 | -3.00 | 0.01 | -99.92 | 1.8749 | -0.2198 | |||
| EMR / Emerson Electric Co. | 0.07 | -2.27 | 0.01 | -99.89 | 1.8553 | 0.2737 | |||
| WFC / Wells Fargo & Company | 0.12 | -3.02 | 0.01 | -99.90 | 1.8508 | 0.1183 | |||
| CAT / Caterpillar Inc. | 0.02 | -2.28 | 0.01 | -99.89 | 1.8443 | 0.2198 | |||
| CVX / Chevron Corporation | 0.07 | -3.53 | 0.01 | -99.92 | 1.8114 | -0.4111 | |||
| ABT / Abbott Laboratories | 0.07 | -3.00 | 0.01 | -99.90 | 1.7380 | -0.0325 | |||
| XOM / Exxon Mobil Corporation | 0.08 | -8.95 | 0.01 | -99.93 | 1.6893 | -0.3845 | |||
| LMT / Lockheed Martin Corporation | 0.02 | -4.30 | 0.01 | -99.91 | 1.6730 | -0.0354 | |||
| NSC / Norfolk Southern Corporation | 0.03 | -2.49 | 0.01 | -99.90 | 1.6688 | 0.0643 | |||
| CPK / Chesapeake Utilities Corporation | 0.07 | 0.00 | 0.01 | -99.91 | 1.6285 | -0.1341 | |||
| JNJ / Johnson & Johnson | 0.06 | -3.66 | 0.01 | -99.92 | 1.6026 | -0.2272 | |||
| MRK / Merck & Co., Inc. | 0.10 | -3.02 | 0.01 | -99.91 | 1.5296 | -0.2823 | |||
| DIS / The Walt Disney Company | 0.06 | -3.64 | 0.01 | -99.89 | 1.4587 | 0.2380 | |||
| ZTS / Zoetis Inc. | 0.05 | -2.50 | 0.01 | -99.92 | 1.4517 | -0.1409 | |||
| IBM / International Business Machines Corporation | 0.03 | -9.33 | 0.01 | -99.90 | 1.4327 | 0.0823 | |||
| PM / Philip Morris International Inc. | 0.04 | -4.48 | 0.01 | -99.90 | 1.4264 | 0.1078 | |||
| MDLZ / Mondelez International, Inc. | 0.11 | -3.33 | 0.01 | -99.91 | 1.4032 | -0.0764 | |||
| NXPI / NXP Semiconductors N.V. | 0.03 | -1.93 | 0.01 | -99.89 | 1.3903 | 0.1409 | |||
| DLR / Digital Realty Trust, Inc. | 0.04 | -3.82 | 0.01 | -99.90 | 1.3197 | 0.1772 | |||
| TGT / Target Corporation | 0.07 | -3.08 | 0.01 | -99.92 | 1.3020 | -0.1379 | |||
| CARR / Carrier Global Corporation | 0.09 | -3.06 | 0.01 | -99.90 | 1.2965 | 0.1227 | |||
| CCI / Crown Castle Inc. | 0.06 | -3.68 | 0.01 | -99.91 | 1.2258 | -0.0824 | |||
| TSM / Taiwan Semiconductor Manufacturing Company Limited - Depositary Receipt (Common Stock) | 0.03 | -2.13 | 0.01 | -99.87 | 1.1760 | 0.2838 | |||
| MDT / Medtronic plc | 0.07 | -2.76 | 0.01 | -99.92 | 1.1193 | -0.0828 | |||
| NKE / NIKE, Inc. | 0.08 | -2.31 | 0.01 | -99.90 | 1.0860 | 0.0795 | |||
| DHR / Danaher Corporation | 0.03 | -0.94 | 0.01 | -99.92 | 1.0830 | -0.0666 | |||
| UPS / United Parcel Service, Inc. | 0.06 | -3.90 | 0.01 | -99.92 | 1.0802 | -0.1608 | |||
| DUK / Duke Energy Corporation | 0.04 | -4.23 | 0.01 | -99.91 | 0.9627 | -0.0901 | |||
| IVV / iShares Trust - iShares Core S&P 500 ETF | 0.01 | 1.67 | 0.00 | -99.90 | 0.8704 | 0.0854 | |||
| KO / The Coca-Cola Company | 0.06 | -3.76 | 0.00 | -99.91 | 0.8434 | -0.0554 | |||
| MMM / 3M Company | 0.03 | -8.83 | 0.00 | -99.91 | 0.8413 | -0.0607 | |||
| PEP / PepsiCo, Inc. | 0.03 | -3.07 | 0.00 | -99.92 | 0.8292 | -0.1549 | |||
| GOOGL / Alphabet Inc. | 0.02 | -2.42 | 0.00 | -99.89 | 0.7668 | 0.0681 | |||
| DIA / SPDR Dow Jones Industrial Average ETF Trust | 0.01 | -4.82 | 0.00 | -99.92 | 0.7548 | -0.0108 | |||
| VZ / Verizon Communications Inc. | 0.09 | -7.08 | 0.00 | -99.93 | 0.7259 | -0.1038 | |||
| COF / Capital One Financial Corporation | 0.02 | -1.86 | 0.00 | -99.91 | 0.7071 | 0.0919 | |||
| LLY / Eli Lilly and Company | 0.00 | -2.49 | 0.00 | -99.93 | 0.7033 | -0.0710 | |||
| BRK.B / Berkshire Hathaway Inc. | 0.01 | 0.00 | 0.00 | -99.92 | 0.6828 | -0.0758 | |||
| BMY / Bristol-Myers Squibb Company | 0.07 | -5.86 | 0.00 | -99.94 | 0.6468 | -0.2705 | |||
| DD / DuPont de Nemours, Inc. | 0.04 | -3.28 | 0.00 | -99.94 | 0.5402 | -0.0759 | |||
| SPY / SPDR S&P 500 ETF | 0.00 | 0.51 | 0.00 | -99.92 | 0.5286 | 0.0461 | |||
| EPD / Enterprise Products Partners L.P. - Limited Partnership | 0.09 | -4.32 | 0.00 | -99.94 | 0.5206 | -0.0863 | |||
| CSCO / Cisco Systems, Inc. | 0.04 | -7.04 | 0.00 | -99.92 | 0.5012 | 0.0153 | |||
| COST / Costco Wholesale Corporation | 0.00 | -0.19 | 0.00 | -99.92 | 0.5002 | 0.0151 | |||
| MKC / McCormick & Company, Incorporated | 0.03 | -0.22 | 0.00 | -99.93 | 0.4805 | -0.0492 | |||
| CL / Colgate-Palmolive Company | 0.02 | -4.77 | 0.00 | -99.92 | 0.4310 | -0.0418 | |||
| NVDA / NVIDIA Corporation | 0.01 | 0.16 | 0.00 | -99.93 | 0.3713 | 0.1136 | |||
| META / Meta Platforms, Inc. | 0.00 | 0.12 | 0.00 | -99.93 | 0.3476 | 0.0729 | |||
| CMG / Chipotle Mexican Grill, Inc. | 0.03 | -1.18 | 0.00 | -99.94 | 0.3407 | 0.0284 | |||
| PNC / The PNC Financial Services Group, Inc. | 0.01 | -2.17 | 0.00 | -99.94 | 0.3196 | 0.0075 | |||
| ELV / Elevance Health, Inc. | 0.00 | 0.00 | 0.00 | -99.94 | 0.3050 | -0.0405 | |||
| IEFA / iShares Trust - iShares Core MSCI EAFE ETF | 0.02 | 1.54 | 0.00 | -99.93 | 0.2901 | 0.0277 | |||
| SDY / SPDR Series Trust - SPDR S&P Dividend ETF | 0.01 | -2.06 | 0.00 | -99.94 | 0.2884 | -0.0100 | |||
| OTIS / Otis Worldwide Corporation | 0.02 | -1.13 | 0.00 | -99.94 | 0.2873 | -0.0196 | |||
| INTC / Intel Corporation | 0.07 | -4.34 | 0.00 | -99.94 | 0.2808 | -0.0209 | |||
| DE / Deere & Company | 0.00 | 0.00 | 0.00 | -99.92 | 0.2451 | 0.0158 | |||
| DOW / Dow Inc. | 0.05 | -3.10 | 0.00 | -99.94 | 0.2303 | -0.0873 | |||
| SYY / Sysco Corporation | 0.01 | -0.84 | 0.00 | -99.91 | 0.2139 | -0.0026 | |||
| BSX / Boston Scientific Corporation | 0.01 | 0.00 | 0.00 | -99.90 | 0.2109 | 0.0102 | |||
| IJH / iShares Trust - iShares Core S&P Mid-Cap ETF | 0.02 | 0.67 | 0.00 | -99.90 | 0.2093 | 0.0110 | |||
| OXY / Occidental Petroleum Corporation | 0.03 | -4.58 | 0.00 | -99.93 | 0.2072 | -0.0513 | |||
| PINS / Pinterest, Inc. | 0.03 | 2.75 | 0.00 | -99.89 | 0.2040 | 0.0300 | |||
| V / Visa Inc. | 0.00 | -1.19 | 0.00 | -99.90 | 0.1960 | -0.0025 | |||
| AXP / American Express Company | 0.00 | -29.57 | 0.00 | -99.92 | 0.1947 | -0.0417 | |||
| VWO / Vanguard International Equity Index Funds - Vanguard FTSE Emerging Markets ETF | 0.02 | -0.66 | 0.00 | -100.00 | 0.1852 | 0.0124 | |||
| NFLX / Netflix, Inc. | 0.00 | -7.57 | 0.00 | -100.00 | 0.1677 | 0.0396 | |||
| IJR / iShares Trust - iShares Core S&P Small-Cap ETF | 0.01 | 0.62 | 0.00 | -100.00 | 0.1629 | 0.0059 | |||
| TROW / T. Rowe Price Group, Inc. | 0.01 | -3.62 | 0.00 | -100.00 | 0.1515 | -0.0002 | |||
| VEA / Vanguard Tax-Managed Funds - Vanguard FTSE Developed Markets ETF | 0.01 | 12.61 | 0.00 | -100.00 | 0.1447 | 0.0286 | |||
| SLB / Schlumberger Limited | 0.02 | -1.70 | 0.00 | -100.00 | 0.1394 | -0.0384 | |||
| ARM / Arm Holdings plc - Depositary Receipt (Common Stock) | 0.00 | 2.26 | 0.00 | -100.00 | 0.1390 | 0.0480 | |||
| WMT / Walmart Inc. | 0.01 | 0.00 | 0.00 | -100.00 | 0.1359 | 0.0122 | |||
| IEMG / iShares, Inc. - iShares Core MSCI Emerging Markets ETF | 0.01 | 1.21 | 0.00 | -100.00 | 0.1302 | 0.0130 | |||
| NEE / NextEra Energy, Inc. | 0.01 | 0.00 | 0.00 | -100.00 | 0.1282 | -0.0044 | |||
| IGM / iShares Trust - iShares Expanded Tech Sector ETF | 0.01 | 0.00 | 0.00 | -100.00 | 0.1217 | 0.0221 | |||
| GE / General Electric Company | 0.00 | 0.00 | 0.00 | -100.00 | 0.1186 | 0.0251 | |||
| LOW / Lowe's Companies, Inc. | 0.00 | -6.66 | 0.00 | -100.00 | 0.1183 | -0.0167 | |||
| MO / Altria Group, Inc. | 0.01 | -9.64 | 0.00 | -100.00 | 0.1145 | -0.0169 | |||
| ISRG / Intuitive Surgical, Inc. | 0.00 | 0.00 | 0.00 | -100.00 | 0.1036 | 0.0079 | |||
| WRB / W. R. Berkley Corporation | 0.01 | 0.00 | 0.00 | -100.00 | 0.1036 | 0.0018 | |||
| HD / The Home Depot, Inc. | 0.00 | 0.00 | 0.00 | -100.00 | 0.0951 | -0.0012 | |||
| ETN / Eaton Corporation plc | 0.00 | 0.00 | 0.00 | -100.00 | 0.0899 | 0.0206 | |||
| UNP / Union Pacific Corporation | 0.00 | -28.62 | 0.00 | -100.00 | 0.0873 | -0.0399 | |||
| INTU / Intuit Inc. | 0.00 | 1.86 | 0.00 | -100.00 | 0.0821 | 0.0184 | |||
| APD / Air Products and Chemicals, Inc. | 0.00 | 0.00 | 0.00 | -100.00 | 0.0808 | -0.0050 | |||
| HON / Honeywell International Inc. | 0.00 | 0.00 | 0.00 | -100.00 | 0.0730 | 0.0056 | |||
| CSX / CSX Corporation | 0.01 | 0.00 | 0.00 | -100.00 | 0.0688 | 0.0059 | |||
| GEV / GE Vernova Inc. | 0.00 | 0.00 | 0.00 | -100.00 | 0.0688 | 0.0286 | |||
| XLK / The Select Sector SPDR Trust - The Technology Select Sector SPDR Fund | 0.00 | 0.00 | 0.00 | -100.00 | 0.0683 | 0.0118 | |||
| MCD / McDonald's Corporation | 0.00 | 1.76 | 0.00 | -100.00 | 0.0675 | -0.0044 | |||
| QQQ / Invesco QQQ Trust, Series 1 | 0.00 | 29.27 | 0.00 | -100.00 | 0.0667 | 0.0222 | |||
| SYK / Stryker Corporation | 0.00 | -10.43 | 0.00 | -100.00 | 0.0645 | -0.0043 | |||
| GS / The Goldman Sachs Group, Inc. | 0.00 | 0.00 | 0.00 | -100.00 | 0.0639 | 0.0139 | |||
| CAVA / CAVA Group, Inc. | 0.00 | 34.23 | 0.00 | -100.00 | 0.0595 | 0.0133 | |||
| BLK / BlackRock, Inc. | 0.00 | 0.00 | 0.00 | -100.00 | 0.0561 | 0.0047 | |||
| MA / Mastercard Incorporated | 0.00 | 0.00 | 0.00 | -100.00 | 0.0549 | 0.0006 | |||
| FDX / FedEx Corporation | 0.00 | 0.00 | 0.00 | -100.00 | 0.0513 | -0.0045 | |||
| FREL / Fidelity Covington Trust - Fidelity MSCI Real Estate Index ETF | 0.01 | 0.00 | 0.00 | -100.00 | 0.0453 | -0.0015 | |||
| PFE / Pfizer Inc. | 0.01 | 0.00 | 0.00 | -100.00 | 0.0428 | -0.0027 | |||
| SHEL / Shell plc - Depositary Receipt (Common Stock) | 0.00 | -12.23 | 0.00 | -100.00 | 0.0426 | -0.0088 | |||
| VEU / Vanguard International Equity Index Funds - Vanguard FTSE All-World ex-US ETF | 0.00 | 0.00 | 0.0416 | 0.0416 | |||||
| CRM / Salesforce, Inc. | 0.00 | -1.94 | 0.00 | -100.00 | 0.0394 | -0.0007 | |||
| BFB / Brown-Forman Corp. - Class B | 0.01 | 0.00 | 0.00 | -100.00 | 0.0386 | -0.0109 | |||
| ELUT / Elutia Inc. | 0.01 | 0.00 | 0.00 | -100.00 | 0.0051 | -0.0015 | |||
| CPT / Camden Property Trust | 0.00 | -100.00 | 0.00 | 0.0000 | |||||
| ESPH / Ecosphere Technologies, Inc. | 0.01 | 0.00 | 0.00 | 0.0000 | 0.0000 | ||||
| SCI / Service Corporation International | 0.00 | -100.00 | 0.00 | 0.0000 | |||||
| AMP / Ameriprise Financial, Inc. | 0.00 | -100.00 | 0.00 | 0.0000 |