Statistik Asas
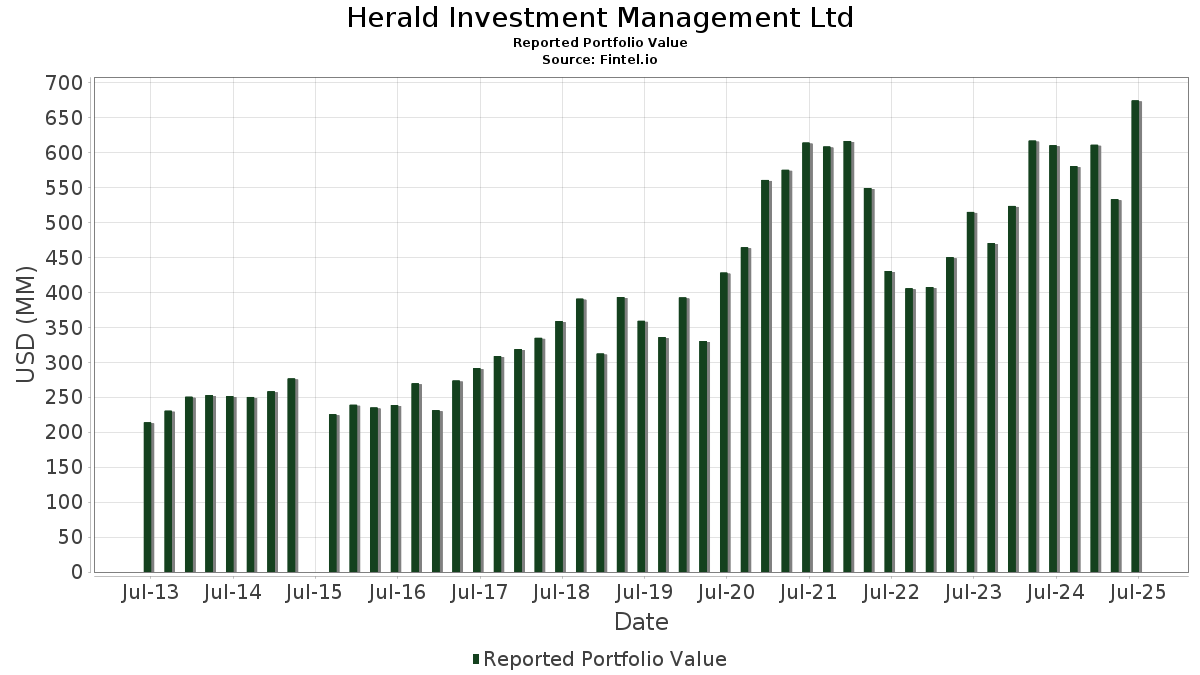
| Nilai Portfolio | $ 674,263,244 |
| Kedudukan Semasa | 94 |
Pegangan Terkini, Prestasi, AUM (dari 13F, 13D)
Herald Investment Management Ltd telah mendedahkan 94 jumlah pegangan dalam pemfailan SEC terkini mereka. Nilai portfolio terkini dikira sebagai $ 674,263,244 USD. Aset Sebenar Di Bawah Pengurusan (AUM) ialah nilai ini ditambah dengan tunai (yang tidak didedahkan). Pegangan teratas Herald Investment Management Ltd ialah Celestica Inc. (US:CLS) , Fabrinet (US:FN) , Pegasystems Inc. (US:PEGA) , Super Micro Computer, Inc. (US:SMCI) , and Silicon Motion Technology Corporation - Depositary Receipt (Common Stock) (US:SIMO) . Kedudukan baharu Herald Investment Management Ltd termasuk Inuvo, Inc. (US:INUV) , Freightos Limited (US:CRGO) , .
Kenaikan Teratas Suku Tahun Ini
Kami menggunakan perubahan dalam peruntukan portfolio kerana ini adalah metrik yang paling bermakna. Perubahan boleh disebabkan oleh perdagangan atau perubahan dalam harga saham.
| Sekuriti | Saham (MM) |
Nilai (MM$) |
Portfolio % | ΔPortfolio % |
|---|---|---|---|---|
| 0.39 | 61.00 | 9.0469 | 2.7906 | |
| 0.70 | 38.09 | 5.6485 | 1.0661 | |
| 1.28 | 21.65 | 3.2102 | 0.8456 | |
| 0.75 | 36.96 | 5.4820 | 0.6325 | |
| 0.38 | 28.86 | 4.2808 | 0.6313 | |
| 0.15 | 45.52 | 6.7507 | 0.4662 | |
| 0.58 | 2.66 | 0.3948 | 0.3948 | |
| 0.20 | 4.85 | 0.7187 | 0.3821 | |
| 0.26 | 5.11 | 0.7577 | 0.3787 | |
| 0.39 | 4.60 | 0.6817 | 0.3326 |
Penurunan Teratas Suku Tahun Ini
Kami menggunakan perubahan dalam peruntukan portfolio kerana ini adalah metrik yang paling bermakna. Perubahan boleh disebabkan oleh perdagangan atau perubahan dalam harga saham.
| Sekuriti | Saham (MM) |
Nilai (MM$) |
Portfolio % | ΔPortfolio % |
|---|---|---|---|---|
| 0.21 | 10.01 | 1.4843 | -0.8211 | |
| 0.18 | 18.79 | 2.7868 | -0.7082 | |
| 0.23 | 10.43 | 1.5463 | -0.4705 | |
| 0.02 | 4.18 | 0.6204 | -0.4210 | |
| 0.19 | 5.25 | 0.7789 | -0.3678 | |
| 0.17 | 3.99 | 0.5920 | -0.3112 | |
| 0.30 | 10.25 | 1.5194 | -0.3104 | |
| 0.79 | 7.43 | 1.1014 | -0.3095 | |
| 0.40 | 8.78 | 1.3022 | -0.2563 | |
| 0.05 | 6.46 | 0.9587 | -0.2239 |
13F dan Pemfailan Dana
Borang ini telah difailkan pada 2025-07-22 untuk tempoh pelaporan 2025-06-30. Klik ikon pautan untuk melihat sejarah transaksi penuh.
Tingkatkan untuk membuka data premium dan eksport ke Excel ![]() .
.
| Sekuriti | Jenis | Purata Harga Saham | Saham (MM) |
ΔSaham (%) |
ΔSaham (%) |
Nilai ($MM) |
Portfolio (%) |
ΔPortfolio (%) |
|
|---|---|---|---|---|---|---|---|---|---|
| CLS / Celestica Inc. | 0.39 | -7.68 | 61.00 | 82.92 | 9.0469 | 2.7906 | |||
| FN / Fabrinet | 0.15 | -8.79 | 45.52 | 35.88 | 6.7507 | 0.4662 | |||
| PEGA / Pegasystems Inc. | 0.70 | 100.00 | 38.09 | 55.93 | 5.6485 | 1.0661 | |||
| SMCI / Super Micro Computer, Inc. | 0.75 | 0.00 | 36.96 | 42.99 | 5.4820 | 0.6325 | |||
| SIMO / Silicon Motion Technology Corporation - Depositary Receipt (Common Stock) | 0.38 | 0.00 | 28.86 | 48.38 | 4.2808 | 0.6313 | |||
| VRNS / Varonis Systems, Inc. | 0.44 | 0.00 | 22.49 | 25.49 | 3.3355 | -0.0268 | |||
| ARLO / Arlo Technologies, Inc. | 1.28 | 0.00 | 21.65 | 71.74 | 3.2102 | 0.8456 | |||
| RDWR / Radware Ltd. | 0.68 | -6.90 | 19.81 | 26.68 | 2.9382 | 0.0044 | |||
| DSGX / The Descartes Systems Group Inc. | 0.18 | 0.00 | 18.79 | 0.86 | 2.7868 | -0.7082 | |||
| CYBR / CyberArk Software Ltd. | 0.04 | 0.00 | 17.20 | 20.22 | 2.5508 | -0.1332 | |||
| DRS / Leonardo DRS, Inc. | 0.30 | -6.25 | 13.94 | 32.50 | 2.0680 | 0.0935 | |||
| AVPT / AvePoint, Inc. | 0.70 | 0.00 | 13.52 | 33.45 | 2.0047 | 0.1044 | |||
| MSFT / Microsoft Corporation | 0.02 | -9.14 | 12.08 | 20.50 | 1.7916 | -0.0892 | |||
| FROG / JFrog Ltd. | 0.25 | 0.00 | 10.96 | 37.08 | 1.6258 | 0.1255 | |||
| VICR / Vicor Corporation | 0.23 | 0.00 | 10.43 | -3.02 | 1.5463 | -0.4705 | |||
| KLIC / Kulicke and Soffa Industries, Inc. | 0.30 | 0.00 | 10.25 | 5.04 | 1.5194 | -0.3104 | |||
| AMZN / Amazon.com, Inc. | 0.05 | 0.00 | 10.18 | 15.29 | 1.5095 | -0.1467 | |||
| CCOI / Cogent Communications Holdings, Inc. | 0.21 | 3.49 | 10.01 | -18.55 | 1.4843 | -0.8211 | |||
| RDVT / Red Violet, Inc. | 0.20 | 0.00 | 9.84 | 30.85 | 1.4594 | 0.0486 | |||
| QLYS / Qualys, Inc. | 0.07 | 0.00 | 9.28 | 13.39 | 1.3764 | -0.1591 | |||
| GOOGL / Alphabet Inc. | 0.05 | 0.00 | 8.84 | 14.01 | 1.3118 | -0.1437 | |||
| CEVA / CEVA, Inc. | 0.40 | 23.08 | 8.78 | 5.69 | 1.3022 | -0.2563 | |||
| TSEM / Tower Semiconductor Ltd. | 0.20 | 0.00 | 8.57 | 21.58 | 1.2709 | -0.0515 | |||
| HLIT / Harmonic Inc. | 0.79 | 0.00 | 7.43 | -1.25 | 1.1014 | -0.3095 | |||
| FIVN / Five9, Inc. | 0.26 | 24.41 | 6.93 | 21.25 | 1.0274 | -0.0445 | |||
| SPSC / SPS Commerce, Inc. | 0.05 | 0.00 | 6.46 | 2.55 | 0.9587 | -0.2239 | |||
| FA / First Advantage Corporation | 0.35 | 15.96 | 5.78 | 36.60 | 0.8570 | 0.0634 | |||
| ALKT / Alkami Technology, Inc. | 0.18 | 20.00 | 5.43 | 37.80 | 0.8046 | 0.0659 | |||
| IDN / Intellicheck, Inc. | 1.00 | 0.00 | 5.35 | 78.93 | 0.7935 | 0.2325 | |||
| HSTM / HealthStream, Inc. | 0.19 | 0.00 | 5.25 | -14.09 | 0.7789 | -0.3678 | |||
| LASR / nLIGHT, Inc. | 0.26 | 0.00 | 5.11 | 152.92 | 0.7577 | 0.3787 | |||
| AVDX / AvidXchange Holdings, Inc. | 0.50 | 0.00 | 4.89 | 15.45 | 0.7260 | -0.0695 | |||
| BASE / Couchbase, Inc. | 0.20 | 0.00 | 4.88 | 54.79 | 0.7232 | 0.1322 | |||
| OUST / Ouster, Inc. | 0.20 | 0.00 | 4.85 | 170.12 | 0.7187 | 0.3821 | |||
| CLMB / Climb Global Solutions, Inc. | 0.04 | 12.50 | 4.82 | 9.23 | 0.7141 | -0.1130 | |||
| SMWB / Similarweb Ltd. | 0.60 | 100.00 | 4.71 | 90.07 | 0.6985 | 0.2337 | |||
| SPIR / Spire Global, Inc. | 0.39 | 67.93 | 4.60 | 147.10 | 0.6817 | 0.3326 | |||
| QUIK / QuickLogic Corporation | 0.73 | 0.00 | 4.47 | 19.75 | 0.6629 | -0.0373 | |||
| MU / Micron Technology, Inc. | 0.04 | 0.00 | 4.43 | 41.80 | 0.6577 | 0.0709 | |||
| AMD / Advanced Micro Devices, Inc. | 0.03 | 0.00 | 4.39 | 38.13 | 0.6507 | 0.0548 | |||
| ELVA / Electrovaya Inc. | 1.26 | 7.20 | 4.31 | 58.28 | 0.6398 | 0.1284 | |||
| PDFS / PDF Solutions, Inc. | 0.20 | 0.00 | 4.27 | 11.67 | 0.6330 | -0.0840 | |||
| MRAM / Everspin Technologies, Inc. | 0.68 | 12.50 | 4.24 | 38.53 | 0.6287 | 0.0546 | |||
| VPG / Vishay Precision Group, Inc. | 0.15 | 0.00 | 4.21 | 16.68 | 0.6247 | -0.0527 | |||
| AAPL / Apple Inc. | 0.02 | -18.40 | 4.18 | -24.64 | 0.6204 | -0.4210 | |||
| FORM / FormFactor, Inc. | 0.12 | 0.00 | 4.06 | 21.46 | 0.6028 | -0.0250 | |||
| VECO / Veeco Instruments Inc. | 0.20 | 0.00 | 4.06 | 1.35 | 0.6027 | -0.1496 | |||
| FC / Franklin Covey Co. | 0.17 | 0.00 | 3.99 | -17.10 | 0.5920 | -0.3112 | |||
| VERX / Vertex, Inc. | 0.11 | 0.00 | 3.89 | 1.04 | 0.5764 | -0.1453 | |||
| AVNW / Aviat Networks, Inc. | 0.15 | 0.00 | 3.72 | 25.35 | 0.5524 | -0.0050 | |||
| RDCM / RADCOM Ltd. | 0.28 | 0.00 | 3.70 | 17.85 | 0.5494 | -0.0403 | |||
| RBBN / Ribbon Communications Inc. | 0.91 | 0.00 | 3.66 | 2.29 | 0.5429 | -0.1284 | |||
| APPS / Digital Turbine, Inc. | 0.60 | 0.00 | 3.53 | 117.34 | 0.5241 | 0.2191 | |||
| FARO / FARO Technologies, Inc. | 0.08 | 0.00 | 3.51 | 61.44 | 0.5211 | 0.1127 | |||
| OOMA / Ooma, Inc. | 0.26 | 0.00 | 3.35 | -1.44 | 0.4974 | -0.1411 | |||
| NABL / N-able, Inc. | 0.41 | 0.00 | 3.34 | 14.11 | 0.4955 | -0.0538 | |||
| BAND / Bandwidth Inc. | 0.21 | 0.00 | 3.34 | 21.51 | 0.4952 | -0.0205 | |||
| OSPN / OneSpan Inc. | 0.20 | 0.00 | 3.33 | 9.25 | 0.4942 | -0.0780 | |||
| RMNI / Rimini Street, Inc. | 0.85 | 0.00 | 3.20 | 8.32 | 0.4753 | -0.0797 | |||
| BIGC / Commerce.com, Inc. | 0.62 | 0.00 | 3.12 | -13.19 | 0.4635 | -0.2119 | |||
| BELFB / Bel Fuse Inc. | 0.03 | 0.00 | 2.93 | 30.86 | 0.4347 | 0.0146 | |||
| AIP / Arteris, Inc. | 0.30 | 0.00 | 2.86 | 38.12 | 0.4240 | 0.0357 | |||
| KD / Kyndryl Holdings, Inc. | 0.07 | 0.00 | 2.81 | 33.79 | 0.4169 | 0.0226 | |||
| DGII / Digi International Inc. | 0.08 | 0.00 | 2.79 | 25.25 | 0.4135 | -0.0042 | |||
| DT / Dynatrace, Inc. | 0.05 | 0.00 | 2.76 | 17.01 | 0.4091 | -0.0331 | |||
| CINT / CI&T Inc. | 0.45 | 26.76 | 2.68 | 26.99 | 0.3978 | 0.0015 | |||
| INUV / Inuvo, Inc. | 0.58 | 2.66 | 0.3948 | 0.3948 | |||||
| LTRX / Lantronix, Inc. | 0.90 | 0.00 | 2.57 | 15.32 | 0.3818 | -0.0370 | |||
| VLN / Valens Semiconductor Ltd. | 0.95 | 0.00 | 2.49 | 28.43 | 0.3691 | 0.0056 | |||
| KOPN / Kopin Corporation | 1.53 | 0.00 | 2.33 | 63.15 | 0.3460 | 0.0776 | |||
| ANET / Arista Networks Inc | 0.02 | 0.00 | 2.32 | 32.08 | 0.3445 | 0.0147 | |||
| TGEN / Tecogen Inc. | 0.32 | 2.19 | 0.3252 | 0.3252 | |||||
| POWI / Power Integrations, Inc. | 0.04 | 0.00 | 2.12 | 10.75 | 0.3149 | -0.0449 | |||
| PATH / UiPath Inc. | 0.16 | 0.00 | 2.06 | 24.29 | 0.3059 | -0.0054 | |||
| HIMX / Himax Technologies, Inc. - Depositary Receipt (Common Stock) | 0.23 | 0.00 | 2.05 | 21.48 | 0.3046 | -0.0125 | |||
| CKP / Checkpoint Systems, Inc. | 0.01 | 0.00 | 2.04 | -2.91 | 0.3018 | -0.0916 | |||
| ZM / Zoom Communications Inc. | 0.03 | 0.00 | 2.02 | 5.65 | 0.2995 | -0.0590 | |||
| ARW / Arrow Electronics, Inc. | 0.02 | 0.00 | 1.94 | 22.83 | 0.2874 | -0.0086 | |||
| SILC / Silicom Ltd. | 0.12 | 0.00 | 1.91 | 4.27 | 0.2827 | -0.0604 | |||
| TER / Teradyne, Inc. | 0.02 | 0.00 | 1.85 | 8.75 | 0.2747 | -0.0447 | |||
| ADTN / ADTRAN Holdings, Inc. | 0.20 | 0.00 | 1.79 | 2.87 | 0.2658 | -0.0610 | |||
| FORR / Forrester Research, Inc. | 0.15 | 0.00 | 1.48 | 7.00 | 0.2200 | -0.0400 | |||
| MPTI / M-tron Industries, Inc. | 0.04 | 0.00 | 1.46 | -4.71 | 0.2164 | -0.0707 | |||
| FRSH / Freshworks Inc. | 0.09 | 0.00 | 1.34 | 5.76 | 0.1989 | -0.0390 | |||
| GNSS / Genasys Inc. | 0.75 | 0.00 | 1.30 | -23.80 | 0.1924 | -0.1270 | |||
| CRGO / Freightos Limited | 0.50 | 1.20 | 0.0000 | ||||||
| MLAB / Mesa Laboratories, Inc. | 0.01 | 0.00 | 1.18 | -20.63 | 0.1746 | -0.1036 | |||
| ACCS / ACCESS Newswire Inc. | 0.09 | 0.00 | 1.06 | 33.75 | 0.1575 | 0.0084 | |||
| TXN / Texas Instruments Incorporated | 0.00 | 0.00 | 0.85 | 15.33 | 0.1262 | -0.0121 | |||
| AWRE / Aware, Inc. | 0.43 | 0.00 | 0.81 | 19.00 | 0.1199 | -0.0076 | |||
| CDNS / Cadence Design Systems, Inc. | 0.00 | 0.00 | 0.77 | 21.10 | 0.1142 | -0.0051 | |||
| TTEC / TTEC Holdings, Inc. | 0.14 | 0.00 | 0.67 | 46.30 | 0.0999 | 0.0135 | |||
| BELFA / Bel Fuse Inc. | 0.01 | 0.00 | 0.67 | 23.89 | 0.0993 | -0.0020 | |||
| INTC / Intel Corporation | 0.02 | 0.00 | 0.43 | -1.39 | 0.0631 | -0.0179 | |||
| INUV / Inuvo, Inc. | 0.00 | -100.00 | 0.00 | 0.0000 | |||||
| AKAM / Akamai Technologies, Inc. | 0.00 | -100.00 | 0.00 | 0.0000 | |||||
| LGTY / Logility Supply Chain Solutions, Inc. | 0.00 | -100.00 | 0.00 | 0.0000 |