Statistik Asas
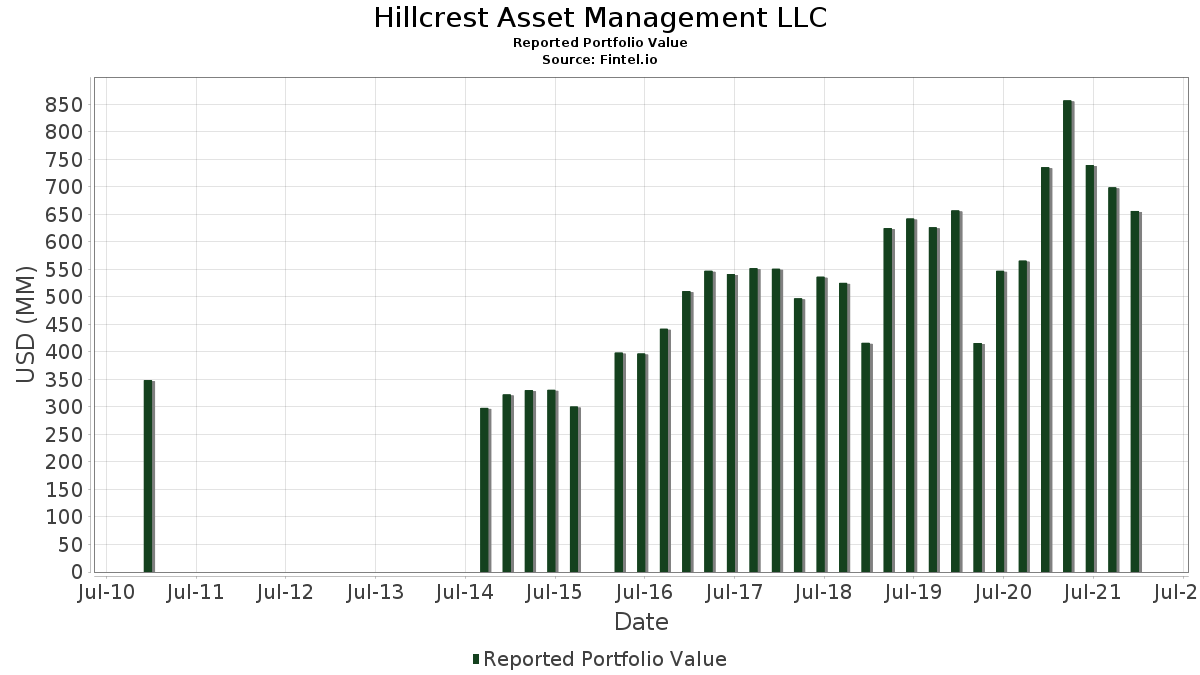
| Nilai Portfolio | $ 656,227,000 |
| Kedudukan Semasa | 60 |
Pegangan Terkini, Prestasi, AUM (dari 13F, 13D)
Hillcrest Asset Management LLC telah mendedahkan 60 jumlah pegangan dalam pemfailan SEC terkini mereka. Nilai portfolio terkini dikira sebagai $ 656,227,000 USD. Aset Sebenar Di Bawah Pengurusan (AUM) ialah nilai ini ditambah dengan tunai (yang tidak didedahkan). Pegangan teratas Hillcrest Asset Management LLC ialah UFP Industries, Inc. (US:UFPI) , ExlService Holdings, Inc. (US:EXLS) , LXP Industrial Trust - Preferred Stock (US:LXP.PRC) , Spectrum Brands Holdings, Inc. (US:SPB) , and Fabrinet (US:FN) . Kedudukan baharu Hillcrest Asset Management LLC termasuk Air Transport Services Group, Inc. (US:ATSG) , Stewart Information Services Corporation (US:STC) , Argo Group International Holdings, Inc. (US:ARGO) , Civitas Resources, Inc. (US:CIVI) , and AdaptHealth Corp. (US:AHCO) .
Kenaikan Teratas Suku Tahun Ini
Kami menggunakan perubahan dalam peruntukan portfolio kerana ini adalah metrik yang paling bermakna. Perubahan boleh disebabkan oleh perdagangan atau perubahan dalam harga saham.
| Sekuriti | Saham (MM) |
Nilai (MM$) |
Portfolio % | ΔPortfolio % |
|---|---|---|---|---|
| 0.33 | 12.85 | 1.9579 | 1.9579 | |
| 0.43 | 12.68 | 1.9320 | 1.9320 | |
| 0.15 | 12.18 | 1.8556 | 1.8556 | |
| 0.21 | 9.98 | 1.5205 | 1.5205 | |
| 0.19 | 9.13 | 1.3907 | 1.3907 | |
| 0.37 | 8.94 | 1.3622 | 1.3622 | |
| 0.12 | 8.01 | 1.2199 | 1.2199 | |
| 0.18 | 16.40 | 2.4985 | 0.5116 | |
| 0.40 | 12.11 | 1.8449 | 0.5025 | |
| 0.24 | 10.61 | 1.6168 | 0.4170 |
Penurunan Teratas Suku Tahun Ini
Kami menggunakan perubahan dalam peruntukan portfolio kerana ini adalah metrik yang paling bermakna. Perubahan boleh disebabkan oleh perdagangan atau perubahan dalam harga saham.
| Sekuriti | Saham (MM) |
Nilai (MM$) |
Portfolio % | ΔPortfolio % |
|---|---|---|---|---|
| 0.00 | 0.00 | -2.1045 | ||
| 0.00 | 0.00 | -1.9680 | ||
| 0.00 | 0.00 | -1.7215 | ||
| 0.00 | 0.00 | -1.4643 | ||
| 0.00 | 0.00 | -1.3107 | ||
| 0.17 | 12.22 | 1.8625 | -0.6636 | |
| 0.46 | 13.41 | 2.0429 | -0.6616 | |
| 0.12 | 14.54 | 2.2151 | -0.6592 | |
| 0.12 | 13.63 | 2.0778 | -0.4920 | |
| 0.24 | 6.46 | 0.9844 | -0.3603 |
13F dan Pemfailan Dana
Borang ini telah difailkan pada 2022-02-24 untuk tempoh pelaporan 2021-12-31. Klik ikon pautan untuk melihat sejarah transaksi penuh.
Tingkatkan untuk membuka data premium dan eksport ke Excel ![]() .
.
| Sekuriti | Jenis | Purata Harga Saham | Saham (MM) |
ΔSaham (%) |
ΔSaham (%) |
Nilai ($MM) |
Portfolio (%) |
ΔPortfolio (%) |
|
|---|---|---|---|---|---|---|---|---|---|
| UFPI / UFP Industries, Inc. | 0.18 | -12.76 | 16.40 | 18.08 | 2.4985 | 0.5116 | |||
| EXLS / ExlService Holdings, Inc. | 0.11 | -12.71 | 16.11 | 2.64 | 2.4542 | 0.2090 | |||
| LXP.PRC / LXP Industrial Trust - Preferred Stock | 1.03 | -12.70 | 16.09 | 6.95 | 2.4513 | 0.2991 | |||
| SPB / Spectrum Brands Holdings, Inc. | 0.15 | -12.73 | 15.29 | -7.21 | 2.3292 | -0.0277 | |||
| FN / Fabrinet | 0.13 | -12.73 | 15.19 | 0.86 | 2.3154 | 0.1599 | |||
| EME / EMCOR Group, Inc. | 0.11 | -12.70 | 14.64 | -3.62 | 2.2303 | 0.0576 | |||
| AMN / AMN Healthcare Services, Inc. | 0.12 | -32.12 | 14.54 | -27.64 | 2.2151 | -0.6592 | |||
| UMBF / UMB Financial Corporation | 0.14 | -12.70 | 14.40 | -4.21 | 2.1938 | 0.0433 | |||
| HTH / Hilltop Holdings Inc. | 0.40 | -12.81 | 14.16 | -6.21 | 2.1572 | -0.0026 | |||
| SLGRF / Nikon SLM Solutions AG - Bearer Shares | 0.90 | -12.74 | 13.65 | -12.51 | 2.0804 | -0.1523 | |||
| DIOD / Diodes Incorporated | 0.12 | -37.37 | 13.63 | -24.08 | 2.0778 | -0.4920 | |||
| EVR / Evercore Inc. | 0.10 | -12.67 | 13.52 | -11.24 | 2.0606 | -0.1193 | |||
| SEM / Select Medical Holdings Corporation | 0.46 | -12.74 | 13.41 | -29.07 | 2.0429 | -0.6616 | |||
| AIR / AAR Corp. | 0.33 | 12.85 | 1.9579 | 1.9579 | |||||
| ATSG / Air Transport Services Group, Inc. | 0.43 | 12.68 | 1.9320 | 1.9320 | |||||
| CTRE / CareTrust REIT, Inc. | 0.55 | -12.69 | 12.62 | -1.91 | 1.9234 | 0.0822 | |||
| TPX / Somnigroup International Inc. | 0.26 | -12.71 | 12.25 | -11.54 | 1.8673 | -0.1148 | |||
| PDM / Piedmont Realty Trust, Inc. | 0.67 | -12.73 | 12.23 | -7.97 | 1.8641 | -0.0379 | |||
| SF / Stifel Financial Corp. | 0.17 | -33.19 | 12.22 | -30.77 | 1.8625 | -0.6636 | |||
| GFF / Griffon Corporation | 0.43 | -12.73 | 12.18 | 1.03 | 1.8564 | 0.1310 | |||
| STC / Stewart Information Services Corporation | 0.15 | 12.18 | 1.8556 | 1.8556 | |||||
| GRBK / Green Brick Partners, Inc. | 0.40 | -12.70 | 12.11 | 29.04 | 1.8449 | 0.5025 | |||
| MBUU / Malibu Boats, Inc. | 0.18 | -12.89 | 12.10 | -14.44 | 1.8433 | -0.1797 | |||
| OFC / Corporate Office Properties Trust | 0.41 | -12.72 | 11.54 | -9.52 | 1.7591 | -0.0663 | |||
| CC / The Chemours Company | 0.34 | -12.76 | 11.41 | 0.75 | 1.7386 | 0.1183 | |||
| SHYF / The Shyft Group, Inc. | 0.23 | -12.70 | 11.08 | 12.83 | 1.6884 | 0.2833 | |||
| CATY / Cathay General Bancorp | 0.25 | -12.76 | 10.95 | -9.40 | 1.6691 | -0.0607 | |||
| GPK / Graphic Packaging Holding Company | 0.56 | -12.74 | 10.87 | -10.63 | 1.6570 | -0.0839 | |||
| VRTS / Virtus Investment Partners, Inc. | 0.04 | -12.63 | 10.66 | -16.35 | 1.6250 | -0.1992 | |||
| POR / Portland General Electric Company | 0.20 | -12.74 | 10.65 | -1.73 | 1.6232 | 0.0723 | |||
| PRG / PROG Holdings, Inc. | 0.24 | 17.85 | 10.61 | 26.54 | 1.6168 | 0.4170 | |||
| GTN / Gray Media, Inc. | 0.52 | -12.73 | 10.58 | -22.90 | 1.6127 | -0.3513 | |||
| ABCB / Ameris Bancorp | 0.21 | -12.75 | 10.53 | -16.45 | 1.6040 | -0.1986 | |||
| ARGO / Argo Group International Holdings, Inc. | 0.18 | 10.45 | 0.0000 | ||||||
| OEC / Orion S.A. | 0.56 | -12.69 | 10.27 | -12.07 | 1.5653 | -0.1062 | |||
| PDCE / PDC Energy Inc | 0.21 | -12.80 | 10.19 | -10.24 | 1.5524 | -0.0715 | |||
| TKR / The Timken Company | 0.14 | -12.75 | 10.04 | -7.58 | 1.5301 | -0.0245 | |||
| EPR / EPR Properties | 0.21 | 9.98 | 1.5205 | 1.5205 | |||||
| BDN / Brandywine Realty Trust | 0.73 | -12.77 | 9.79 | -12.77 | 1.4911 | -0.1139 | |||
| HI / Hillenbrand, Inc. | 0.19 | -12.75 | 9.67 | 6.36 | 1.4736 | 0.1726 | |||
| ITGR / Integer Holdings Corporation | 0.11 | -12.68 | 9.62 | -16.34 | 1.4655 | -0.1793 | |||
| WGO / Winnebago Industries, Inc. | 0.13 | -12.72 | 9.61 | -9.74 | 1.4650 | -0.0591 | |||
| WERN / Werner Enterprises, Inc. | 0.20 | -12.71 | 9.51 | -6.03 | 1.4493 | 0.0012 | |||
| JACK / Jack in the Box Inc. | 0.11 | -12.78 | 9.49 | -21.61 | 1.4455 | -0.2859 | |||
| SWX / Southwest Gas Holdings, Inc. | 0.13 | -12.80 | 9.21 | -8.67 | 1.4041 | -0.0395 | |||
| NBHC / National Bank Holdings Corporation | 0.21 | -12.67 | 9.15 | -5.20 | 1.3948 | 0.0133 | |||
| CIVI / Civitas Resources, Inc. | 0.19 | 9.13 | 1.3907 | 1.3907 | |||||
| AHCO / AdaptHealth Corp. | 0.37 | 8.94 | 1.3622 | 1.3622 | |||||
| US9021041085 / II-VI, Inc. | 0.13 | -12.68 | 8.75 | 0.53 | 1.3334 | 0.0880 | |||
| PRIM / Primoris Services Corporation | 0.36 | -12.69 | 8.66 | -14.51 | 1.3204 | -0.1299 | |||
| WLL / Whiting Petroleum Corp (New) | 0.12 | 8.01 | 1.2199 | 1.2199 | |||||
| EBS / Emergent BioSolutions Inc. | 0.18 | -12.53 | 8.00 | -24.06 | 1.2189 | -0.2883 | |||
| MGRC / McGrath RentCorp | 0.10 | -12.68 | 7.81 | -2.59 | 1.1900 | 0.0429 | |||
| LZB / La-Z-Boy Incorporated | 0.20 | -12.79 | 7.25 | -1.76 | 1.1042 | 0.0488 | |||
| SMP / Standard Motor Products, Inc. | 0.13 | -12.83 | 7.01 | 4.48 | 1.0688 | 0.1083 | |||
| NMIH / NMI Holdings, Inc. | 0.32 | -12.75 | 7.00 | -15.69 | 1.0672 | -0.1213 | |||
| VBTX / Veritex Holdings, Inc. | 0.18 | -12.74 | 6.96 | -11.81 | 1.0612 | -0.0687 | |||
| INT / World Fuel Services Corp. | 0.24 | -12.70 | 6.46 | -31.26 | 0.9844 | -0.3603 | |||
| NWE / NorthWestern Energy Group, Inc. | 0.11 | -12.67 | 6.01 | -12.88 | 0.9165 | -0.0713 | |||
| GIII / G-III Apparel Group, Ltd. | 0.21 | -12.77 | 5.94 | -14.81 | 0.9049 | -0.0924 | |||
| BLDR / Builders FirstSource, Inc. | 0.00 | -100.00 | 0.00 | -100.00 | -1.9680 | ||||
| SBCF / Seacoast Banking Corporation of Florida | 0.00 | -100.00 | 0.00 | -100.00 | -1.3107 | ||||
| MCY / Mercury General Corporation | 0.00 | -100.00 | 0.00 | -100.00 | -1.7215 | ||||
| BCEI / Bonanza Creek Energy Inc New | 0.00 | -100.00 | 0.00 | -100.00 | -1.4643 | ||||
| FSS / Federal Signal Corporation | 0.00 | -100.00 | 0.00 | -100.00 | -2.1045 |