Statistik Asas
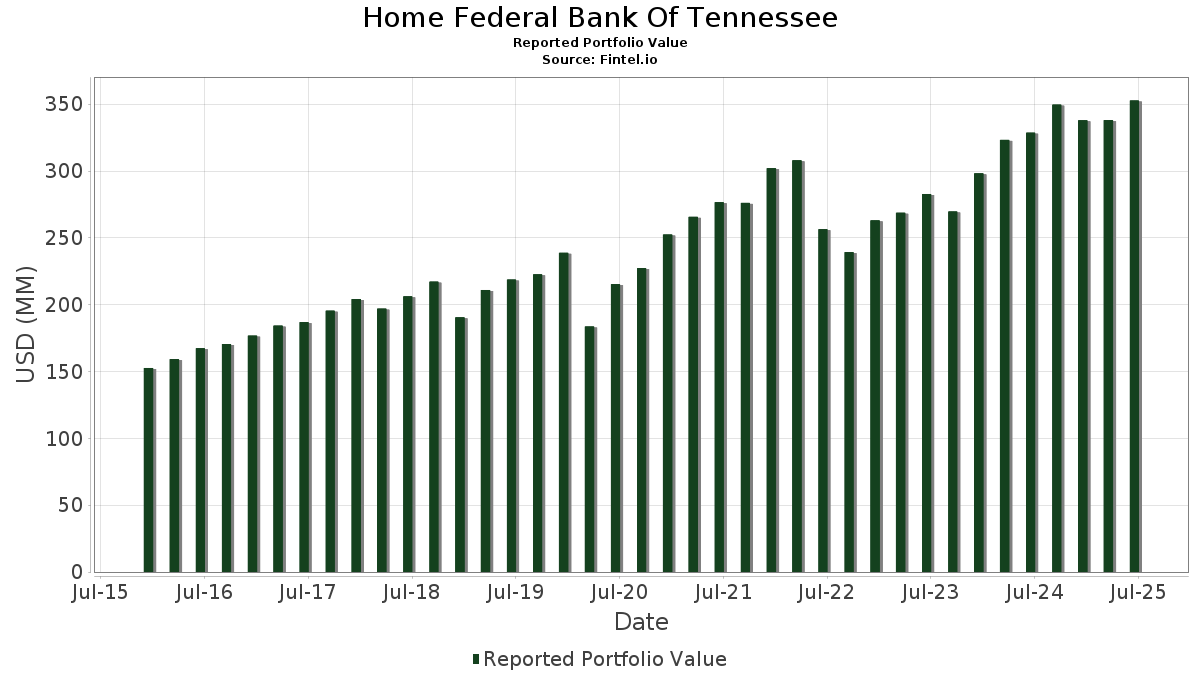
| Nilai Portfolio | $ 352,692,031 |
| Kedudukan Semasa | 78 |
Pegangan Terkini, Prestasi, AUM (dari 13F, 13D)
Home Federal Bank Of Tennessee telah mendedahkan 78 jumlah pegangan dalam pemfailan SEC terkini mereka. Nilai portfolio terkini dikira sebagai $ 352,692,031 USD. Aset Sebenar Di Bawah Pengurusan (AUM) ialah nilai ini ditambah dengan tunai (yang tidak didedahkan). Pegangan teratas Home Federal Bank Of Tennessee ialah iShares Trust - iShares Core S&P 500 ETF (US:IVV) , iShares Trust - iShares S&P 500 Value ETF (US:IVE) , Eli Lilly and Company (US:LLY) , iShares Trust - iShares S&P Small-Cap 600 Value ETF (US:IJS) , and Microsoft Corporation (US:MSFT) .
Kenaikan Teratas Suku Tahun Ini
Kami menggunakan perubahan dalam peruntukan portfolio kerana ini adalah metrik yang paling bermakna. Perubahan boleh disebabkan oleh perdagangan atau perubahan dalam harga saham.
| Sekuriti | Saham (MM) |
Nilai (MM$) |
Portfolio % | ΔPortfolio % |
|---|
Penurunan Teratas Suku Tahun Ini
Kami menggunakan perubahan dalam peruntukan portfolio kerana ini adalah metrik yang paling bermakna. Perubahan boleh disebabkan oleh perdagangan atau perubahan dalam harga saham.
| Sekuriti | Saham (MM) |
Nilai (MM$) |
Portfolio % | ΔPortfolio % |
|---|---|---|---|---|
| 0.22 | 139.64 | 20.7737 | -16.6422 | |
| 0.39 | 76.50 | 11.3811 | -10.6653 | |
| 0.01 | 9.18 | 1.3656 | -1.5116 | |
| 0.08 | 8.39 | 1.2488 | -1.1741 | |
| 0.03 | 5.92 | 0.8801 | -0.9833 | |
| 0.02 | 2.55 | 0.3790 | -0.7713 | |
| 0.04 | 5.40 | 0.8032 | -0.6457 | |
| 0.02 | 3.24 | 0.4818 | -0.5948 | |
| 0.01 | 7.37 | 1.0961 | -0.5503 | |
| 0.02 | 5.13 | 0.7637 | -0.5213 |
13F dan Pemfailan Dana
Borang ini telah difailkan pada 2025-07-15 untuk tempoh pelaporan 2025-06-30. Klik ikon pautan untuk melihat sejarah transaksi penuh.
Tingkatkan untuk membuka data premium dan eksport ke Excel ![]() .
.
| Sekuriti | Jenis | Purata Harga Saham | Saham (MM) |
ΔSaham (%) |
ΔSaham (%) |
Nilai ($MM) |
Portfolio (%) |
ΔPortfolio (%) |
|
|---|---|---|---|---|---|---|---|---|---|
| IVV / iShares Trust - iShares Core S&P 500 ETF | 0.22 | -0.08 | 139.64 | 10.41 | 20.7737 | -16.6422 | |||
| IVE / iShares Trust - iShares S&P 500 Value ETF | 0.39 | 0.11 | 76.50 | 2.66 | 11.3811 | -10.6653 | |||
| LLY / Eli Lilly and Company | 0.01 | 0.00 | 9.18 | -5.61 | 1.3656 | -1.5116 | |||
| IJS / iShares Trust - iShares S&P Small-Cap 600 Value ETF | 0.08 | 0.43 | 8.39 | 2.49 | 1.2488 | -1.1741 | |||
| MSFT / Microsoft Corporation | 0.01 | -0.09 | 7.37 | 32.40 | 1.0961 | -0.5503 | |||
| AAPL / Apple Inc. | 0.03 | 1.69 | 5.92 | -6.07 | 0.8801 | -0.9833 | |||
| RTX / RTX Corporation | 0.04 | 0.00 | 5.40 | 10.23 | 0.8032 | -0.6457 | |||
| JPM / JPMorgan Chase & Co. | 0.02 | 0.00 | 5.13 | 18.19 | 0.7637 | -0.5213 | |||
| ADI / Analog Devices, Inc. | 0.02 | 0.00 | 4.50 | 18.02 | 0.6696 | -0.4586 | |||
| HD / The Home Depot, Inc. | 0.01 | 0.44 | 4.22 | 0.48 | 1.1963 | -0.0460 | |||
| SPY / SPDR S&P 500 ETF | 0.01 | 0.00 | 4.08 | 10.45 | 0.6068 | -0.4857 | |||
| WM / Waste Management, Inc. | 0.02 | 0.35 | 3.92 | -0.84 | 1.1114 | -0.0578 | |||
| HON / Honeywell International Inc. | 0.02 | -3.99 | 3.78 | 5.59 | 0.5622 | -0.4967 | |||
| QQQ / Invesco QQQ Trust, Series 1 | 0.01 | 5.41 | 3.74 | 24.03 | 0.5567 | -0.3361 | |||
| STIP / iShares Trust - iShares 0-5 Year TIPS Bond ETF | 0.03 | 11.05 | 3.50 | 10.44 | 0.5207 | -0.4168 | |||
| ADP / Automatic Data Processing, Inc. | 0.01 | 0.00 | 3.33 | 0.94 | 0.4950 | -0.4802 | |||
| ABBV / AbbVie Inc. | 0.02 | 0.45 | 3.24 | -11.02 | 0.4818 | -0.5948 | |||
| DUK / Duke Energy Corporation | 0.02 | 0.00 | 2.78 | -3.23 | 0.4140 | -0.4370 | |||
| ABT / Abbott Laboratories | 0.02 | 0.00 | 2.66 | 2.55 | 0.3955 | -0.3716 | |||
| JNJ / Johnson & Johnson | 0.02 | 0.00 | 2.65 | -7.87 | 0.7500 | -0.0996 | |||
| WMT / Walmart Inc. | 0.03 | 0.77 | 2.57 | 12.22 | 0.3827 | -0.2954 | |||
| PG / The Procter & Gamble Company | 0.02 | -29.91 | 2.55 | -34.49 | 0.3790 | -0.7713 | |||
| ENB / Enbridge Inc. | 0.05 | -1.79 | 2.36 | 0.43 | 0.3515 | -0.3444 | |||
| IBM / International Business Machines Corporation | 0.01 | 0.00 | 2.31 | 18.53 | 0.3436 | -0.2328 | |||
| IWF / iShares Trust - iShares Russell 1000 Growth ETF | 0.00 | 0.00 | 2.11 | 17.53 | 0.3133 | -0.2165 | |||
| NSC / Norfolk Southern Corporation | 0.01 | 0.00 | 2.09 | 8.11 | 0.3114 | -0.2616 | |||
| CVX / Chevron Corporation | 0.01 | 0.00 | 1.86 | -14.40 | 0.2768 | -0.3663 | |||
| PEP / PepsiCo, Inc. | 0.01 | 0.00 | 1.79 | -11.95 | 0.2664 | -0.3352 | |||
| KO / The Coca-Cola Company | 0.02 | 0.00 | 1.74 | -1.20 | 0.2583 | -0.2617 | |||
| MMM / 3M Company | 0.01 | 0.00 | 1.72 | 3.69 | 0.2552 | -0.2343 | |||
| XOM / Exxon Mobil Corporation | 0.01 | 0.00 | 1.48 | -9.39 | 0.2198 | -0.2625 | |||
| RF / Regions Financial Corporation | 0.06 | 0.00 | 1.39 | 8.24 | 0.2072 | -0.1735 | |||
| KMB / Kimberly-Clark Corporation | 0.01 | 0.00 | 1.39 | -9.34 | 0.2066 | -0.2466 | |||
| IP / International Paper Company | 0.03 | 0.00 | 1.35 | -12.22 | 0.3833 | -0.0723 | |||
| VZ / Verizon Communications Inc. | 0.03 | 0.00 | 1.32 | -4.61 | 0.1970 | -0.2137 | |||
| CARR / Carrier Global Corporation | 0.02 | 0.00 | 1.28 | 15.49 | 0.1897 | -0.1371 | |||
| MRK / Merck & Co., Inc. | 0.02 | 0.00 | 1.26 | -11.82 | 0.1877 | -0.2356 | |||
| COP / ConocoPhillips | 0.01 | 0.00 | 1.20 | -14.55 | 0.1783 | -0.2367 | |||
| BRK.B / Berkshire Hathaway Inc. | 0.00 | 0.00 | 1.14 | -8.73 | 0.1695 | -0.2000 | |||
| IWS / iShares Trust - iShares Russell Mid-Cap Value ETF | 0.01 | -36.86 | 1.14 | -33.76 | 0.1690 | -0.3385 | |||
| WY / Weyerhaeuser Company | 0.04 | 0.00 | 0.99 | -12.29 | 0.1476 | -0.1870 | |||
| CVS / CVS Health Corporation | 0.01 | 0.00 | 0.97 | 1.79 | 0.1437 | -0.1369 | |||
| VMC / Vulcan Materials Company | 0.00 | -31.59 | 0.93 | -23.50 | 0.1386 | -0.2217 | |||
| OTIS / Otis Worldwide Corporation | 0.01 | 0.00 | 0.91 | -4.10 | 0.1359 | -0.1458 | |||
| SO / The Southern Company | 0.01 | 0.00 | 0.91 | -0.11 | 0.1351 | -0.1339 | |||
| EPD / Enterprise Products Partners L.P. - Limited Partnership | 0.03 | 0.00 | 0.87 | -9.12 | 0.1290 | -0.1534 | |||
| ESS MANAGEMENT HOLDINGS LLC / (SUN009232) | 0.00 | 0.79 | 0.0000 | ||||||
| EL / The Estée Lauder Companies Inc. | 0.01 | 0.00 | 0.75 | 22.33 | 0.1109 | -0.0693 | |||
| DD / DuPont de Nemours, Inc. | 0.01 | -0.93 | 0.73 | -9.01 | 0.1083 | -0.1283 | |||
| AMGN / Amgen Inc. | 0.00 | 0.00 | 0.71 | -10.38 | 0.1054 | -0.1285 | |||
| BAX / Baxter International Inc. | 0.02 | 1.22 | 0.69 | -10.48 | 0.1030 | -0.1258 | |||
| ESS MANAGEMENT HOLDINGS LLC / (SUN009224) | 0.00 | 0.64 | 0.0000 | ||||||
| QCOM / QUALCOMM Incorporated | 0.00 | 0.00 | 0.55 | 3.60 | 0.0815 | -0.0748 | |||
| MO / Altria Group, Inc. | 0.01 | 0.00 | 0.54 | -2.34 | 0.0808 | -0.0837 | |||
| PFE / Pfizer Inc. | 0.02 | -21.77 | 0.50 | -25.15 | 0.0749 | -0.1241 | |||
| DOW / Dow Inc. | 0.02 | -3.79 | 0.47 | -27.13 | 0.0701 | -0.1209 | |||
| AMZN / Amazon.com, Inc. | 0.00 | 16.52 | 0.46 | 34.49 | 0.0691 | -0.0332 | |||
| XLK / The Select Sector SPDR Trust - The Technology Select Sector SPDR Fund | 0.00 | 0.00 | 0.45 | 22.59 | 0.0663 | -0.0412 | |||
| GE / General Electric Company | 0.00 | -4.90 | 0.43 | 22.25 | 0.0647 | -0.0405 | |||
| NVDA / NVIDIA Corporation | 0.00 | 0.00 | 0.43 | 45.64 | 0.0646 | -0.0235 | |||
| LIN / Linde plc | 0.00 | 0.00 | 0.41 | 0.73 | 0.0614 | -0.0598 | |||
| CAG / Conagra Brands, Inc. | 0.02 | 3.11 | 0.41 | -20.82 | 0.0606 | -0.0917 | |||
| INTC / Intel Corporation | 0.02 | -1.15 | 0.39 | -2.53 | 0.0574 | -0.0597 | |||
| CAT / Caterpillar Inc. | 0.00 | -54.95 | 0.38 | -47.08 | 0.0568 | -0.1563 | |||
| CSCO / Cisco Systems, Inc. | 0.01 | 0.00 | 0.38 | 12.54 | 0.0561 | -0.0431 | |||
| TWIN CITIES FINANCIAL / (901410100) | 0.00 | 0.34 | 0.0000 | ||||||
| T / AT&T Inc. | 0.01 | -14.74 | 0.33 | -12.79 | 0.0498 | -0.0637 | |||
| AMAT / Applied Materials, Inc. | 0.00 | 0.00 | 0.26 | 26.21 | 0.0388 | -0.0224 | |||
| VUG / Vanguard Index Funds - Vanguard Growth ETF | 0.00 | 0.00 | 0.26 | 18.18 | 0.0387 | -0.0264 | |||
| C / Citigroup Inc. | 0.00 | 0.00 | 0.25 | 19.51 | 0.0366 | -0.0241 | |||
| VYM / Vanguard Whitehall Funds - Vanguard High Dividend Yield ETF | 0.00 | 0.00 | 0.25 | 3.38 | 0.0365 | -0.0337 | |||
| PNC / The PNC Financial Services Group, Inc. | 0.00 | 0.00 | 0.24 | 6.22 | 0.0356 | -0.0312 | |||
| VTI / Vanguard Index Funds - Vanguard Total Stock Market ETF | 0.00 | 0.00 | 0.24 | 10.85 | 0.0350 | -0.0279 | |||
| MCD / McDonald's Corporation | 0.00 | 0.00 | 0.22 | -6.44 | 0.0326 | -0.0367 | |||
| TSCO / Tractor Supply Company | 0.00 | 0.00 | 0.22 | -4.00 | 0.0321 | -0.0346 | |||
| UNP / Union Pacific Corporation | 0.00 | 0.00 | 0.21 | -2.29 | 0.0317 | -0.0330 | |||
| MDLZ / Mondelez International, Inc. | 0.00 | 0.00 | 0.20 | -0.49 | 0.0301 | -0.0301 | |||
| PVCT / Provectus Biopharmaceuticals, Inc. | 0.10 | 0.00 | 0.01 | -30.00 | 0.0011 | -0.0018 | |||
| ALL / The Allstate Corporation | 0.00 | -100.00 | 0.00 | 0.0000 | |||||
| PPG / PPG Industries, Inc. | 0.00 | -100.00 | 0.00 | 0.0000 | |||||
| ETN / Eaton Corporation plc | 0.00 | -100.00 | 0.00 | 0.0000 | |||||
| KR / The Kroger Co. | 0.00 | -100.00 | 0.00 | 0.0000 |