Statistik Asas
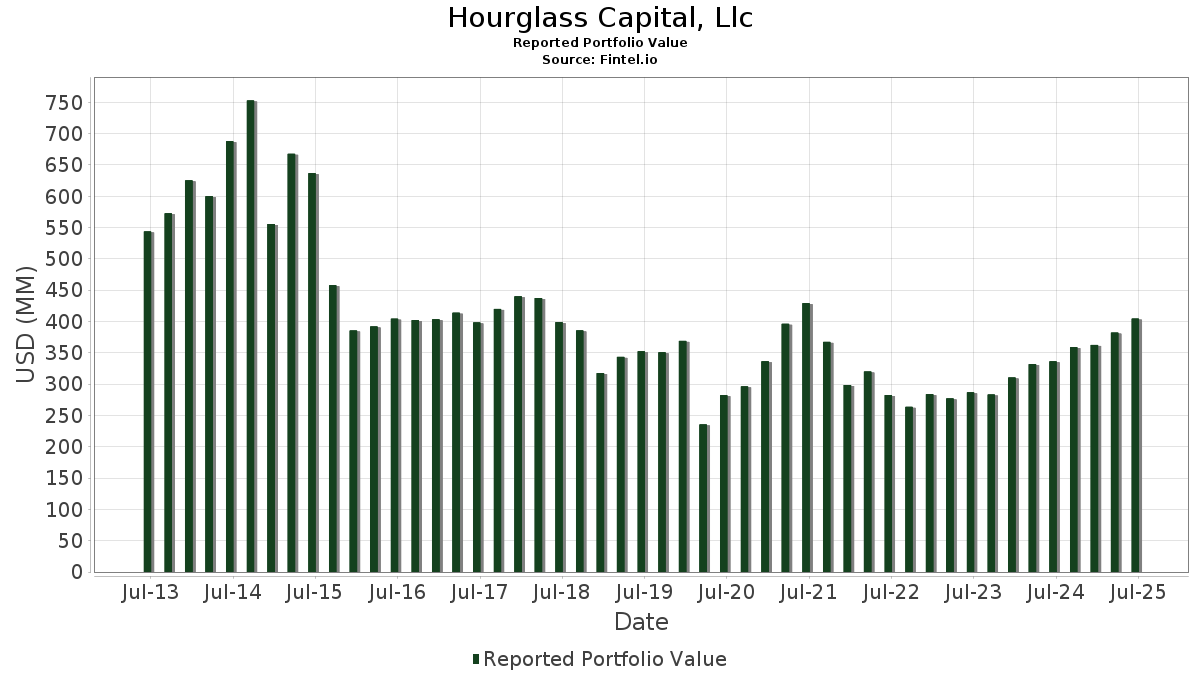
| Nilai Portfolio | $ 404,537,187 |
| Kedudukan Semasa | 106 |
Pegangan Terkini, Prestasi, AUM (dari 13F, 13D)
Hourglass Capital, Llc telah mendedahkan 106 jumlah pegangan dalam pemfailan SEC terkini mereka. Nilai portfolio terkini dikira sebagai $ 404,537,187 USD. Aset Sebenar Di Bawah Pengurusan (AUM) ialah nilai ini ditambah dengan tunai (yang tidak didedahkan). Pegangan teratas Hourglass Capital, Llc ialah The Goldman Sachs Group, Inc. (US:GS) , Cisco Systems, Inc. (US:CSCO) , Oracle Corporation (US:ORCL) , Newmont Corporation (US:NEM) , and LyondellBasell Industries N.V. (US:LYB) . Kedudukan baharu Hourglass Capital, Llc termasuk Biogen Inc. (US:BIIB) , ManpowerGroup Inc. (US:MAN) , .
Kenaikan Teratas Suku Tahun Ini
Kami menggunakan perubahan dalam peruntukan portfolio kerana ini adalah metrik yang paling bermakna. Perubahan boleh disebabkan oleh perdagangan atau perubahan dalam harga saham.
| Sekuriti | Saham (MM) |
Nilai (MM$) |
Portfolio % | ΔPortfolio % |
|---|---|---|---|---|
| 0.05 | 11.03 | 2.7275 | 0.8458 | |
| 0.18 | 10.68 | 2.6398 | 0.6272 | |
| 0.04 | 6.51 | 1.6083 | 0.5936 | |
| 0.05 | 9.04 | 2.2357 | 0.5832 | |
| 0.05 | 5.77 | 1.4254 | 0.5636 | |
| 0.02 | 2.26 | 0.5579 | 0.5579 | |
| 0.06 | 2.22 | 0.5500 | 0.5500 | |
| 0.02 | 5.80 | 1.4340 | 0.5407 | |
| 0.02 | 12.22 | 3.0213 | 0.5099 | |
| 0.16 | 11.17 | 2.7617 | 0.3447 |
Penurunan Teratas Suku Tahun Ini
Kami menggunakan perubahan dalam peruntukan portfolio kerana ini adalah metrik yang paling bermakna. Perubahan boleh disebabkan oleh perdagangan atau perubahan dalam harga saham.
| Sekuriti | Saham (MM) |
Nilai (MM$) |
Portfolio % | ΔPortfolio % |
|---|---|---|---|---|
| 0.04 | 0.94 | 0.2324 | -1.0566 | |
| 0.02 | 1.68 | 0.4141 | -1.0044 | |
| 0.23 | 7.88 | 1.9469 | -0.7389 | |
| 0.03 | 5.78 | 1.4299 | -0.5831 | |
| 0.06 | 5.74 | 1.4189 | -0.5780 | |
| 0.14 | 6.21 | 1.5346 | -0.4781 | |
| 0.03 | 5.57 | 1.3759 | -0.4271 | |
| 0.05 | 9.88 | 2.4427 | -0.3642 | |
| 0.04 | 6.25 | 1.5457 | -0.3536 | |
| 0.15 | 5.77 | 1.4257 | -0.3326 |
13F dan Pemfailan Dana
Borang ini telah difailkan pada 2025-07-29 untuk tempoh pelaporan 2025-06-30. Klik ikon pautan untuk melihat sejarah transaksi penuh.
Tingkatkan untuk membuka data premium dan eksport ke Excel ![]() .
.
| Sekuriti | Jenis | Purata Harga Saham | Saham (MM) |
ΔSaham (%) |
ΔSaham (%) |
Nilai ($MM) |
Portfolio (%) |
ΔPortfolio (%) |
|
|---|---|---|---|---|---|---|---|---|---|
| GS / The Goldman Sachs Group, Inc. | 0.02 | -1.71 | 12.22 | 27.35 | 3.0213 | 0.5099 | |||
| CSCO / Cisco Systems, Inc. | 0.16 | 7.58 | 11.17 | 20.95 | 2.7617 | 0.3447 | |||
| ORCL / Oracle Corporation | 0.05 | -1.89 | 11.03 | 53.43 | 2.7275 | 0.8458 | |||
| NEM / Newmont Corporation | 0.19 | -12.76 | 10.82 | 5.27 | 2.6751 | -0.0146 | |||
| LYB / LyondellBasell Industries N.V. | 0.18 | 68.93 | 10.68 | 38.85 | 2.6398 | 0.6272 | |||
| PFE / Pfizer Inc. | 0.44 | 8.96 | 10.58 | 4.24 | 2.6152 | -0.0406 | |||
| C / Citigroup Inc. | 0.12 | -0.88 | 10.49 | 18.85 | 2.5938 | 0.2836 | |||
| MS / Morgan Stanley | 0.07 | -1.62 | 10.25 | 18.78 | 2.5344 | 0.2758 | |||
| PM / Philip Morris International Inc. | 0.05 | -19.72 | 9.88 | -7.88 | 2.4427 | -0.3642 | |||
| GOOGL / Alphabet Inc. | 0.05 | 25.66 | 9.04 | 43.21 | 2.2357 | 0.5832 | |||
| KMI / Kinder Morgan, Inc. | 0.29 | -2.59 | 8.61 | 0.38 | 2.1291 | -0.1161 | |||
| SLB / Schlumberger Limited | 0.23 | -5.11 | 7.88 | -23.28 | 1.9469 | -0.7389 | |||
| WMB / The Williams Companies, Inc. | 0.12 | 1.26 | 7.75 | 6.42 | 1.9150 | 0.0103 | |||
| HCA / HCA Healthcare, Inc. | 0.02 | -5.69 | 7.66 | 4.57 | 1.8931 | -0.0233 | |||
| WMT / Walmart Inc. | 0.08 | -1.74 | 7.44 | 9.44 | 1.8392 | 0.0603 | |||
| HD / The Home Depot, Inc. | 0.02 | 30.21 | 7.34 | 30.26 | 1.8145 | 0.3401 | |||
| MAIN / Main Street Capital Corporation | 0.12 | 2.53 | 7.31 | 7.14 | 1.8064 | 0.0216 | |||
| IBM / International Business Machines Corporation | 0.02 | 4.45 | 7.30 | 23.82 | 1.8057 | 0.2620 | |||
| FCX / Freeport-McMoRan Inc. | 0.16 | -4.80 | 6.76 | 9.00 | 1.6699 | 0.0484 | |||
| MSFT / Microsoft Corporation | 0.01 | -4.43 | 6.70 | 26.63 | 1.6562 | 0.2718 | |||
| NVDA / NVIDIA Corporation | 0.04 | 15.09 | 6.51 | 67.81 | 1.6083 | 0.5936 | |||
| CNR / Core Natural Resources, Inc. | 0.09 | 4.52 | 6.35 | -5.45 | 1.5692 | -0.1876 | |||
| CVX / Chevron Corporation | 0.04 | 0.65 | 6.25 | -13.86 | 1.5457 | -0.3536 | |||
| NRG / NRG Energy, Inc. | 0.04 | -39.44 | 6.23 | 1.88 | 1.5410 | -0.0601 | |||
| FHI / Federated Hermes, Inc. | 0.14 | -25.76 | 6.21 | -19.29 | 1.5346 | -0.4781 | |||
| XOM / Exxon Mobil Corporation | 0.05 | 1.07 | 5.87 | -8.40 | 1.4512 | -0.2256 | |||
| T / AT&T Inc. | 0.20 | 3.19 | 5.82 | 5.61 | 1.4377 | -0.0034 | |||
| AVGO / Broadcom Inc. | 0.02 | 3.21 | 5.80 | 69.97 | 1.4340 | 0.5407 | |||
| AAPL / Apple Inc. | 0.03 | -18.59 | 5.78 | -24.81 | 1.4299 | -0.5831 | |||
| KEX / Kirby Corporation | 0.05 | 8.06 | 5.78 | 21.33 | 1.4286 | 0.1822 | |||
| BKR / Baker Hughes Company | 0.15 | -1.62 | 5.77 | -14.17 | 1.4257 | -0.3326 | |||
| LAMR / Lamar Advertising Company | 0.05 | 64.15 | 5.77 | 75.10 | 1.4254 | 0.5636 | |||
| ZBH / Zimmer Biomet Holdings, Inc. | 0.06 | -6.67 | 5.74 | -24.79 | 1.4189 | -0.5780 | |||
| VICI / VICI Properties Inc. | 0.18 | -1.14 | 5.74 | -1.19 | 1.4177 | -0.1011 | |||
| DAL / Delta Air Lines, Inc. | 0.12 | 9.71 | 5.72 | 23.75 | 1.4144 | 0.2046 | |||
| ABBV / AbbVie Inc. | 0.03 | -8.82 | 5.57 | -19.22 | 1.3759 | -0.4271 | |||
| SJM / The J. M. Smucker Company | 0.05 | 7.13 | 5.02 | -11.15 | 1.2407 | -0.2375 | |||
| GSK / GSK plc - Depositary Receipt (Common Stock) | 0.13 | 10.51 | 5.01 | 9.55 | 1.2396 | 0.0418 | |||
| WDS / Woodside Energy Group Ltd - Depositary Receipt (Common Stock) | 0.31 | 15.07 | 4.80 | 22.54 | 1.1855 | 0.1614 | |||
| VLO / Valero Energy Corporation | 0.03 | 0.00 | 4.62 | 1.79 | 1.1412 | -0.0457 | |||
| MCK / McKesson Corporation | 0.01 | 0.00 | 4.48 | 8.90 | 1.1073 | 0.0308 | |||
| KHC / The Kraft Heinz Company | 0.17 | 3.25 | 4.32 | -12.41 | 1.0683 | -0.2224 | |||
| RF / Regions Financial Corporation | 0.18 | 12.61 | 4.29 | 21.91 | 1.0593 | 0.1393 | |||
| QCOM / QUALCOMM Incorporated | 0.03 | 2.40 | 4.15 | 6.17 | 1.0259 | 0.0030 | |||
| BHP / BHP Group Limited - Depositary Receipt (Common Stock) | 0.09 | 3.62 | 4.12 | 2.66 | 1.0193 | -0.0317 | |||
| VLY / Valley National Bancorp | 0.46 | 3.65 | 4.11 | 4.13 | 1.0170 | -0.0170 | |||
| GM / General Motors Company | 0.08 | 0.00 | 4.09 | 4.65 | 1.0121 | -0.0118 | |||
| UPS / United Parcel Service, Inc. | 0.04 | 14.37 | 3.92 | 4.98 | 0.9690 | -0.0082 | |||
| HPQ / HP Inc. | 0.15 | 5.32 | 3.77 | -6.98 | 0.9318 | -0.1284 | |||
| IRM / Iron Mountain Incorporated | 0.03 | 1.98 | 3.49 | 21.58 | 0.8636 | 0.1116 | |||
| MMM / 3M Company | 0.02 | 0.00 | 3.48 | 3.67 | 0.8595 | -0.0181 | |||
| BRK.B / Berkshire Hathaway Inc. | 0.01 | -1.65 | 3.47 | -10.30 | 0.8568 | -0.1542 | |||
| CXW / CoreCivic, Inc. | 0.16 | 0.00 | 3.44 | 3.84 | 0.8499 | -0.0164 | |||
| UGI / UGI Corporation | 0.09 | 0.00 | 3.25 | 10.15 | 0.8022 | 0.0312 | |||
| HPE / Hewlett Packard Enterprise Company | 0.15 | 0.00 | 3.00 | 32.51 | 0.7408 | 0.1492 | |||
| LNG / Cheniere Energy, Inc. | 0.01 | 0.00 | 2.88 | 5.27 | 0.7112 | -0.0041 | |||
| OI / O-I Glass, Inc. | 0.18 | 0.00 | 2.64 | 28.49 | 0.6536 | 0.1152 | |||
| BAC / Bank of America Corporation | 0.05 | 0.00 | 2.49 | 13.42 | 0.6163 | 0.0410 | |||
| JEPI / J.P. Morgan Exchange-Traded Fund Trust - JPMorgan Equity Premium Income ETF | 0.04 | 0.00 | 2.40 | -0.50 | 0.5923 | -0.0379 | |||
| CPRI / Capri Holdings Limited | 0.13 | 29.39 | 2.37 | 16.05 | 0.5862 | 0.0516 | |||
| BIIB / Biogen Inc. | 0.02 | 2.26 | 0.5579 | 0.5579 | |||||
| MAN / ManpowerGroup Inc. | 0.06 | 2.22 | 0.5500 | 0.5500 | |||||
| VZ / Verizon Communications Inc. | 0.05 | 3.17 | 2.17 | -1.59 | 0.5369 | -0.0406 | |||
| CMCSA / Comcast Corporation | 0.06 | -0.25 | 2.14 | -3.51 | 0.5301 | -0.0515 | |||
| TNL / Travel + Leisure Co. | 0.04 | 0.00 | 2.08 | 11.49 | 0.5136 | 0.0260 | |||
| FITB / Fifth Third Bancorp | 0.05 | 7.38 | 1.85 | 12.64 | 0.4585 | 0.0277 | |||
| SYY / Sysco Corporation | 0.02 | -69.38 | 1.68 | -69.10 | 0.4141 | -1.0044 | |||
| NVO / Novo Nordisk A/S - Depositary Receipt (Common Stock) | 0.02 | 11.10 | 1.60 | 10.45 | 0.3946 | 0.0163 | |||
| VTI / Vanguard Index Funds - Vanguard Total Stock Market ETF | 0.01 | 18.78 | 1.54 | 31.37 | 0.3801 | 0.0738 | |||
| FSLR / First Solar, Inc. | 0.01 | 20.13 | 1.48 | 57.39 | 0.3662 | 0.1198 | |||
| SDY / SPDR Series Trust - SPDR S&P Dividend ETF | 0.01 | -3.65 | 1.43 | -3.64 | 0.3538 | -0.0348 | |||
| JNJ / Johnson & Johnson | 0.01 | -1.11 | 1.36 | -8.90 | 0.3364 | -0.0545 | |||
| TAP / Molson Coors Beverage Company | 0.03 | 0.00 | 1.33 | -20.99 | 0.3286 | -0.1117 | |||
| XLK / The Select Sector SPDR Trust - The Technology Select Sector SPDR Fund | 0.00 | -7.50 | 1.25 | 13.45 | 0.3086 | 0.0206 | |||
| MOS / The Mosaic Company | 0.03 | -39.93 | 1.21 | -18.88 | 0.2985 | -0.0909 | |||
| JPM / JPMorgan Chase & Co. | 0.00 | 0.00 | 1.02 | 18.14 | 0.2513 | 0.0262 | |||
| DOW / Dow Inc. | 0.04 | -74.84 | 0.94 | -80.92 | 0.2324 | -1.0566 | |||
| LIN / Linde plc | 0.00 | -0.30 | 0.94 | 0.43 | 0.2322 | -0.0125 | |||
| DHI / D.R. Horton, Inc. | 0.01 | 0.00 | 0.91 | 1.45 | 0.2250 | -0.0099 | |||
| ETN / Eaton Corporation plc | 0.00 | 0.00 | 0.86 | 31.29 | 0.2118 | 0.0411 | |||
| CLF / Cleveland-Cliffs Inc. | 0.09 | 24.53 | 0.71 | 15.10 | 0.1755 | 0.0142 | |||
| FLG / Flagstar Financial, Inc. | 0.07 | -5.73 | 0.70 | -14.06 | 0.1725 | -0.0398 | |||
| SPY / SPDR S&P 500 ETF | 0.00 | 0.00 | 0.65 | 10.58 | 0.1602 | 0.0067 | |||
| LMT / Lockheed Martin Corporation | 0.00 | 0.00 | 0.46 | 3.81 | 0.1145 | -0.0024 | |||
| SOFI / SoFi Technologies, Inc. | 0.03 | -7.41 | 0.46 | 44.90 | 0.1125 | 0.0304 | |||
| RTX / RTX Corporation | 0.00 | 0.00 | 0.44 | 10.33 | 0.1083 | 0.0043 | |||
| XLC / The Select Sector SPDR Trust - The Communication Services Select Sector SPDR Fund | 0.00 | 0.00 | 0.43 | 12.73 | 0.1073 | 0.0064 | |||
| AMGN / Amgen Inc. | 0.00 | 0.00 | 0.38 | -10.26 | 0.0930 | -0.0168 | |||
| OEF / iShares Trust - iShares S&P 100 ETF | 0.00 | -44.95 | 0.37 | -38.14 | 0.0903 | -0.0642 | |||
| COST / Costco Wholesale Corporation | 0.00 | 0.00 | 0.36 | 4.62 | 0.0896 | -0.0010 | |||
| CL / Colgate-Palmolive Company | 0.00 | 0.00 | 0.34 | -2.89 | 0.0831 | -0.0076 | |||
| MPC / Marathon Petroleum Corporation | 0.00 | 0.00 | 0.33 | 14.09 | 0.0821 | 0.0059 | |||
| ROST / Ross Stores, Inc. | 0.00 | 0.00 | 0.33 | -0.30 | 0.0820 | -0.0049 | |||
| PG / The Procter & Gamble Company | 0.00 | -3.67 | 0.32 | -10.08 | 0.0796 | -0.0140 | |||
| GOOG / Alphabet Inc. | 0.00 | 0.00 | 0.29 | 13.62 | 0.0724 | 0.0049 | |||
| CAT / Caterpillar Inc. | 0.00 | 0.00 | 0.29 | 17.48 | 0.0717 | 0.0072 | |||
| GD / General Dynamics Corporation | 0.00 | 0.00 | 0.27 | 7.20 | 0.0663 | 0.0007 | |||
| LH / Labcorp Holdings Inc. | 0.00 | 0.00 | 0.26 | 12.93 | 0.0649 | 0.0040 | |||
| TM / Toyota Motor Corporation - Depositary Receipt (Common Stock) | 0.00 | 0.00 | 0.24 | -2.43 | 0.0596 | -0.0051 | |||
| COP / ConocoPhillips | 0.00 | 0.00 | 0.23 | -14.45 | 0.0557 | -0.0133 | |||
| PSX / Phillips 66 | 0.00 | 0.00 | 0.21 | -3.21 | 0.0522 | -0.0050 | |||
| IWD / iShares Trust - iShares Russell 1000 Value ETF | 0.00 | 0.00 | 0.21 | 2.99 | 0.0513 | -0.0013 | |||
| UBER / Uber Technologies, Inc. | 0.00 | -61.36 | 0.21 | -50.60 | 0.0508 | -0.0579 | |||
| BMY / Bristol-Myers Squibb Company | 0.00 | 0.00 | 0.20 | -24.24 | 0.0495 | -0.0196 | |||
| F / Ford Motor Company | 0.01 | -1.48 | 0.11 | 6.93 | 0.0268 | 0.0002 | |||
| UEC / Uranium Energy Corp. | 0.01 | 0.00 | 0.07 | 44.68 | 0.0168 | 0.0043 | |||
| EXP / Eagle Materials Inc. | 0.00 | -100.00 | 0.00 | 0.0000 | |||||
| ARLP / Alliance Resource Partners, L.P. - Limited Partnership | 0.00 | -100.00 | 0.00 | 0.0000 | |||||
| CTRA / Coterra Energy Inc. | 0.00 | -100.00 | 0.00 | 0.0000 | |||||
| FI / Fiserv, Inc. | 0.00 | -100.00 | 0.00 | 0.0000 | |||||
| PAAS / Pan American Silver Corp. | 0.00 | -100.00 | 0.00 | 0.0000 | |||||
| HON / Honeywell International Inc. | 0.00 | -100.00 | 0.00 | 0.0000 |