Statistik Asas
| Nilai Portfolio | $ 422,754 |
| Kedudukan Semasa | 110 |
Pegangan Terkini, Prestasi, AUM (dari 13F, 13D)
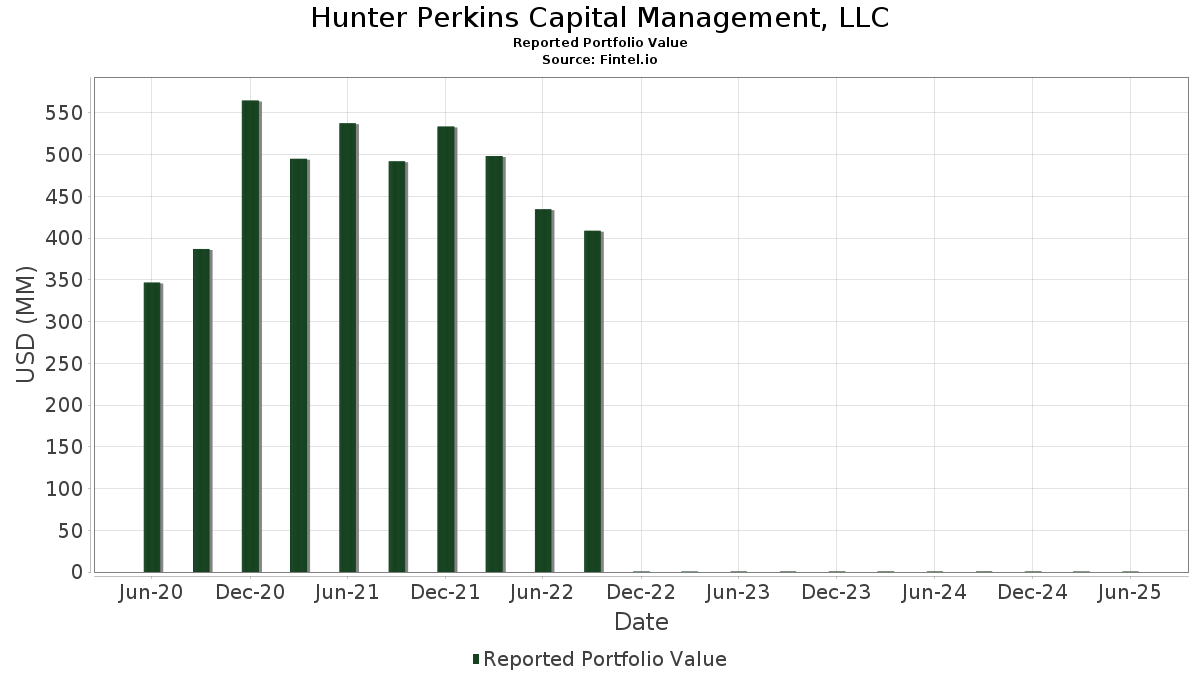
Hunter Perkins Capital Management, LLC telah mendedahkan 110 jumlah pegangan dalam pemfailan SEC terkini mereka. Nilai portfolio terkini dikira sebagai $ 422,754 USD. Aset Sebenar Di Bawah Pengurusan (AUM) ialah nilai ini ditambah dengan tunai (yang tidak didedahkan). Pegangan teratas Hunter Perkins Capital Management, LLC ialah Labcorp Holdings Inc. (US:LH) , Casey's General Stores, Inc. (US:CASY) , Berkshire Hathaway Inc. (US:BRK.B) , Equity LifeStyle Properties, Inc. (US:ELS) , and Fiserv, Inc. (US:FI) . Kedudukan baharu Hunter Perkins Capital Management, LLC termasuk Flowers Foods, Inc. (US:FLO) , SPDR S&P 500 ETF (US:SPY) , Bio-Techne Corporation (US:TECH) , MSA Safety Incorporated (US:MSA) , and First Industrial Realty Trust, Inc. (DE:F5W) .
Kenaikan Teratas Suku Tahun Ini
Kami menggunakan perubahan dalam peruntukan portfolio kerana ini adalah metrik yang paling bermakna. Perubahan boleh disebabkan oleh perdagangan atau perubahan dalam harga saham.
| Sekuriti | Saham (MM) |
Nilai (MM$) |
Portfolio % | ΔPortfolio % |
|---|---|---|---|---|
| 0.24 | 0.00 | 0.9086 | 0.9086 | |
| 0.04 | 0.01 | 1.9406 | 0.5445 | |
| 0.05 | 0.03 | 6.3694 | 0.5055 | |
| 0.05 | 0.01 | 2.7763 | 0.4738 | |
| 0.44 | 0.00 | 0.4516 | 0.4516 | |
| 0.07 | 0.01 | 3.0247 | 0.4156 | |
| 0.11 | 0.03 | 6.5291 | 0.3979 | |
| 0.01 | 0.00 | 0.3948 | 0.3948 | |
| 0.12 | 0.01 | 1.5274 | 0.3059 | |
| 0.02 | 0.01 | 1.5494 | 0.2649 |
Penurunan Teratas Suku Tahun Ini
Kami menggunakan perubahan dalam peruntukan portfolio kerana ini adalah metrik yang paling bermakna. Perubahan boleh disebabkan oleh perdagangan atau perubahan dalam harga saham.
| Sekuriti | Saham (MM) |
Nilai (MM$) |
Portfolio % | ΔPortfolio % |
|---|---|---|---|---|
| 0.04 | 0.00 | 0.2287 | -1.4347 | |
| 0.07 | 0.00 | 0.2737 | -0.6271 | |
| 0.08 | 0.01 | 3.1839 | -0.5435 | |
| 0.19 | 0.01 | 2.5684 | -0.5193 | |
| 0.05 | 0.03 | 6.0655 | -0.4603 | |
| 0.08 | 0.01 | 1.2494 | -0.3878 | |
| 0.02 | 0.00 | 0.2446 | -0.3571 | |
| 0.28 | 0.01 | 2.4714 | -0.3185 | |
| 0.29 | 0.02 | 4.2732 | -0.2738 | |
| 0.11 | 0.01 | 2.1450 | -0.2130 |
13F dan Pemfailan Dana
Borang ini telah difailkan pada 2025-07-22 untuk tempoh pelaporan 2025-06-30. Klik ikon pautan untuk melihat sejarah transaksi penuh.
Tingkatkan untuk membuka data premium dan eksport ke Excel ![]() .
.
| Sekuriti | Jenis | Purata Harga Saham | Saham (MM) |
ΔSaham (%) |
ΔSaham (%) |
Nilai ($MM) |
Portfolio (%) |
ΔPortfolio (%) |
|
|---|---|---|---|---|---|---|---|---|---|
| LH / Labcorp Holdings Inc. | 0.11 | -7.31 | 0.03 | 3.85 | 6.5291 | 0.3979 | |||
| CASY / Casey's General Stores, Inc. | 0.05 | -9.29 | 0.03 | 4.00 | 6.3694 | 0.5055 | |||
| BRK.B / Berkshire Hathaway Inc. | 0.05 | 0.04 | 0.03 | -10.71 | 6.0655 | -0.4603 | |||
| ELS / Equity LifeStyle Properties, Inc. | 0.29 | -0.21 | 0.02 | -5.26 | 4.2732 | -0.2738 | |||
| FI / Fiserv, Inc. | 0.08 | 7.41 | 0.01 | -18.75 | 3.1839 | -0.5435 | |||
| GOOGL / Alphabet Inc. | 0.07 | -0.13 | 0.01 | 9.09 | 3.0247 | 0.4156 | |||
| ADI / Analog Devices, Inc. | 0.05 | 0.31 | 0.01 | 22.22 | 2.7763 | 0.4738 | |||
| CB / Chubb Limited | 0.04 | 0.11 | 0.01 | 0.00 | 2.6323 | -0.0550 | |||
| PB / Prosperity Bancshares, Inc. | 0.15 | 0.18 | 0.01 | 0.00 | 2.5689 | 0.0193 | |||
| BKH / Black Hills Corporation | 0.19 | -11.71 | 0.01 | -23.08 | 2.5684 | -0.5193 | |||
| LKQ / LKQ Corporation | 0.28 | -0.04 | 0.01 | -16.67 | 2.4714 | -0.3185 | |||
| GPK / Graphic Packaging Holding Company | 0.48 | 16.36 | 0.01 | 0.00 | 2.4262 | -0.0888 | |||
| JBSS / John B. Sanfilippo & Son, Inc. | 0.14 | 21.06 | 0.01 | 12.50 | 2.1691 | 0.1982 | |||
| MRK / Merck & Co., Inc. | 0.11 | 0.88 | 0.01 | -10.00 | 2.1450 | -0.2130 | |||
| TFC / Truist Financial Corporation | 0.20 | 0.43 | 0.01 | 0.00 | 2.0773 | 0.1336 | |||
| TSM / Taiwan Semiconductor Manufacturing Company Limited - Depositary Receipt (Common Stock) | 0.04 | -0.06 | 0.01 | 33.33 | 1.9406 | 0.5445 | |||
| JNJ / Johnson & Johnson | 0.05 | -0.16 | 0.01 | 0.00 | 1.9385 | -0.1309 | |||
| GD / General Dynamics Corporation | 0.03 | -0.62 | 0.01 | 0.00 | 1.7670 | 0.1356 | |||
| EOG / EOG Resources, Inc. | 0.06 | 0.28 | 0.01 | 0.00 | 1.7544 | -0.0869 | |||
| HIG / The Hartford Insurance Group, Inc. | 0.05 | 0.19 | 0.01 | 0.00 | 1.6456 | 0.0749 | |||
| JPM / JPMorgan Chase & Co. | 0.02 | 0.20 | 0.01 | 20.00 | 1.5494 | 0.2649 | |||
| WBS / Webster Financial Corporation | 0.12 | 15.89 | 0.01 | 20.00 | 1.5274 | 0.3059 | |||
| ELV / Elevance Health, Inc. | 0.02 | 23.97 | 0.01 | 0.00 | 1.4089 | 0.1613 | |||
| WEC / WEC Energy Group, Inc. | 0.06 | -0.33 | 0.01 | -16.67 | 1.3642 | -0.0410 | |||
| MIDD / The Middleby Corporation | 0.04 | 0.59 | 0.01 | -16.67 | 1.3575 | -0.0407 | |||
| COLB / Columbia Banking System, Inc. | 0.25 | 23.95 | 0.01 | 25.00 | 1.3563 | 0.2105 | |||
| ENSG / The Ensign Group, Inc. | 0.04 | -0.23 | 0.01 | 25.00 | 1.2842 | 0.2243 | |||
| AOS / A. O. Smith Corporation | 0.08 | -25.32 | 0.01 | -28.57 | 1.2494 | -0.3878 | |||
| SCZ / Sun Communities, Inc. | 0.04 | -0.49 | 0.01 | 0.00 | 1.2042 | 0.0004 | |||
| CHKP / Check Point Software Technologies Ltd. | 0.02 | 0.30 | 0.00 | -20.00 | 1.1662 | -0.0098 | |||
| REGN / Regeneron Pharmaceuticals, Inc. | 0.01 | -0.11 | 0.00 | -20.00 | 1.0521 | -0.1972 | |||
| FCCO / First Community Corporation | 0.18 | 0.29 | 0.00 | 0.00 | 1.0410 | 0.0980 | |||
| SCHW / The Charles Schwab Corporation | 0.05 | -0.10 | 0.00 | 33.33 | 1.0406 | 0.1632 | |||
| BRK.A / Berkshire Hathaway Inc. | 0.00 | 0.00 | 0.00 | 0.00 | 1.0344 | -0.0782 | |||
| FLO / Flowers Foods, Inc. | 0.24 | 0.00 | 0.9086 | 0.9086 | |||||
| AMT / American Tower Corporation | 0.02 | 0.08 | 0.00 | 0.00 | 0.8319 | 0.0347 | |||
| 1GNTX / Gentex Corporation | 0.16 | -3.78 | 0.00 | 0.00 | 0.8066 | -0.0656 | |||
| COHR / Coherent Corp. | 0.04 | -0.14 | 0.00 | 50.00 | 0.8059 | 0.2291 | |||
| ICLR / ICON Public Limited Company | 0.02 | 0.43 | 0.00 | 0.00 | 0.7707 | -0.1357 | |||
| SSB / SouthState Corporation | 0.04 | 10.66 | 0.00 | 50.00 | 0.7700 | 0.0809 | |||
| SYK / Stryker Corporation | 0.01 | 0.12 | 0.00 | 0.00 | 0.7683 | 0.0600 | |||
| CP / Canadian Pacific Kansas City Limited | 0.04 | 0.00 | 0.00 | 50.00 | 0.7487 | 0.0982 | |||
| SPY / SPDR S&P 500 ETF | 0.00 | 100.00 | 0.5845 | 0.2078 | |||||
| WAT / Waters Corporation | 0.01 | 0.46 | 0.00 | 0.00 | 0.5781 | -0.0185 | |||
| GOOG / Alphabet Inc. | 0.01 | 0.00 | 0.00 | 100.00 | 0.5119 | 0.0693 | |||
| NANX / Solesence, Inc. | 0.44 | 0.00 | 0.4516 | 0.4516 | |||||
| PLD / Prologis, Inc. | 0.02 | 0.20 | 0.00 | 0.00 | 0.4210 | -0.0176 | |||
| CEF / Sprott Physical Gold and Silver Trust | 0.06 | -13.16 | 0.00 | 0.00 | 0.4147 | -0.0277 | |||
| PNFP / Pinnacle Financial Partners, Inc. | 0.02 | 0.00 | 0.00 | 0.00 | 0.4097 | 0.0233 | |||
| FANG / Diamondback Energy, Inc. | 0.01 | 0.00 | 0.3948 | 0.3948 | |||||
| AXS / AXIS Capital Holdings Limited | 0.02 | -14.06 | 0.00 | 0.00 | 0.3915 | -0.0386 | |||
| THG / The Hanover Insurance Group, Inc. | 0.01 | -15.69 | 0.00 | 0.00 | 0.3702 | -0.0713 | |||
| G7A / Grupo Aeroportuario del Centro Norte, S.A.B. de C.V. - Depositary Receipt (Common Stock) | 0.01 | -28.20 | 0.00 | 0.00 | 0.3595 | -0.0069 | |||
| UMH / UMH Properties, Inc. | 0.09 | 0.00 | 0.00 | 0.00 | 0.3480 | -0.0324 | |||
| RSG / Republic Services, Inc. | 0.01 | 0.27 | 0.00 | 0.00 | 0.3305 | 0.0128 | |||
| MTCH / Match Group, Inc. | 0.04 | 59.24 | 0.00 | 0.3255 | 0.1228 | ||||
| FITB / Fifth Third Bancorp | 0.03 | 18.87 | 0.00 | 0.00 | 0.3248 | 0.0696 | |||
| LAZ / Lazard, Inc. | 0.03 | -15.00 | 0.00 | 0.00 | 0.3238 | -0.0136 | |||
| IVV / iShares Trust - iShares Core S&P 500 ETF | 0.00 | 0.00 | 0.00 | 0.00 | 0.3144 | 0.0352 | |||
| LEA / Lear Corporation | 0.01 | 0.78 | 0.00 | 0.00 | 0.3111 | 0.0296 | |||
| HWC / Hancock Whitney Corporation | 0.02 | 0.00 | 0.00 | 0.00 | 0.3094 | 0.0319 | |||
| LFUS / Littelfuse, Inc. | 0.01 | 15.91 | 0.00 | 0.2872 | 0.0761 | ||||
| WTFC / Wintrust Financial Corporation | 0.01 | 0.00 | 0.00 | 0.00 | 0.2803 | 0.0307 | |||
| CVCO / Cavco Industries, Inc. | 0.00 | 23.68 | 0.00 | 0.00 | 0.2775 | 0.0141 | |||
| SSD / Simpson Manufacturing Co., Inc. | 0.01 | 2.90 | 0.00 | 0.00 | 0.2775 | 0.0097 | |||
| VSH / Vishay Intertechnology, Inc. | 0.07 | -70.12 | 0.00 | -66.67 | 0.2737 | -0.6271 | |||
| USB / U.S. Bancorp | 0.02 | 0.00 | 0.00 | 0.00 | 0.2611 | 0.0238 | |||
| REYN / Reynolds Consumer Products Inc. | 0.05 | 83.85 | 0.00 | 0.2533 | 0.1026 | ||||
| TSEM / Tower Semiconductor Ltd. | 0.02 | 0.00 | 0.00 | 0.2488 | 0.0480 | ||||
| ESAB / ESAB Corporation | 0.01 | -9.03 | 0.00 | 0.00 | 0.2472 | -0.0106 | |||
| ASO / Academy Sports and Outdoors, Inc. | 0.02 | -59.46 | 0.00 | -50.00 | 0.2446 | -0.3571 | |||
| TECH / Bio-Techne Corporation | 0.02 | 0.00 | 0.2434 | 0.2434 | |||||
| ELME / Elme Communities | 0.06 | 0.00 | 0.00 | 0.00 | 0.2413 | -0.0149 | |||
| MSFT / Microsoft Corporation | 0.00 | 0.00 | 0.00 | 0.2394 | 0.0620 | ||||
| MTDR / Matador Resources Company | 0.02 | -31.12 | 0.00 | -100.00 | 0.2292 | -0.1205 | |||
| MGY / Magnolia Oil & Gas Corporation | 0.04 | -84.83 | 0.00 | -100.00 | 0.2287 | -1.4347 | |||
| CSX / CSX Corporation | 0.03 | 0.00 | 0.00 | 0.2278 | 0.0262 | ||||
| CNS / Cohen & Steers, Inc. | 0.01 | -25.14 | 0.00 | -100.00 | 0.2197 | -0.0873 | |||
| AAPL / Apple Inc. | 0.00 | -11.74 | 0.00 | -100.00 | 0.2190 | -0.0445 | |||
| MMI / Marcus & Millichap, Inc. | 0.03 | -9.56 | 0.00 | -100.00 | 0.2162 | -0.0471 | |||
| KWR / Quaker Chemical Corporation | 0.01 | 15.37 | 0.00 | 0.2060 | 0.0124 | ||||
| MSA / MSA Safety Incorporated | 0.01 | 0.00 | 0.1982 | 0.1982 | |||||
| OSBC / Old Second Bancorp, Inc. | 0.05 | -12.05 | 0.00 | 0.1923 | -0.0090 | ||||
| AWI / Armstrong World Industries, Inc. | 0.00 | -12.23 | 0.00 | 0.1918 | 0.0058 | ||||
| TNET / TriNet Group, Inc. | 0.01 | 15.66 | 0.00 | 0.1878 | 0.0150 | ||||
| F5W / First Industrial Realty Trust, Inc. | 0.02 | 0.00 | 0.1765 | 0.1765 | |||||
| LEVI / Levi Strauss & Co. | 0.04 | -15.23 | 0.00 | 0.1559 | 0.0038 | ||||
| GNRC / Generac Holdings Inc. | 0.00 | -9.72 | 0.00 | 0.1478 | 0.0057 | ||||
| ETSY / Etsy, Inc. | 0.01 | -14.10 | 0.00 | 0.1403 | -0.0104 | ||||
| JLL / Jones Lang LaSalle Incorporated | 0.00 | 0.00 | 0.00 | 0.1358 | 0.0064 | ||||
| 0K1Y / Mitsubishi UFJ Financial Group, Inc. - Depositary Receipt (Common Stock) | 0.04 | -8.91 | 0.00 | 0.1327 | -0.0094 | ||||
| WNS / WNS (Holdings) Limited | 0.01 | -22.52 | 0.00 | 0.1266 | -0.0295 | ||||
| HAE / Haemonetics Corporation | 0.01 | 0.00 | 0.1254 | 0.1254 | |||||
| GM0N / Globus Medical, Inc. | 0.01 | 0.00 | 0.00 | 0.1232 | -0.0268 | ||||
| CNM / Core & Main, Inc. | 0.01 | -17.24 | 0.00 | 0.1228 | 0.0062 | ||||
| FZG1 / BlueLinx Holdings Inc. | 0.01 | 0.00 | 0.00 | 0.1171 | 0.0012 | ||||
| ZD / Ziff Davis, Inc. | 0.02 | 0.00 | 0.00 | 0.1166 | -0.0255 | ||||
| MRCY / Mercury Systems, Inc. | 0.01 | -6.34 | 0.00 | 0.1128 | 0.0181 | ||||
| WHD / Cactus, Inc. | 0.01 | 0.00 | 0.1093 | 0.1093 | |||||
| PFS / Provident Financial Services, Inc. | 0.03 | 0.00 | 0.1043 | 0.1043 | |||||
| KR / The Kroger Co. | 0.01 | 0.00 | 0.00 | 0.1038 | 0.0075 | ||||
| IRT / Independence Realty Trust, Inc. | 0.02 | 0.00 | 0.00 | 0.0965 | -0.0164 | ||||
| SLV / iShares Silver Trust | 0.01 | 0.00 | 0.00 | 0.0866 | 0.0062 | ||||
| OMCL / Omnicell, Inc. | 0.01 | 0.00 | 0.0650 | 0.0650 | |||||
| GLD / SPDR Gold Trust | 0.00 | 0.00 | 0.00 | 0.0504 | 0.0035 | ||||
| PML / PIMCO Municipal Income Fund II | 0.03 | 0.00 | 0.00 | 0.0473 | -0.0031 | ||||
| VYGR / Voyager Therapeutics, Inc. | 0.06 | 0.00 | 0.00 | 0.0445 | -0.0029 | ||||
| NUVB / Nuvation Bio Inc. | 0.02 | 0.00 | 0.00 | 0.0104 | 0.0011 | ||||
| ATAI / Atai Life Sciences N.V. | 0.01 | -14.50 | 0.00 | 0.0076 | 0.0022 | ||||
| MRSN / Mersana Therapeutics, Inc. | 0.01 | 0.00 | 0.00 | 0.0007 | 0.0000 | ||||
| ONTO / Onto Innovation Inc. | 0.00 | -100.00 | 0.00 | 0.0000 | |||||
| MTB / M&T Bank Corporation | 0.00 | -100.00 | 0.00 | 0.0000 | |||||
| BMY / Bristol-Myers Squibb Company | 0.00 | -100.00 | 0.00 | 0.0000 | |||||
| DIS / The Walt Disney Company | 0.00 | -100.00 | 0.00 | 0.0000 |