Statistik Asas
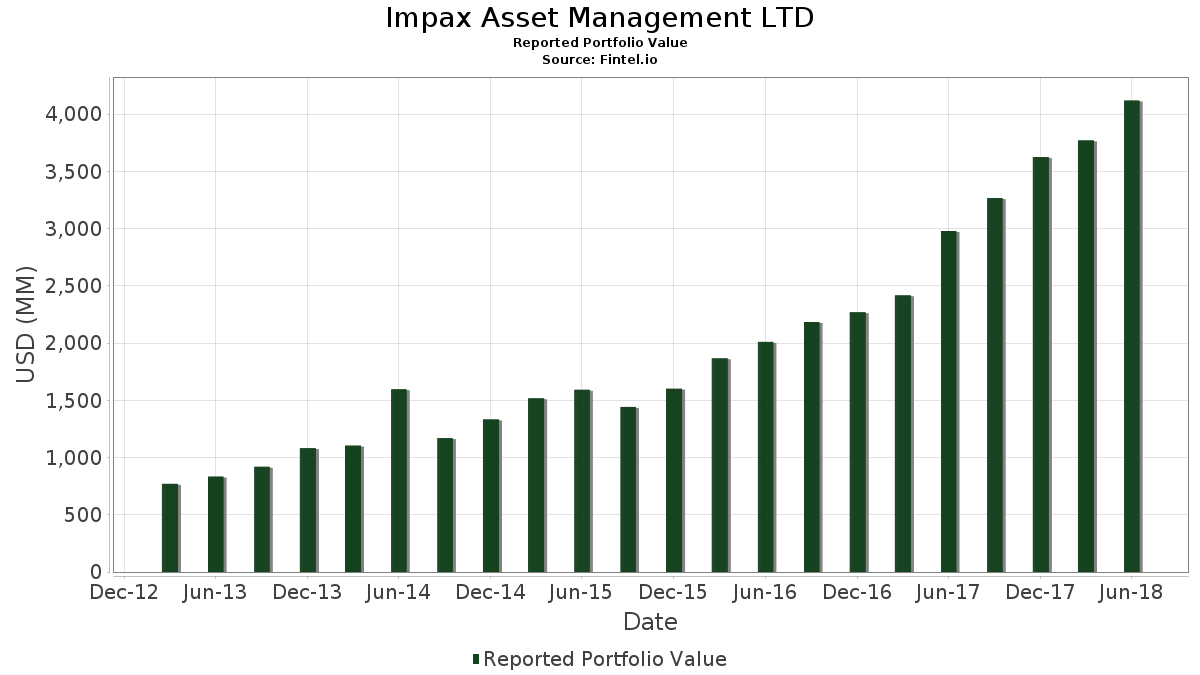
| Nilai Portfolio | $ 4,117,314,000 |
| Kedudukan Semasa | 65 |
Pegangan Terkini, Prestasi, AUM (dari 13F, 13D)
Impax Asset Management LTD telah mendedahkan 65 jumlah pegangan dalam pemfailan SEC terkini mereka. Nilai portfolio terkini dikira sebagai $ 4,117,314,000 USD. Aset Sebenar Di Bawah Pengurusan (AUM) ialah nilai ini ditambah dengan tunai (yang tidak didedahkan). Pegangan teratas Impax Asset Management LTD ialah Danaher Corporation (US:DHR) , Ecolab Inc. (US:ECL) , American Water Works Company, Inc. (US:AWK) , Xylem Inc. (US:XYL) , and Agilent Technologies, Inc. (US:A) . Kedudukan baharu Impax Asset Management LTD termasuk Johnson Controls International plc (US:JCI) , Ichor Holdings, Ltd. (US:ICHR) , Visa Inc. (US:V) , HDFC Bank Limited - Depositary Receipt (Common Stock) (US:HDB) , and Becton, Dickinson and Company (US:BDX) .
Kenaikan Teratas Suku Tahun Ini
Kami menggunakan perubahan dalam peruntukan portfolio kerana ini adalah metrik yang paling bermakna. Perubahan boleh disebabkan oleh perdagangan atau perubahan dalam harga saham.
| Sekuriti | Saham (MM) |
Nilai (MM$) |
Portfolio % | ΔPortfolio % |
|---|---|---|---|---|
| 3.88 | 110.74 | 2.6896 | 2.6896 | |
| 1.04 | 98.02 | 2.3806 | 2.3806 | |
| 14.21 | 85.38 | 2.0737 | 2.0737 | |
| 0.45 | 70.55 | 1.7134 | 1.7134 | |
| 0.73 | 65.72 | 1.5962 | 1.5962 | |
| 2.90 | 64.76 | 1.5729 | 1.5729 | |
| 0.27 | 51.66 | 1.2548 | 1.2548 | |
| 0.38 | 50.45 | 1.2252 | 1.2252 | |
| 2.13 | 42.31 | 1.0277 | 1.0277 | |
| 1.04 | 40.27 | 0.9780 | 0.9780 |
Penurunan Teratas Suku Tahun Ini
Kami menggunakan perubahan dalam peruntukan portfolio kerana ini adalah metrik yang paling bermakna. Perubahan boleh disebabkan oleh perdagangan atau perubahan dalam harga saham.
| Sekuriti | Saham (MM) |
Nilai (MM$) |
Portfolio % | ΔPortfolio % |
|---|---|---|---|---|
| 2.90 | 195.59 | 4.7504 | -0.8084 | |
| 2.13 | 166.77 | 4.0506 | -0.6101 | |
| 2.09 | 206.15 | 5.0069 | -0.5656 | |
| 0.52 | 60.53 | 1.4702 | -0.4865 | |
| 0.91 | 66.12 | 1.6060 | -0.3968 | |
| 1.43 | 200.00 | 4.8576 | -0.3829 | |
| 1.06 | 145.28 | 3.5284 | -0.3823 | |
| 1.42 | 80.99 | 1.9670 | -0.2890 | |
| 2.67 | 113.20 | 2.7495 | -0.2250 | |
| 0.35 | 16.91 | 0.4106 | -0.1886 |
13F dan Pemfailan Dana
Borang ini telah difailkan pada 2018-08-14 untuk tempoh pelaporan 2018-06-30. Klik ikon pautan untuk melihat sejarah transaksi penuh.
Tingkatkan untuk membuka data premium dan eksport ke Excel ![]() .
.
| Sekuriti | Jenis | Purata Harga Saham | Saham (MM) |
ΔSaham (%) |
ΔSaham (%) |
Nilai ($MM) |
Portfolio (%) |
ΔPortfolio (%) |
|
|---|---|---|---|---|---|---|---|---|---|
| DHR / Danaher Corporation | 2.09 | -2.61 | 206.15 | -1.85 | 5.0069 | -0.5656 | |||
| ECL / Ecolab Inc. | 1.43 | -1.09 | 200.00 | 1.26 | 4.8576 | -0.3829 | |||
| AWK / American Water Works Company, Inc. | 2.32 | 2.36 | 198.27 | 6.41 | 4.8155 | -0.1283 | |||
| XYL / Xylem Inc. | 2.90 | 6.57 | 195.59 | -6.65 | 4.7504 | -0.8084 | |||
| A / Agilent Technologies, Inc. | 2.71 | 14.17 | 167.56 | 5.53 | 4.0697 | -0.1429 | |||
| WTS / Watts Water Technologies, Inc. | 2.13 | -5.91 | 166.77 | -5.06 | 4.0506 | -0.6101 | |||
| TRMB / Trimble Inc. | 4.63 | 19.07 | 152.01 | 8.98 | 3.6921 | -0.0089 | |||
| IEX / IDEX Corporation | 1.06 | 2.92 | 145.28 | -1.44 | 3.5284 | -0.3823 | |||
| AOS / A. O. Smith Corporation | 2.28 | 14.87 | 134.57 | 6.84 | 3.2684 | -0.0733 | |||
| ITRI / Itron, Inc. | 1.91 | 32.51 | 114.82 | 11.21 | 2.7888 | 0.0495 | |||
| SEE / Sealed Air Corporation | 2.67 | 1.79 | 113.20 | 0.98 | 2.7495 | -0.2250 | |||
| WMS / Advanced Drainage Systems, Inc. | 3.88 | -9.84 | 110.74 | -0.61 | 2.6896 | 2.6896 | |||
| FELE / Franklin Electric Co., Inc. | 2.32 | 3.61 | 104.57 | 14.67 | 2.5398 | 0.1202 | |||
| PTC / PTC Inc. | 1.04 | -12.88 | 98.02 | 4.77 | 2.3806 | 2.3806 | |||
| RXN / Rexnord Corp | 3.14 | 4.40 | 91.33 | 2.22 | 2.2183 | -0.1524 | |||
| VMI / Valmont Industries, Inc. | 0.60 | 9.88 | 90.56 | 13.22 | 2.1995 | 0.0773 | |||
| SBS / Companhia de Saneamento Básico do Estado de São Paulo - SABESP - Depositary Receipt (Common Stock) | 14.21 | 61.24 | 85.38 | -8.49 | 2.0737 | 2.0737 | |||
| MWA / Mueller Water Products, Inc. | 7.24 | 4.75 | 84.83 | 12.94 | 2.0604 | 0.0675 | |||
| WRK / WestRock Company | 1.42 | 7.19 | 80.99 | -4.75 | 1.9670 | -0.2890 | |||
| WTRG / Essential Utilities, Inc. | 2.12 | 0.31 | 74.55 | 3.61 | 1.8106 | -0.0985 | |||
| LNN / Lindsay Corporation | 0.73 | 15.70 | 71.13 | 22.73 | 1.7276 | 0.1898 | |||
| PKI / Revvity Inc. | 0.97 | 3.45 | 71.00 | 0.05 | 1.7244 | -0.1585 | |||
| 74005P104 / Praxair, Inc. | 0.45 | -0.67 | 70.55 | 8.86 | 1.7134 | 1.7134 | |||
| POWI / Power Integrations, Inc. | 0.91 | -18.04 | 66.12 | -12.40 | 1.6060 | -0.3968 | |||
| IR / Ingersoll Rand Inc. | 0.73 | 65.72 | 1.5962 | 1.5962 | |||||
| WBT / Welbilt Inc | 2.90 | 9.26 | 64.76 | 25.32 | 1.5729 | 1.5729 | |||
| BMI / Badger Meter, Inc. | 1.39 | 15.55 | 62.34 | 9.55 | 1.5141 | 0.0042 | |||
| AYI / Acuity Inc. | 0.52 | -1.40 | 60.53 | -17.92 | 1.4702 | -0.4865 | |||
| POOL / Pool Corporation | 0.39 | -0.47 | 59.49 | 3.12 | 1.4449 | -0.0858 | |||
| WM / Waste Management, Inc. | 0.71 | 9.00 | 57.65 | 5.40 | 1.4003 | -0.0510 | |||
| TTC / The Toro Company | 0.92 | 25.26 | 55.35 | 20.85 | 1.3443 | 0.1291 | |||
| HUBB / Hubbell Incorporated | 0.50 | 25.58 | 53.30 | 9.04 | 1.2947 | -0.0024 | |||
| WAT / Waters Corporation | 0.27 | 9.70 | 51.66 | 6.91 | 1.2548 | 1.2548 | |||
| ADSK / Autodesk, Inc. | 0.38 | -8.14 | 50.45 | -4.10 | 1.2252 | 1.2252 | |||
| GNRC / Generac Holdings Inc. | 0.94 | -8.86 | 48.57 | 2.69 | 1.1797 | -0.0752 | |||
| ORA / Ormat Technologies, Inc. | 0.88 | 26.32 | 46.94 | 19.17 | 1.1400 | 0.0950 | |||
| DAR / Darling Ingredients Inc. | 2.13 | 6.81 | 42.31 | 22.73 | 1.0277 | 1.0277 | |||
| RYN / Rayonier Inc. | 1.04 | -21.33 | 40.27 | -13.49 | 0.9780 | 0.9780 | |||
| FLOW / Global X Funds - Global X U.S. Cash Flow Kings 100 ETF | 0.83 | 36.28 | 0.8811 | 0.8811 | |||||
| ST / Sensata Technologies Holding plc | 0.76 | 36.18 | 0.8787 | 0.8787 | |||||
| LII / Lennox International Inc. | 0.17 | 3.62 | 34.99 | 1.48 | 0.8499 | 0.8499 | |||
| FLS / Flowserve Corporation | 0.85 | 34.51 | 0.8381 | 0.8381 | |||||
| UNFI / United Natural Foods, Inc. | 0.77 | 0.40 | 32.65 | -0.26 | 0.7929 | 0.7929 | |||
| MMM / 3M Company | 0.16 | 31.77 | 0.7716 | 0.7716 | |||||
| SON / Sonoco Products Company | 0.49 | 0.00 | 25.71 | 8.25 | 0.6244 | 0.6244 | |||
| FTV / Fortive Corporation | 0.32 | 0.20 | 24.50 | -0.33 | 0.5951 | 0.5951 | |||
| SFM / Sprouts Farmers Market, Inc. | 1.06 | 2.15 | 23.50 | -3.95 | 0.5709 | 0.5709 | |||
| SPWR / Complete Solaria, Inc. | 2.97 | -4.36 | 22.76 | -8.07 | 0.5528 | -0.1041 | |||
| CLH / Clean Harbors, Inc. | 0.36 | 1.39 | 20.22 | 15.39 | 0.4911 | 0.0262 | |||
| BWA / BorgWarner Inc. | 0.42 | 2.77 | 18.23 | -11.70 | 0.4427 | -0.1050 | |||
| CPB / The Campbell's Company | 0.44 | -6.34 | 17.95 | -12.33 | 0.4361 | 0.4361 | |||
| JCI / Johnson Controls International plc | 0.51 | 17.16 | 0.4168 | 0.4168 | |||||
| SBUX / Starbucks Corporation | 0.35 | -11.28 | 16.91 | -25.14 | 0.4106 | -0.1886 | |||
| BMS / Bemis Co., Inc. | 0.38 | 0.00 | 16.12 | -3.01 | 0.3916 | 0.3916 | |||
| DCI / Donaldson Company, Inc. | 0.33 | 16.72 | 14.82 | 16.90 | 0.3599 | 0.0236 | |||
| AGCO / AGCO Corporation | 0.24 | 14.57 | 0.3539 | 0.3539 | |||||
| MSEX / Middlesex Water Company | 0.26 | 0.00 | 10.94 | 14.91 | 0.2658 | 0.2658 | |||
| ICHR / Ichor Holdings, Ltd. | 0.36 | 7.72 | 0.1875 | 0.1875 | |||||
| V / Visa Inc. | 0.01 | 1.50 | 0.0366 | 0.0366 | |||||
| HDB / HDFC Bank Limited - Depositary Receipt (Common Stock) | 0.01 | 1.11 | 0.0270 | 0.0270 | |||||
| TMO / Thermo Fisher Scientific Inc. | 0.01 | 1.05 | 0.0256 | 0.0256 | |||||
| BDX / Becton, Dickinson and Company | 0.00 | 0.91 | 0.0221 | 0.0221 | |||||
| CDNS / Cadence Design Systems, Inc. | 0.02 | 0.67 | 0.0163 | 0.0163 | |||||
| CTSH / Cognizant Technology Solutions Corporation | 0.01 | 0.60 | 0.0147 | 0.0147 | |||||
| ORCL / Oracle Corporation | 0.01 | 0.59 | 0.0144 | 0.0144 |