Statistik Asas
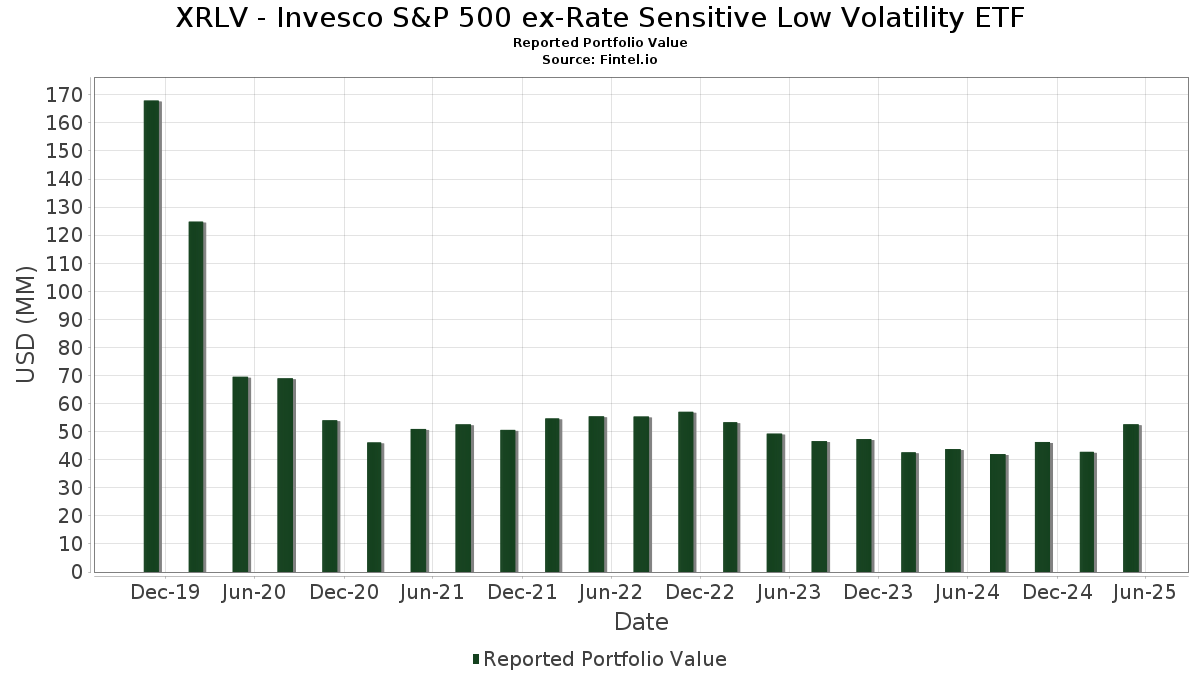
| Nilai Portfolio | $ 52,625,637 |
| Kedudukan Semasa | 104 |
Pegangan Terkini, Prestasi, AUM (dari 13F, 13D)
XRLV - Invesco S&P 500 ex-Rate Sensitive Low Volatility ETF telah mendedahkan 104 jumlah pegangan dalam pemfailan SEC terkini mereka. Nilai portfolio terkini dikira sebagai $ 52,625,637 USD. Aset Sebenar Di Bawah Pengurusan (AUM) ialah nilai ini ditambah dengan tunai (yang tidak didedahkan). Pegangan teratas XRLV - Invesco S&P 500 ex-Rate Sensitive Low Volatility ETF ialah The Coca-Cola Company (US:KO) , Evergy, Inc. (US:EVRG) , Marsh & McLennan Companies, Inc. (US:MMC) , CME Group Inc. (US:CME) , and Republic Services, Inc. (US:RSG) . Kedudukan baharu XRLV - Invesco S&P 500 ex-Rate Sensitive Low Volatility ETF termasuk Ventas, Inc. (US:VTR) , Otis Worldwide Corporation (US:OTIS) , .
Kenaikan Teratas Suku Tahun Ini
Kami menggunakan perubahan dalam peruntukan portfolio kerana ini adalah metrik yang paling bermakna. Perubahan boleh disebabkan oleh perdagangan atau perubahan dalam harga saham.
| Sekuriti | Saham (MM) |
Nilai (MM$) |
Portfolio % | ΔPortfolio % |
|---|---|---|---|---|
| 2.53 | 2.53 | 5.5490 | 5.5490 | |
| 2.53 | 2.53 | 5.5490 | 5.5490 | |
| 0.98 | 0.98 | 2.1414 | 2.1414 | |
| 0.98 | 0.98 | 2.1414 | 2.1414 | |
| 0.00 | 0.46 | 0.9982 | 0.9982 | |
| 0.00 | 0.44 | 0.9569 | 0.9569 | |
| 0.00 | 0.43 | 0.9365 | 0.9365 | |
| 0.01 | 0.42 | 0.9194 | 0.9194 | |
| 0.00 | 0.42 | 0.9119 | 0.9119 | |
| 0.01 | 0.41 | 0.9003 | 0.9003 |
Penurunan Teratas Suku Tahun Ini
Kami menggunakan perubahan dalam peruntukan portfolio kerana ini adalah metrik yang paling bermakna. Perubahan boleh disebabkan oleh perdagangan atau perubahan dalam harga saham.
| Sekuriti | Saham (MM) |
Nilai (MM$) |
Portfolio % | ΔPortfolio % |
|---|---|---|---|---|
| 0.00 | 0.40 | 0.8689 | -0.2437 | |
| 0.00 | 0.48 | 1.0457 | -0.2311 | |
| 0.00 | 0.44 | 0.9531 | -0.1743 | |
| 0.01 | 0.42 | 0.9230 | -0.1412 | |
| 0.01 | 0.43 | 0.9423 | -0.1250 | |
| 0.00 | 0.44 | 0.9702 | -0.1162 | |
| 0.00 | 0.55 | 1.2010 | -0.1032 | |
| 0.01 | 0.47 | 1.0304 | -0.0891 | |
| 0.01 | 0.38 | 0.8401 | -0.0837 | |
| 0.01 | 0.56 | 1.2347 | -0.0836 |
13F dan Pemfailan Dana
Borang ini telah difailkan pada 2025-07-28 untuk tempoh pelaporan 2025-05-31. Klik ikon pautan untuk melihat sejarah transaksi penuh.
Tingkatkan untuk membuka data premium dan eksport ke Excel ![]() .
.
| Sekuriti | Jenis | Purata Harga Saham | Saham (MM) |
ΔSaham (%) |
ΔSaham (%) |
Nilai ($MM) |
Portfolio (%) |
ΔPortfolio (%) |
|
|---|---|---|---|---|---|---|---|---|---|
| Invesco Private Prime Fund / STIV (N/A) | 2.53 | 2.53 | 5.5490 | 5.5490 | |||||
| Invesco Private Prime Fund / STIV (N/A) | 2.53 | 2.53 | 5.5490 | 5.5490 | |||||
| Invesco Private Government Fund / STIV (N/A) | 0.98 | 0.98 | 2.1414 | 2.1414 | |||||
| Invesco Private Government Fund / STIV (N/A) | 0.98 | 0.98 | 2.1414 | 2.1414 | |||||
| KO / The Coca-Cola Company | 0.01 | 3.87 | 0.56 | 5.23 | 1.2347 | -0.0836 | |||
| EVRG / Evergy, Inc. | 0.01 | 23.70 | 0.56 | 19.06 | 1.2203 | 0.0709 | |||
| MMC / Marsh & McLennan Companies, Inc. | 0.00 | 5.25 | 0.55 | 3.40 | 1.2010 | -0.1032 | |||
| CME / CME Group Inc. | 0.00 | 8.52 | 0.53 | 23.67 | 1.1689 | 0.1069 | |||
| RSG / Republic Services, Inc. | 0.00 | -1.48 | 0.53 | 6.87 | 1.1607 | -0.0580 | |||
| WEC / WEC Energy Group, Inc. | 0.00 | 22.79 | 0.53 | 23.53 | 1.1516 | 0.1059 | |||
| ATO / Atmos Energy Corporation | 0.00 | 9.62 | 0.53 | 11.46 | 1.1509 | -0.0086 | |||
| KMB / Kimberly-Clark Corporation | 0.00 | 21.81 | 0.52 | 23.29 | 1.1487 | 0.1027 | |||
| PG / The Procter & Gamble Company | 0.00 | 12.76 | 0.52 | 10.11 | 1.1480 | -0.0218 | |||
| CMS / CMS Energy Corporation | 0.01 | 19.29 | 0.52 | 14.92 | 1.1307 | 0.0236 | |||
| ADP / Automatic Data Processing, Inc. | 0.00 | 6.82 | 0.51 | 10.30 | 1.1283 | -0.0201 | |||
| CHD / Church & Dwight Co., Inc. | 0.01 | 33.34 | 0.51 | 17.89 | 1.1267 | 0.0535 | |||
| LIN / Linde plc | 0.00 | 5.92 | 0.51 | 6.03 | 1.1177 | -0.0658 | |||
| PNW / Pinnacle West Capital Corporation | 0.01 | 27.49 | 0.51 | 25.68 | 1.1160 | 0.1190 | |||
| DUK / Duke Energy Corporation | 0.00 | 18.49 | 0.51 | 18.69 | 1.1140 | 0.0604 | |||
| PPL / PPL Corporation | 0.01 | 17.07 | 0.50 | 15.60 | 1.1047 | 0.0311 | |||
| ICE / Intercontinental Exchange, Inc. | 0.00 | 10.73 | 0.50 | 14.94 | 1.0975 | 0.0252 | |||
| O / Realty Income Corporation | 0.01 | 19.21 | 0.50 | 18.33 | 1.0899 | 0.0559 | |||
| LNT / Alliant Energy Corporation | 0.01 | 24.17 | 0.49 | 19.66 | 1.0822 | 0.0674 | |||
| SO / The Southern Company | 0.01 | 20.78 | 0.49 | 21.13 | 1.0818 | 0.0784 | |||
| NI / NiSource Inc. | 0.01 | 11.44 | 0.49 | 7.96 | 1.0705 | -0.0427 | |||
| DTE / DTE Energy Company | 0.00 | 16.33 | 0.49 | 18.83 | 1.0665 | 0.0593 | |||
| KDP / Keurig Dr Pepper Inc. | 0.01 | 14.86 | 0.49 | 15.44 | 1.0664 | 0.0285 | |||
| MO / Altria Group, Inc. | 0.01 | 14.84 | 0.48 | 24.48 | 1.0604 | 0.1050 | |||
| TJX / The TJX Companies, Inc. | 0.00 | 14.48 | 0.48 | 16.39 | 1.0596 | 0.0378 | |||
| LHX / L3Harris Technologies, Inc. | 0.00 | 9.28 | 0.48 | 29.62 | 1.0466 | 0.1394 | |||
| JNJ / Johnson & Johnson | 0.00 | 10.60 | 0.48 | 3.92 | 1.0464 | -0.0831 | |||
| BRK.B / Berkshire Hathaway Inc. | 0.00 | -6.24 | 0.48 | -7.92 | 1.0457 | -0.2311 | |||
| AEE / Ameren Corporation | 0.00 | 21.08 | 0.48 | 15.53 | 1.0450 | 0.0290 | |||
| WTW / Willis Towers Watson Public Limited Company | 0.00 | 21.47 | 0.48 | 13.33 | 1.0438 | 0.0085 | |||
| HOLX / Hologic, Inc. | 0.01 | 22.62 | 0.47 | 20.30 | 1.0388 | 0.0689 | |||
| PEP / PepsiCo, Inc. | 0.00 | 26.77 | 0.47 | 8.53 | 1.0339 | -0.0353 | |||
| WM / Waste Management, Inc. | 0.00 | 21.61 | 0.47 | 25.94 | 1.0338 | 0.1117 | |||
| CL / Colgate-Palmolive Company | 0.01 | 1.38 | 0.47 | 3.30 | 1.0304 | -0.0891 | |||
| AEP / American Electric Power Company, Inc. | 0.00 | 23.50 | 0.47 | 20.36 | 1.0249 | 0.0700 | |||
| REG / Regency Centers Corporation | 0.01 | 20.14 | 0.47 | 13.08 | 1.0233 | 0.0065 | |||
| ECL / Ecolab Inc. | 0.00 | 26.68 | 0.47 | 24.93 | 1.0225 | 0.1046 | |||
| JKHY / Jack Henry & Associates, Inc. | 0.00 | 8.41 | 0.46 | 13.24 | 1.0126 | 0.0077 | |||
| VICI / VICI Properties Inc. | 0.01 | 19.70 | 0.46 | 16.71 | 1.0121 | 0.0393 | |||
| XEL / Xcel Energy Inc. | 0.01 | 0.99 | 0.46 | 34.21 | 1.0072 | 0.1790 | |||
| ED / Consolidated Edison, Inc. | 0.00 | 3.31 | 0.46 | 6.25 | 1.0069 | -0.0564 | |||
| COR / Cencora, Inc. | 0.00 | 0.19 | 0.46 | 15.04 | 1.0063 | 0.0245 | |||
| MA / Mastercard Incorporated | 0.00 | 4.83 | 0.46 | 6.53 | 1.0021 | -0.0542 | |||
| STE / STERIS plc | 0.00 | 0.46 | 0.9982 | 0.9982 | |||||
| EXC / Exelon Corporation | 0.01 | 16.96 | 0.46 | 16.07 | 0.9973 | 0.0315 | |||
| BDX / Becton, Dickinson and Company | 0.00 | 50.23 | 0.45 | 14.97 | 0.9941 | 0.0231 | |||
| MCD / McDonald's Corporation | 0.00 | 12.55 | 0.45 | 14.68 | 0.9930 | 0.0197 | |||
| WELL / Welltower Inc. | 0.00 | 15.75 | 0.45 | 16.58 | 0.9864 | 0.0343 | |||
| CB / Chubb Limited | 0.00 | 3.14 | 0.45 | 7.43 | 0.9833 | -0.0450 | |||
| FE / FirstEnergy Corp. | 0.01 | -3.81 | 0.45 | 3.95 | 0.9814 | -0.0777 | |||
| ABT / Abbott Laboratories | 0.00 | 18.77 | 0.45 | 14.91 | 0.9813 | 0.0228 | |||
| ORLY / O'Reilly Automotive, Inc. | 0.00 | 16.79 | 0.45 | 16.41 | 0.9798 | 0.0335 | |||
| BR / Broadridge Financial Solutions, Inc. | 0.00 | 16.20 | 0.45 | 16.80 | 0.9768 | 0.0392 | |||
| AVY / Avery Dennison Corporation | 0.00 | 21.21 | 0.44 | 14.43 | 0.9747 | 0.0197 | |||
| MDLZ / Mondelez International, Inc. | 0.01 | 1.65 | 0.44 | 6.99 | 0.9733 | -0.0499 | |||
| AON / Aon plc | 0.00 | 28.17 | 0.44 | 16.58 | 0.9718 | 0.0357 | |||
| BRO / Brown & Brown, Inc. | 0.00 | 5.29 | 0.44 | 0.23 | 0.9702 | -0.1162 | |||
| V / Visa Inc. | 0.00 | 2.98 | 0.44 | 3.52 | 0.9682 | -0.0804 | |||
| L / Loews Corporation | 0.00 | 1.52 | 0.44 | 4.50 | 0.9676 | -0.0712 | |||
| AJG / Arthur J. Gallagher & Co. | 0.00 | 2.92 | 0.44 | 5.77 | 0.9660 | -0.0585 | |||
| FDS / FactSet Research Systems Inc. | 0.00 | 0.44 | 0.9569 | 0.9569 | |||||
| GD / General Dynamics Corporation | 0.00 | 0.51 | 0.44 | 10.94 | 0.9555 | -0.0127 | |||
| ITW / Illinois Tool Works Inc. | 0.00 | 2.25 | 0.44 | -5.02 | 0.9531 | -0.1743 | |||
| SYY / Sysco Corporation | 0.01 | 13.40 | 0.44 | 9.85 | 0.9531 | -0.0235 | |||
| COST / Costco Wholesale Corporation | 0.00 | 19.83 | 0.43 | 18.96 | 0.9504 | 0.0526 | |||
| MDT / Medtronic plc | 0.01 | 26.17 | 0.43 | 13.95 | 0.9494 | 0.0124 | |||
| AZO / AutoZone, Inc. | 0.00 | -22.15 | 0.43 | 11.60 | 0.9488 | 0.0962 | |||
| CNP / CenterPoint Energy, Inc. | 0.01 | -10.07 | 0.43 | 9.64 | 0.9480 | -0.0146 | |||
| AVB / AvalonBay Communities, Inc. | 0.00 | 19.67 | 0.43 | 9.39 | 0.9455 | -0.0250 | |||
| TSN / Tyson Foods, Inc. | 0.01 | -23.17 | 0.43 | -14.68 | 0.9423 | -0.1250 | |||
| VRSK / Verisk Analytics, Inc. | 0.00 | 11.49 | 0.43 | 17.86 | 0.9416 | 0.0453 | |||
| ROP / Roper Technologies, Inc. | 0.00 | 13.10 | 0.43 | 10.31 | 0.9383 | -0.0165 | |||
| PAYX / Paychex, Inc. | 0.00 | 6.57 | 0.43 | 10.91 | 0.9366 | -0.0112 | |||
| GWW / W.W. Grainger, Inc. | 0.00 | 0.43 | 0.9365 | 0.9365 | |||||
| MSI / Motorola Solutions, Inc. | 0.00 | 19.81 | 0.43 | 13.26 | 0.9356 | 0.0063 | |||
| CAH / Cardinal Health, Inc. | 0.00 | -30.36 | 0.43 | 0.47 | 0.9339 | 0.0035 | |||
| UNP / Union Pacific Corporation | 0.00 | 34.01 | 0.42 | 20.51 | 0.9281 | 0.0626 | |||
| GIS / General Mills, Inc. | 0.01 | 24.26 | 0.42 | 11.05 | 0.9262 | -0.0089 | |||
| PEG / Public Service Enterprise Group Incorporated | 0.01 | 8.45 | 0.42 | -6.86 | 0.9230 | -0.1412 | |||
| ROL / Rollins, Inc. | 0.01 | 0.42 | 0.9194 | 0.9194 | |||||
| BSX / Boston Scientific Corporation | 0.00 | 3.41 | 0.42 | 5.03 | 0.9165 | -0.0648 | |||
| CPT / Camden Property Trust | 0.00 | -22.16 | 0.42 | -23.91 | 0.9141 | -0.0475 | |||
| MAA / Mid-America Apartment Communities, Inc. | 0.00 | 0.42 | 0.9119 | 0.9119 | |||||
| SYK / Stryker Corporation | 0.00 | 15.15 | 0.42 | 14.01 | 0.9113 | 0.0144 | |||
| LMT / Lockheed Martin Corporation | 0.00 | 5.78 | 0.41 | 13.11 | 0.9089 | 0.0081 | |||
| VZ / Verizon Communications Inc. | 0.01 | 7.12 | 0.41 | 9.31 | 0.9024 | -0.0250 | |||
| AFL / Aflac Incorporated | 0.00 | 10.65 | 0.41 | 3.80 | 0.9004 | -0.0675 | |||
| MKC / McCormick & Company, Incorporated | 0.01 | 0.41 | 0.9003 | 0.9003 | |||||
| FRT / Federal Realty Investment Trust | 0.00 | 24.18 | 0.41 | 12.64 | 0.8991 | 0.0015 | |||
| CLX / The Clorox Company | 0.00 | 31.49 | 0.41 | 10.81 | 0.8989 | -0.0114 | |||
| DGX / Quest Diagnostics Incorporated | 0.00 | -1.71 | 0.41 | 8.80 | 0.8940 | -0.0251 | |||
| VTR / Ventas, Inc. | 0.01 | 0.41 | 0.8923 | 0.8923 | |||||
| OTIS / Otis Worldwide Corporation | 0.00 | 0.41 | 0.8923 | 0.8923 | |||||
| EQR / Equity Residential | 0.01 | -27.86 | 0.41 | -22.07 | 0.8909 | -0.0221 | |||
| UDR / UDR, Inc. | 0.01 | 14.20 | 0.40 | 4.94 | 0.8854 | -0.0640 | |||
| INVH / Invitation Homes Inc. | 0.01 | 6.93 | 0.40 | 6.07 | 0.8812 | -0.0527 | |||
| CBOE / Cboe Global Markets, Inc. | 0.00 | 0.98 | 0.40 | 12.68 | 0.8765 | 0.0082 | |||
| VRSN / VeriSign, Inc. | 0.00 | -9.88 | 0.40 | 3.12 | 0.8716 | -0.0765 | |||
| YUM / Yum! Brands, Inc. | 0.00 | -4.74 | 0.40 | -12.39 | 0.8689 | -0.2437 | |||
| KHC / The Kraft Heinz Company | 0.01 | 17.32 | 0.38 | 2.13 | 0.8401 | -0.0837 |