Statistik Asas
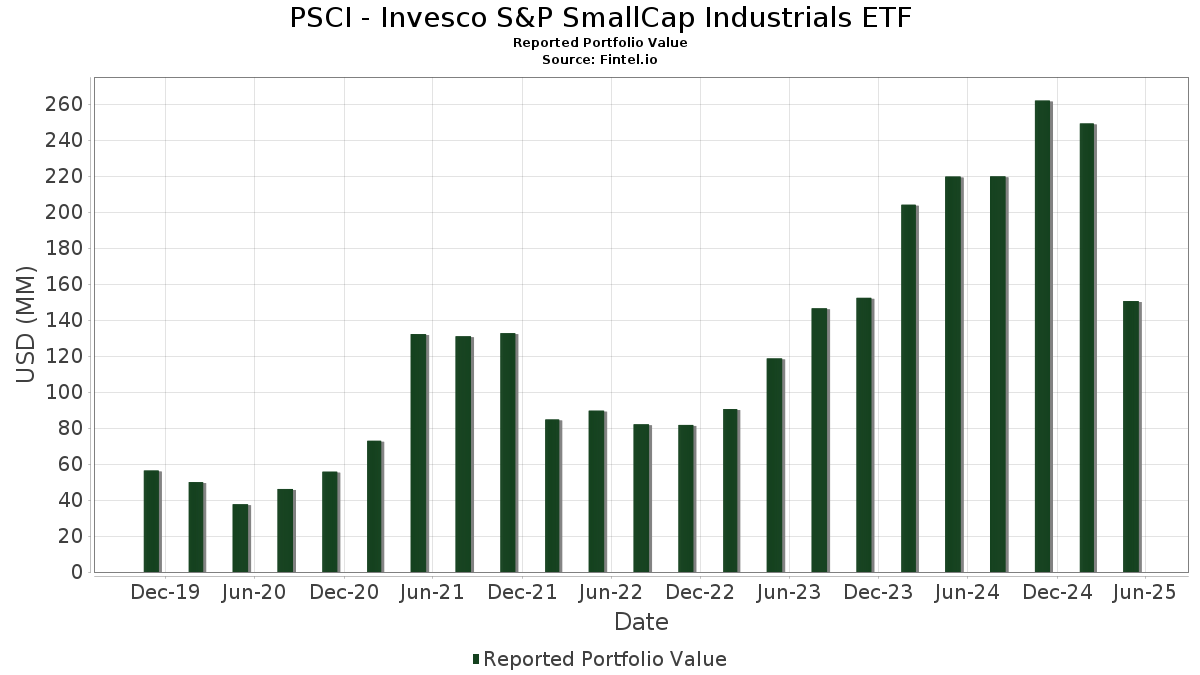
| Nilai Portfolio | $ 150,587,778 |
| Kedudukan Semasa | 99 |
Pegangan Terkini, Prestasi, AUM (dari 13F, 13D)
PSCI - Invesco S&P SmallCap Industrials ETF telah mendedahkan 99 jumlah pegangan dalam pemfailan SEC terkini mereka. Nilai portfolio terkini dikira sebagai $ 150,587,778 USD. Aset Sebenar Di Bawah Pengurusan (AUM) ialah nilai ini ditambah dengan tunai (yang tidak didedahkan). Pegangan teratas PSCI - Invesco S&P SmallCap Industrials ETF ialah SPX Technologies, Inc. (US:SPXC) , Armstrong World Industries, Inc. (US:AWI) , Dycom Industries, Inc. (US:DY) , Air Lease Corporation (US:AL) , and Sterling Infrastructure, Inc. (IT:1STRL) . Kedudukan baharu PSCI - Invesco S&P SmallCap Industrials ETF termasuk Sterling Infrastructure, Inc. (IT:1STRL) , Kratos Defense & Security Solutions, Inc. (US:KTOS) , WillScot Holdings Corporation (US:WSC) , Mueller Water Products, Inc. (US:MWA) , and .
Kenaikan Teratas Suku Tahun Ini
Kami menggunakan perubahan dalam peruntukan portfolio kerana ini adalah metrik yang paling bermakna. Perubahan boleh disebabkan oleh perdagangan atau perubahan dalam harga saham.
| Sekuriti | Saham (MM) |
Nilai (MM$) |
Portfolio % | ΔPortfolio % |
|---|---|---|---|---|
| 17.71 | 17.71 | 14.0165 | 14.0165 | |
| 6.61 | 6.61 | 5.2292 | 5.2292 | |
| 0.02 | 3.01 | 2.3817 | 2.3817 | |
| 0.08 | 2.94 | 2.3251 | 2.3251 | |
| 0.10 | 2.59 | 2.0537 | 2.0537 | |
| 0.08 | 2.00 | 1.5847 | 1.5847 | |
| 0.02 | 3.49 | 2.7663 | 0.7526 | |
| 0.05 | 3.11 | 2.4607 | 0.3594 | |
| 0.03 | 1.54 | 1.2193 | 0.3240 | |
| 0.01 | 2.60 | 2.0565 | 0.2871 |
Penurunan Teratas Suku Tahun Ini
Kami menggunakan perubahan dalam peruntukan portfolio kerana ini adalah metrik yang paling bermakna. Perubahan boleh disebabkan oleh perdagangan atau perubahan dalam harga saham.
| Sekuriti | Saham (MM) |
Nilai (MM$) |
Portfolio % | ΔPortfolio % |
|---|---|---|---|---|
| 0.05 | 2.40 | 1.8972 | -0.6406 | |
| 0.02 | 1.95 | 1.5454 | -0.4749 | |
| 0.02 | 2.76 | 2.1860 | -0.4133 | |
| 0.01 | 1.92 | 1.5207 | -0.3365 | |
| 0.00 | 0.00 | -0.3220 | ||
| 0.04 | 0.71 | 0.5654 | -0.3212 | |
| 0.02 | 1.74 | 1.3759 | -0.3051 | |
| 0.07 | 1.15 | 0.9079 | -0.3013 | |
| 0.02 | 1.77 | 1.3999 | -0.2947 | |
| 0.06 | 0.37 | 0.2901 | -0.2822 |
13F dan Pemfailan Dana
Borang ini telah difailkan pada 2025-07-28 untuk tempoh pelaporan 2025-05-31. Klik ikon pautan untuk melihat sejarah transaksi penuh.
Tingkatkan untuk membuka data premium dan eksport ke Excel ![]() .
.
| Sekuriti | Jenis | Purata Harga Saham | Saham (MM) |
ΔSaham (%) |
ΔSaham (%) |
Nilai ($MM) |
Portfolio (%) |
ΔPortfolio (%) |
|
|---|---|---|---|---|---|---|---|---|---|
| Invesco Private Prime Fund / STIV (N/A) | 17.71 | 17.71 | 14.0165 | 14.0165 | |||||
| Invesco Private Government Fund / STIV (N/A) | 6.61 | 6.61 | 5.2292 | 5.2292 | |||||
| SPXC / SPX Technologies, Inc. | 0.02 | -40.97 | 3.67 | -38.36 | 2.9083 | 0.0517 | |||
| AWI / Armstrong World Industries, Inc. | 0.02 | -40.99 | 3.53 | -40.23 | 2.7975 | -0.0364 | |||
| DY / Dycom Industries, Inc. | 0.02 | -40.72 | 3.49 | -16.83 | 2.7663 | 0.7526 | |||
| AL / Air Lease Corporation | 0.05 | -41.02 | 3.11 | -29.11 | 2.4607 | 0.3594 | |||
| 1STRL / Sterling Infrastructure, Inc. | 0.02 | 3.01 | 2.3817 | 2.3817 | |||||
| FSS / Federal Signal Corporation | 0.03 | -41.01 | 2.99 | -31.72 | 2.3703 | 0.2684 | |||
| KTOS / Kratos Defense & Security Solutions, Inc. | 0.08 | 2.94 | 2.3251 | 2.3251 | |||||
| JBTM / JBT Marel Corporation | 0.02 | -41.46 | 2.76 | -49.09 | 2.1860 | -0.4133 | |||
| MOGA / Moog, Inc. - Class A | 0.01 | -41.87 | 2.74 | -36.82 | 2.1667 | 0.0905 | |||
| ZWS / Zurn Elkay Water Solutions Corporation | 0.07 | -40.76 | 2.69 | -39.48 | 2.1317 | -0.0011 | |||
| CSW / CSW Industrials, Inc. | 0.01 | -41.12 | 2.67 | -41.18 | 2.1170 | -0.0620 | |||
| AVAV / AeroVironment, Inc. | 0.01 | -40.86 | 2.60 | -29.64 | 2.0565 | 0.2871 | |||
| WSC / WillScot Holdings Corporation | 0.10 | 2.59 | 2.0537 | 2.0537 | |||||
| GTES / Gates Industrial Corporation plc | 0.12 | -40.85 | 2.51 | -42.19 | 1.9830 | -0.0937 | |||
| ESE / ESCO Technologies Inc. | 0.01 | -40.73 | 2.44 | -34.86 | 1.9294 | 0.1365 | |||
| RHI / Robert Half Inc. | 0.05 | -41.59 | 2.40 | -54.75 | 1.8972 | -0.6406 | |||
| ACA / Arcosa, Inc. | 0.03 | -40.86 | 2.19 | -39.18 | 1.7356 | 0.0080 | |||
| SKYW / SkyWest, Inc. | 0.02 | -40.87 | 2.13 | -39.36 | 1.6871 | 0.0028 | |||
| VRRM / Verra Mobility Corporation | 0.09 | -40.88 | 2.03 | -38.91 | 1.6071 | 0.0142 | |||
| NPO / Enpro Inc. | 0.01 | -40.84 | 2.03 | -39.86 | 1.6034 | -0.0105 | |||
| GVA / Granite Construction Incorporated | 0.02 | -41.25 | 2.02 | -36.35 | 1.6022 | 0.0779 | |||
| MWA / Mueller Water Products, Inc. | 0.08 | 2.00 | 1.5847 | 1.5847 | |||||
| MATX / Matson, Inc. | 0.02 | -40.87 | 1.95 | -53.69 | 1.5454 | -0.4749 | |||
| GEO / The GEO Group, Inc. | 0.07 | -40.86 | 1.92 | -41.34 | 1.5234 | -0.0487 | |||
| KAI / Kadant Inc. | 0.01 | -40.86 | 1.92 | -50.43 | 1.5207 | -0.3365 | |||
| KFY / Korn Ferry | 0.03 | -41.34 | 1.83 | -39.23 | 1.4472 | 0.0054 | |||
| FELE / Franklin Electric Co., Inc. | 0.02 | -40.86 | 1.77 | -50.00 | 1.3999 | -0.2947 | |||
| BCC / Boise Cascade Company | 0.02 | -40.87 | 1.74 | -50.44 | 1.3759 | -0.3051 | |||
| ABM / ABM Industries Incorporated | 0.03 | -41.43 | 1.71 | -43.26 | 1.3504 | -0.0901 | |||
| RUSHA / Rush Enterprises, Inc. | 0.03 | -40.85 | 1.61 | -49.66 | 1.2766 | -0.2583 | |||
| BRC / Brady Corporation | 0.02 | -40.61 | 1.61 | -42.82 | 1.2729 | -0.0750 | |||
| REZI / Resideo Technologies, Inc. | 0.08 | -40.83 | 1.59 | -36.23 | 1.2555 | 0.0633 | |||
| AMTM / Amentum Holdings, Inc. | 0.07 | -31.57 | 1.55 | -28.04 | 1.2235 | 0.1945 | |||
| ECG / Everus Construction Group, Inc. | 0.03 | -40.77 | 1.54 | -17.56 | 1.2193 | 0.3240 | |||
| GMS / GMS Inc. | 0.02 | -41.57 | 1.53 | -44.43 | 1.2123 | -0.1082 | |||
| UNF / UniFirst Corporation | 0.01 | -40.89 | 1.47 | -48.14 | 1.1670 | -0.1953 | |||
| GFF / Griffon Corporation | 0.02 | -41.21 | 1.41 | -44.13 | 1.1188 | -0.0936 | |||
| AZZ / AZZ Inc. | 0.02 | -40.83 | 1.41 | -44.17 | 1.1181 | -0.0944 | |||
| MYRG / MYR Group Inc. | 0.01 | -40.70 | 1.32 | -24.21 | 1.0458 | 0.2103 | |||
| MRCY / Mercury Systems, Inc. | 0.03 | -40.79 | 1.30 | -34.34 | 1.0308 | 0.0803 | |||
| KAR / OPENLANE, Inc. | 0.06 | -40.72 | 1.28 | -39.07 | 1.0129 | 0.0069 | |||
| CXW / CoreCivic, Inc. | 0.06 | -41.05 | 1.26 | -31.01 | 0.9955 | 0.1220 | |||
| EPAC / Enerpac Tool Group Corp. | 0.03 | -40.57 | 1.22 | -44.95 | 0.9631 | -0.0957 | |||
| HNI / HNI Corporation | 0.02 | -40.78 | 1.16 | -40.88 | 0.9187 | -0.0217 | |||
| RXO / RXO, Inc. | 0.07 | -40.08 | 1.15 | -54.58 | 0.9079 | -0.3013 | |||
| AIR / AAR Corp. | 0.02 | -40.67 | 1.13 | -43.96 | 0.8963 | -0.0721 | |||
| TRN / Trinity Industries, Inc. | 0.04 | -40.78 | 1.10 | -50.98 | 0.8734 | -0.2052 | |||
| AIN / Albany International Corp. | 0.02 | -40.78 | 1.08 | -48.93 | 0.8541 | -0.1579 | |||
| ALG / Alamo Group Inc. | 0.01 | -40.68 | 1.07 | -32.90 | 0.8498 | 0.0834 | |||
| HUBG / Hub Group, Inc. | 0.03 | -40.71 | 1.07 | -51.39 | 0.8473 | -0.2077 | |||
| TGI / Triumph Group, Inc. | 0.04 | -40.61 | 1.04 | -39.68 | 0.8263 | -0.0027 | |||
| HAYW / Hayward Holdings, Inc. | 0.07 | -40.66 | 1.04 | -42.92 | 0.8208 | -0.0491 | |||
| WOR / Worthington Enterprises, Inc. | 0.02 | -40.86 | 0.96 | -17.01 | 0.7571 | 0.2046 | |||
| CSGS / CSG Systems International, Inc. | 0.01 | -41.11 | 0.95 | -39.51 | 0.7555 | -0.0005 | |||
| SXI / Standex International Corporation | 0.01 | -41.50 | 0.94 | -52.55 | 0.7440 | -0.2048 | |||
| ROCK / Gibraltar Industries, Inc. | 0.02 | -40.62 | 0.93 | -47.10 | 0.7361 | -0.1058 | |||
| RUN / Sunrun Inc. | 0.12 | -40.72 | 0.88 | -38.80 | 0.6947 | 0.0079 | |||
| KMT / Kennametal Inc. | 0.04 | -40.85 | 0.87 | -42.44 | 0.6904 | -0.0359 | |||
| PBI / Pitney Bowes Inc. | 0.08 | -40.81 | 0.85 | -43.70 | 0.6721 | -0.0508 | |||
| WERN / Werner Enterprises, Inc. | 0.03 | -40.51 | 0.84 | -52.62 | 0.6654 | -0.1843 | |||
| POWL / Powell Industries, Inc. | 0.00 | -40.20 | 0.84 | -40.27 | 0.6613 | -0.0088 | |||
| JBLU / JetBlue Airways Corporation | 0.16 | -40.04 | 0.80 | -53.59 | 0.6300 | -0.1913 | |||
| DNOW / DNOW Inc. | 0.05 | -41.18 | 0.79 | -46.98 | 0.6261 | -0.0881 | |||
| LNN / Lindsay Corporation | 0.01 | -40.95 | 0.79 | -37.72 | 0.6227 | 0.0176 | |||
| ARCB / ArcBest Corporation | 0.01 | -41.36 | 0.76 | -53.36 | 0.5999 | -0.1784 | |||
| GBX / The Greenbrier Companies, Inc. | 0.02 | -41.08 | 0.73 | -52.77 | 0.5808 | -0.1634 | |||
| TNC / Tennant Company | 0.01 | -41.08 | 0.73 | -49.34 | 0.5772 | -0.1126 | |||
| HI / Hillenbrand, Inc. | 0.04 | -40.91 | 0.71 | -61.41 | 0.5654 | -0.3212 | |||
| MBC / MasterBrand, Inc. | 0.07 | -41.08 | 0.67 | -57.02 | 0.5328 | -0.2181 | |||
| TILE / Interface, Inc. | 0.03 | -41.08 | 0.61 | -41.48 | 0.4813 | -0.0167 | |||
| NVEE / NV5 Global, Inc. | 0.03 | -41.07 | 0.60 | -27.81 | 0.4728 | 0.0760 | |||
| MLKN / MillerKnoll, Inc. | 0.04 | -41.93 | 0.60 | -54.50 | 0.4725 | -0.1554 | |||
| SNDR / Schneider National, Inc. | 0.02 | -41.08 | 0.57 | -48.26 | 0.4475 | -0.0760 | |||
| DXPE / DXP Enterprises, Inc. | 0.01 | -41.07 | 0.55 | -46.20 | 0.4320 | -0.0536 | |||
| HCSG / Healthcare Services Group, Inc. | 0.04 | -40.92 | 0.54 | -20.80 | 0.4258 | 0.1009 | |||
| VICR / Vicor Corporation | 0.01 | -41.08 | 0.52 | -59.38 | 0.4132 | -0.2030 | |||
| PRLB / Proto Labs, Inc. | 0.01 | -41.07 | 0.47 | -45.41 | 0.3725 | -0.0402 | |||
| ASTE / Astec Industries, Inc. | 0.01 | -41.07 | 0.47 | -34.87 | 0.3682 | 0.0256 | |||
| HSII / Heidrick & Struggles International, Inc. | 0.01 | -41.07 | 0.46 | -37.31 | 0.3662 | 0.0130 | |||
| AMWD / American Woodmark Corporation | 0.01 | -42.76 | 0.44 | -48.05 | 0.3488 | -0.0575 | |||
| APOG / Apogee Enterprises, Inc. | 0.01 | -41.05 | 0.44 | -52.48 | 0.3487 | -0.0955 | |||
| ALGT / Allegiant Travel Company | 0.01 | -41.08 | 0.42 | -55.47 | 0.3322 | -0.1192 | |||
| HTZ / Hertz Global Holdings, Inc. | 0.06 | -41.08 | 0.42 | -7.33 | 0.3302 | 0.1142 | |||
| NX / Quanex Building Products Corporation | 0.02 | -40.83 | 0.41 | -48.69 | 0.3246 | -0.0584 | |||
| MRTN / Marten Transport, Ltd. | 0.03 | -41.06 | 0.39 | -47.80 | 0.3099 | -0.0495 | |||
| VSTS / Vestis Corporation | 0.06 | -40.96 | 0.37 | -69.35 | 0.2901 | -0.2822 | |||
| IIIN / Insteel Industries, Inc. | 0.01 | -41.14 | 0.35 | -26.76 | 0.2796 | 0.0485 | |||
| HSC / Enviri Corp | 0.04 | -41.08 | 0.34 | -25.98 | 0.2684 | 0.0484 | |||
| DLX / Deluxe Corporation | 0.02 | -41.08 | 0.33 | -49.07 | 0.2596 | -0.0481 | |||
| PRSU / Pursuit Attractions and Hospitality, Inc. | 0.01 | -40.86 | 0.31 | -58.43 | 0.2439 | -0.1115 | |||
| LQDT / Liquidity Services, Inc. | 0.01 | -40.10 | 0.27 | -58.30 | 0.2176 | -0.0975 | |||
| SNCY / Sun Country Airlines Holdings, Inc. | 0.02 | -40.83 | 0.24 | -57.55 | 0.1872 | -0.0793 | |||
| NPK / National Presto Industries, Inc. | 0.00 | -41.10 | 0.23 | -50.44 | 0.1799 | -0.0397 | |||
| HTLD / Heartland Express, Inc. | 0.02 | -41.06 | 0.20 | -48.98 | 0.1588 | -0.0293 | |||
| TWI / Titan International, Inc. | 0.02 | -41.07 | 0.18 | -50.00 | 0.1428 | -0.0299 | |||
| FWRD / Forward Air Corporation | 0.01 | -41.08 | 0.17 | -55.95 | 0.1378 | -0.0518 | |||
| US8252528851 / Invesco Government & Agency Portfolio, Institutional Class | 0.01 | -89.57 | 0.01 | -90.18 | 0.0093 | -0.0448 | |||
| MATW / Matthews International Corporation | 0.00 | -100.00 | 0.00 | -100.00 | -0.3220 |