Statistik Asas
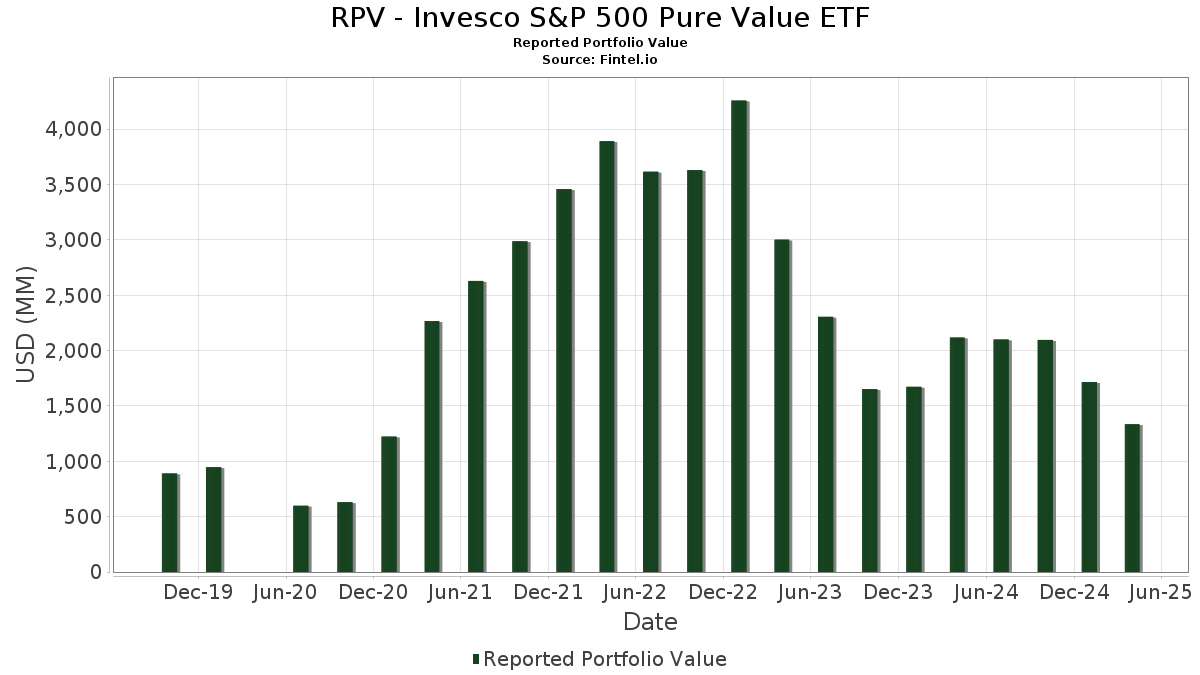
| Nilai Portfolio | $ 1,335,039,176 |
| Kedudukan Semasa | 109 |
Pegangan Terkini, Prestasi, AUM (dari 13F, 13D)
RPV - Invesco S&P 500 Pure Value ETF telah mendedahkan 109 jumlah pegangan dalam pemfailan SEC terkini mereka. Nilai portfolio terkini dikira sebagai $ 1,335,039,176 USD. Aset Sebenar Di Bawah Pengurusan (AUM) ialah nilai ini ditambah dengan tunai (yang tidak didedahkan). Pegangan teratas RPV - Invesco S&P 500 Pure Value ETF ialah CVS Health Corporation (US:CVS) , Centene Corporation (US:CNC) , Ford Motor Company (US:F) , General Motors Company (US:GM) , and The Mosaic Company (US:MOS) .
Kenaikan Teratas Suku Tahun Ini
Kami menggunakan perubahan dalam peruntukan portfolio kerana ini adalah metrik yang paling bermakna. Perubahan boleh disebabkan oleh perdagangan atau perubahan dalam harga saham.
| Sekuriti | Saham (MM) |
Nilai (MM$) |
Portfolio % | ΔPortfolio % |
|---|---|---|---|---|
| 43.09 | 43.09 | 3.3770 | 3.3770 | |
| 16.58 | 16.58 | 1.2989 | 1.2989 | |
| 0.66 | 43.77 | 3.4302 | 0.7515 | |
| 0.24 | 22.10 | 1.7319 | 0.5205 | |
| 0.35 | 25.48 | 1.9963 | 0.4230 | |
| 1.00 | 30.34 | 2.3774 | 0.3651 | |
| 0.03 | 20.40 | 1.5985 | 0.3632 | |
| 0.06 | 21.66 | 1.6972 | 0.3440 | |
| 0.07 | 20.81 | 1.6309 | 0.3255 | |
| 0.14 | 20.13 | 1.5771 | 0.3049 |
Penurunan Teratas Suku Tahun Ini
Kami menggunakan perubahan dalam peruntukan portfolio kerana ini adalah metrik yang paling bermakna. Perubahan boleh disebabkan oleh perdagangan atau perubahan dalam harga saham.
| Sekuriti | Saham (MM) |
Nilai (MM$) |
Portfolio % | ΔPortfolio % |
|---|---|---|---|---|
| 0.00 | 0.00 | -0.5591 | ||
| 1.01 | 14.11 | 1.1058 | -0.3047 | |
| 1.54 | 12.95 | 1.0147 | -0.2413 | |
| 0.13 | 7.97 | 0.6246 | -0.2209 | |
| 0.19 | 12.46 | 0.9767 | -0.2182 | |
| 0.56 | 8.68 | 0.6799 | -0.2070 | |
| 0.08 | 7.63 | 0.5982 | -0.1911 | |
| 0.66 | 10.77 | 0.8437 | -0.1751 | |
| 0.18 | 10.20 | 0.7997 | -0.1617 | |
| 0.28 | 10.32 | 0.8090 | -0.1544 |
13F dan Pemfailan Dana
Borang ini telah difailkan pada 2025-06-27 untuk tempoh pelaporan 2025-04-30. Klik ikon pautan untuk melihat sejarah transaksi penuh.
Tingkatkan untuk membuka data premium dan eksport ke Excel ![]() .
.
| Sekuriti | Jenis | Purata Harga Saham | Saham (MM) |
ΔSaham (%) |
ΔSaham (%) |
Nilai ($MM) |
Portfolio (%) |
ΔPortfolio (%) |
|
|---|---|---|---|---|---|---|---|---|---|
| CVS / CVS Health Corporation | 0.66 | -11.70 | 43.77 | 4.29 | 3.4302 | 0.7515 | |||
| Invesco Private Prime Fund / STIV (N/A) | 43.09 | 43.09 | 3.3770 | 3.3770 | |||||
| CNC / Centene Corporation | 0.57 | -11.71 | 34.10 | -17.47 | 2.6724 | 0.0352 | |||
| F / Ford Motor Company | 3.30 | -11.73 | 33.00 | -12.34 | 2.5858 | 0.1834 | |||
| GM / General Motors Company | 0.68 | -11.75 | 30.54 | -19.28 | 2.3930 | -0.0214 | |||
| MOS / The Mosaic Company | 1.00 | -11.73 | 30.34 | -3.78 | 2.3774 | 0.3651 | |||
| BG / Bunge Global SA | 0.37 | -11.72 | 28.78 | -8.71 | 2.2549 | 0.2432 | |||
| ADM / Archer-Daniels-Midland Company | 0.59 | -11.72 | 28.25 | -17.72 | 2.2137 | 0.0226 | |||
| PARA / Paramount Global | 2.18 | -11.74 | 25.55 | -4.76 | 2.0025 | 0.2901 | |||
| KR / The Kroger Co. | 0.35 | -11.79 | 25.48 | 3.34 | 1.9963 | 0.4230 | |||
| TSN / Tyson Foods, Inc. | 0.39 | -11.69 | 24.16 | -4.27 | 1.8936 | 0.2827 | |||
| HUM / Humana Inc. | 0.09 | -11.70 | 23.36 | -21.03 | 1.8306 | -0.0574 | |||
| VLO / Valero Energy Corporation | 0.19 | -11.73 | 22.10 | -22.96 | 1.7321 | -0.0989 | |||
| DG / Dollar General Corporation | 0.24 | -11.69 | 22.10 | 16.44 | 1.7319 | 0.5205 | |||
| CI / The Cigna Group | 0.06 | -11.62 | 21.66 | 2.15 | 1.6972 | 0.3440 | |||
| COR / Cencora, Inc. | 0.07 | -11.62 | 20.81 | 1.76 | 1.6309 | 0.3255 | |||
| WBA / Walgreens Boots Alliance, Inc. | 1.88 | -11.71 | 20.66 | -5.79 | 1.6190 | 0.2195 | |||
| MCK / McKesson Corporation | 0.03 | -12.06 | 20.40 | 5.39 | 1.5985 | 0.3632 | |||
| CAH / Cardinal Health, Inc. | 0.14 | -11.64 | 20.13 | 0.96 | 1.5771 | 0.3049 | |||
| C / Citigroup Inc. | 0.28 | -11.63 | 19.08 | -25.79 | 1.4953 | -0.1457 | |||
| PSX / Phillips 66 | 0.18 | -11.77 | 18.31 | -22.11 | 1.4352 | -0.0655 | |||
| MPC / Marathon Petroleum Corporation | 0.13 | -11.89 | 17.96 | -16.91 | 1.4072 | 0.0279 | |||
| KHC / The Kraft Heinz Company | 0.60 | -11.66 | 17.37 | -13.85 | 1.3614 | 0.0743 | |||
| AIG / American International Group, Inc. | 0.21 | -11.63 | 17.18 | -2.20 | 1.3464 | 0.2252 | |||
| HII / Huntington Ingalls Industries, Inc. | 0.07 | -11.94 | 16.79 | 2.82 | 1.3160 | 0.2736 | |||
| Invesco Private Government Fund / STIV (N/A) | 16.58 | 16.58 | 1.2989 | 1.2989 | |||||
| ELV / Elevance Health, Inc. | 0.04 | -12.18 | 16.56 | -6.67 | 1.2979 | 0.1654 | |||
| TAP / Molson Coors Beverage Company | 0.29 | -11.68 | 16.42 | -7.20 | 1.2864 | 0.1574 | |||
| DLTR / Dollar Tree, Inc. | 0.20 | -11.77 | 16.32 | -1.64 | 1.2788 | 0.2199 | |||
| EG / Everest Group, Ltd. | 0.05 | -12.03 | 16.23 | -9.16 | 1.2718 | 0.1315 | |||
| MOH / Molina Healthcare, Inc. | 0.05 | -11.83 | 16.13 | -7.12 | 1.2640 | 0.1556 | |||
| L / Loews Corporation | 0.18 | -11.88 | 15.85 | -10.46 | 1.2422 | 0.1124 | |||
| WBD / Warner Bros. Discovery, Inc. | 1.77 | -11.86 | 15.32 | -26.80 | 1.2001 | -0.1352 | |||
| APTV / Aptiv PLC | 0.25 | -11.88 | 14.48 | -19.45 | 1.1351 | -0.0126 | |||
| MHK / Mohawk Industries, Inc. | 0.13 | -11.97 | 14.25 | -23.45 | 1.1168 | -0.0714 | |||
| PRU / Prudential Financial, Inc. | 0.14 | -11.91 | 14.19 | -25.08 | 1.1123 | -0.0968 | |||
| IVZ / Invesco Ltd. | 1.01 | -11.86 | 14.11 | -36.15 | 1.1058 | -0.3047 | |||
| LKQ / LKQ Corporation | 0.36 | -11.83 | 13.87 | -9.89 | 1.0868 | 0.1045 | |||
| BEN / Franklin Resources, Inc. | 0.70 | -11.85 | 13.16 | -25.64 | 1.0309 | -0.0982 | |||
| VTRS / Viatris Inc. | 1.54 | -11.86 | 12.95 | -34.21 | 1.0147 | -0.2413 | |||
| KMX / CarMax, Inc. | 0.19 | -11.85 | 12.46 | -33.43 | 0.9767 | -0.2182 | |||
| HPE / Hewlett Packard Enterprise Company | 0.66 | -11.89 | 10.77 | -32.56 | 0.8437 | -0.1751 | |||
| EXC / Exelon Corporation | 0.23 | -11.79 | 10.69 | 3.43 | 0.8374 | 0.1780 | |||
| CFG / Citizens Financial Group, Inc. | 0.28 | -11.81 | 10.32 | -31.62 | 0.8090 | -0.1544 | |||
| LYB / LyondellBasell Industries N.V. | 0.18 | -11.90 | 10.20 | -32.26 | 0.7997 | -0.1617 | |||
| T / AT&T Inc. | 0.36 | -11.73 | 10.08 | 3.04 | 0.7899 | 0.1656 | |||
| LUV / Southwest Airlines Co. | 0.35 | -11.89 | 9.76 | -19.78 | 0.7646 | -0.0117 | |||
| BBY / Best Buy Co., Inc. | 0.15 | -11.79 | 9.67 | -31.49 | 0.7578 | -0.1430 | |||
| DOW / Dow Inc. | 0.32 | -11.83 | 9.65 | -30.94 | 0.7565 | -0.1355 | |||
| JBL / Jabil Inc. | 0.06 | -11.83 | 9.34 | -20.43 | 0.7317 | -0.0173 | |||
| CAG / Conagra Brands, Inc. | 0.38 | -11.85 | 9.31 | -15.87 | 0.7293 | 0.0233 | |||
| MET / MetLife, Inc. | 0.12 | -11.85 | 9.27 | -23.20 | 0.7267 | -0.0439 | |||
| UHS / Universal Health Services, Inc. | 0.05 | -11.84 | 9.18 | -17.22 | 0.7198 | 0.0117 | |||
| INTC / Intel Corporation | 0.45 | -11.82 | 9.02 | -8.79 | 0.7069 | 0.0758 | |||
| SYY / Sysco Corporation | 0.12 | -11.96 | 8.72 | -13.80 | 0.6831 | 0.0377 | |||
| APA / APA Corporation | 0.56 | -11.89 | 8.68 | -37.56 | 0.6799 | -0.2070 | |||
| COF / Capital One Financial Corporation | 0.05 | -12.25 | 8.34 | -22.35 | 0.6537 | -0.0319 | |||
| STT / State Street Corporation | 0.09 | -11.95 | 8.26 | -23.66 | 0.6471 | -0.0433 | |||
| SJM / The J. M. Smucker Company | 0.07 | -11.68 | 8.22 | -3.94 | 0.6445 | 0.0981 | |||
| SWK / Stanley Black & Decker, Inc. | 0.13 | -11.72 | 7.97 | -39.83 | 0.6246 | -0.2209 | |||
| ALL / The Allstate Corporation | 0.04 | -12.32 | 7.78 | -9.55 | 0.6098 | 0.0607 | |||
| ED / Consolidated Edison, Inc. | 0.07 | -11.88 | 7.70 | 5.99 | 0.6032 | 0.1397 | |||
| TGT / Target Corporation | 0.08 | -11.97 | 7.63 | -38.28 | 0.5982 | -0.1911 | |||
| EVRG / Evergy, Inc. | 0.11 | -11.86 | 7.59 | -5.08 | 0.5944 | 0.0843 | |||
| SW / Smurfit Westrock Plc | 0.18 | -11.79 | 7.58 | -30.19 | 0.5943 | -0.0990 | |||
| NUE / Nucor Corporation | 0.06 | -11.68 | 7.56 | -17.91 | 0.5927 | 0.0047 | |||
| MGM / MGM Resorts International | 0.24 | -11.84 | 7.46 | -19.56 | 0.5845 | -0.0073 | |||
| CZR / Caesars Entertainment, Inc. | 0.27 | -11.86 | 7.35 | -33.84 | 0.5756 | -0.1330 | |||
| GPC / Genuine Parts Company | 0.06 | -11.73 | 7.12 | -10.74 | 0.5576 | 0.0488 | |||
| PNW / Pinnacle West Capital Corporation | 0.07 | -12.24 | 7.07 | -3.94 | 0.5543 | 0.0843 | |||
| AES / The AES Corporation | 0.71 | -11.88 | 7.05 | -19.90 | 0.5526 | -0.0092 | |||
| VZ / Verizon Communications Inc. | 0.16 | -11.99 | 7.03 | -1.56 | 0.5506 | 0.0951 | |||
| AIZ / Assurant, Inc. | 0.04 | -11.39 | 7.03 | -20.64 | 0.5506 | -0.0144 | |||
| HSIC / Henry Schein, Inc. | 0.11 | -12.03 | 6.88 | -28.56 | 0.5395 | -0.0755 | |||
| TRV / The Travelers Companies, Inc. | 0.03 | -12.51 | 6.82 | -5.75 | 0.5347 | 0.0727 | |||
| VICI / VICI Properties Inc. | 0.21 | -11.84 | 6.69 | -5.19 | 0.5244 | 0.0740 | |||
| EQT / EQT Corporation | 0.13 | -11.78 | 6.51 | -14.68 | 0.5098 | 0.0232 | |||
| XOM / Exxon Mobil Corporation | 0.06 | -11.92 | 6.44 | -12.92 | 0.5045 | 0.0327 | |||
| ARE / Alexandria Real Estate Equities, Inc. | 0.09 | -11.67 | 6.42 | -34.07 | 0.5032 | -0.1184 | |||
| DVN / Devon Energy Corporation | 0.21 | -11.83 | 6.35 | -21.38 | 0.4978 | -0.0178 | |||
| CMCSA / Comcast Corporation | 0.18 | -11.96 | 6.26 | -10.55 | 0.4908 | 0.0439 | |||
| CB / Chubb Limited | 0.02 | -11.17 | 6.21 | -6.53 | 0.4867 | 0.0626 | |||
| BAX / Baxter International Inc. | 0.20 | -11.91 | 6.21 | -15.67 | 0.4864 | 0.0166 | |||
| BAC / Bank of America Corporation | 0.15 | -11.90 | 6.01 | -24.11 | 0.4711 | -0.0345 | |||
| TFC / Truist Financial Corporation | 0.16 | -11.74 | 5.94 | -28.94 | 0.4658 | -0.0680 | |||
| LEN / Lennar Corporation | 0.05 | -11.67 | 5.92 | -26.91 | 0.4639 | -0.0529 | |||
| FDX / FedEx Corporation | 0.03 | -11.73 | 5.90 | -29.91 | 0.4622 | -0.0748 | |||
| BIIB / Biogen Inc. | 0.05 | -11.69 | 5.89 | -25.71 | 0.4616 | -0.0445 | |||
| FANG / Diamondback Energy, Inc. | 0.04 | -12.16 | 5.74 | -29.45 | 0.4498 | -0.0694 | |||
| ES / Eversource Energy | 0.10 | -11.79 | 5.72 | -9.03 | 0.4483 | 0.0469 | |||
| CVX / Chevron Corporation | 0.04 | -12.07 | 5.69 | -19.81 | 0.4462 | -0.0070 | |||
| PFG / Principal Financial Group, Inc. | 0.08 | -11.71 | 5.69 | -20.59 | 0.4457 | -0.0115 | |||
| STLD / Steel Dynamics, Inc. | 0.04 | -11.81 | 5.63 | -10.78 | 0.4412 | 0.0385 | |||
| COG / Cabot Oil & Gas Corp. | 0.23 | -11.65 | 5.63 | -21.72 | 0.4410 | -0.0178 | |||
| OXY / Occidental Petroleum Corporation | 0.14 | -11.75 | 5.59 | -25.44 | 0.4380 | -0.0405 | |||
| TXT / Textron Inc. | 0.08 | -11.95 | 5.55 | -19.02 | 0.4349 | -0.0024 | |||
| MTB / M&T Bank Corporation | 0.03 | -11.96 | 5.47 | -25.74 | 0.4286 | -0.0414 | |||
| PCG / PG&E Corporation | 0.33 | -11.87 | 5.39 | -6.97 | 0.4226 | 0.0526 | |||
| HBAN / Huntington Bancshares Incorporated | 0.35 | -11.65 | 5.14 | -25.37 | 0.4025 | -0.0367 | |||
| IP / International Paper Company | 0.11 | -12.17 | 5.10 | -27.88 | 0.4000 | -0.0517 | |||
| EMN / Eastman Chemical Company | 0.07 | -12.09 | 5.07 | -32.08 | 0.3971 | -0.0790 | |||
| RF / Regions Financial Corporation | 0.24 | -11.71 | 4.90 | -26.87 | 0.3839 | -0.0436 | |||
| GPN / Global Payments Inc. | 0.06 | -11.90 | 4.87 | -40.44 | 0.3819 | -0.1402 | |||
| DD / DuPont de Nemours, Inc. | 0.07 | -11.64 | 4.86 | -24.08 | 0.3805 | -0.0277 | |||
| KEY / KeyCorp | 0.33 | -11.81 | 4.86 | -27.22 | 0.3805 | -0.0452 | |||
| DHI / D.R. Horton, Inc. | 0.04 | -12.12 | 4.78 | -21.77 | 0.3746 | -0.0153 | |||
| FOXA / Fox Corporation | 0.09 | -11.56 | 4.64 | -13.96 | 0.3637 | 0.0194 | |||
| FOX / Fox Corporation | 0.06 | -12.31 | 2.57 | -16.56 | 0.2013 | 0.0048 | |||
| US8252528851 / Invesco Government & Agency Portfolio, Institutional Class | 0.42 | -9.11 | 0.42 | -9.15 | 0.0327 | 0.0034 | |||
| FMC / FMC Corporation | 0.00 | -100.00 | 0.00 | -100.00 | -0.5591 |