Statistik Asas
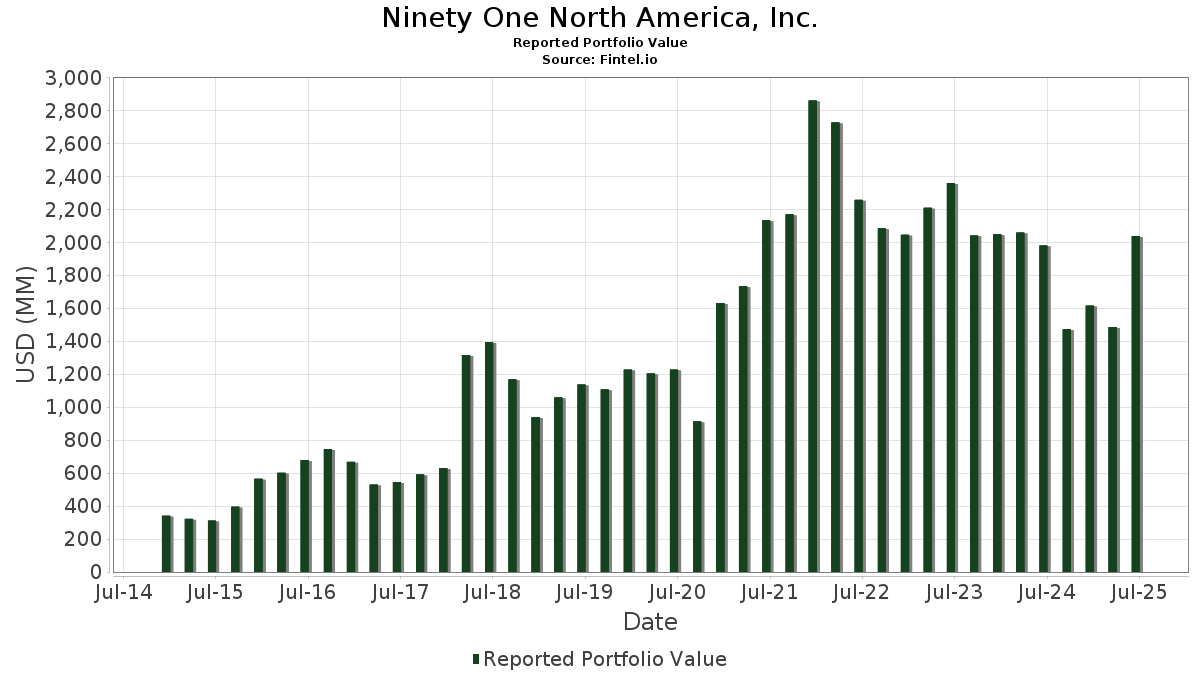
| Nilai Portfolio | $ 2,037,387,480 |
| Kedudukan Semasa | 65 |
Pegangan Terkini, Prestasi, AUM (dari 13F, 13D)
Ninety One North America, Inc. telah mendedahkan 65 jumlah pegangan dalam pemfailan SEC terkini mereka. Nilai portfolio terkini dikira sebagai $ 2,037,387,480 USD. Aset Sebenar Di Bawah Pengurusan (AUM) ialah nilai ini ditambah dengan tunai (yang tidak didedahkan). Pegangan teratas Ninety One North America, Inc. ialah Visa Inc. (US:V) , Microsoft Corporation (US:MSFT) , Philip Morris International Inc. (US:PM) , Booking Holdings Inc. (US:BKNG) , and Autodesk, Inc. (US:ADSK) . Kedudukan baharu Ninety One North America, Inc. termasuk StoneCo Ltd. (US:STNE) , .
Kenaikan Teratas Suku Tahun Ini
Kami menggunakan perubahan dalam peruntukan portfolio kerana ini adalah metrik yang paling bermakna. Perubahan boleh disebabkan oleh perdagangan atau perubahan dalam harga saham.
| Sekuriti | Saham (MM) |
Nilai (MM$) |
Portfolio % | ΔPortfolio % |
|---|---|---|---|---|
| 0.28 | 136.92 | 6.7203 | 2.0569 | |
| 0.11 | 40.95 | 2.0100 | 1.8089 | |
| 0.11 | 84.20 | 4.1328 | 1.1304 | |
| 0.02 | 91.06 | 4.4694 | 1.0563 | |
| 0.48 | 65.10 | 3.1954 | 0.9970 | |
| 0.37 | 65.88 | 3.2338 | 0.5892 | |
| 0.29 | 90.62 | 4.4478 | 0.5432 | |
| 1.10 | 32.96 | 1.6179 | 0.4132 | |
| 0.21 | 16.39 | 0.8047 | 0.3903 | |
| 0.47 | 7.58 | 0.3719 | 0.3719 |
Penurunan Teratas Suku Tahun Ini
Kami menggunakan perubahan dalam peruntukan portfolio kerana ini adalah metrik yang paling bermakna. Perubahan boleh disebabkan oleh perdagangan atau perubahan dalam harga saham.
| Sekuriti | Saham (MM) |
Nilai (MM$) |
Portfolio % | ΔPortfolio % |
|---|---|---|---|---|
| 0.13 | 73.53 | 3.6088 | -1.2626 | |
| 0.43 | 62.38 | 3.0616 | -1.1308 | |
| 0.11 | 33.52 | 1.6451 | -0.7393 | |
| 2.49 | 24.19 | 1.1874 | -0.6185 | |
| 0.04 | 9.36 | 0.4593 | -0.6069 | |
| 0.21 | 60.39 | 2.9639 | -0.5995 | |
| 0.33 | 53.36 | 2.6190 | -0.5402 | |
| 0.22 | 22.87 | 1.1223 | -0.4568 | |
| 0.60 | 33.20 | 1.6293 | -0.3863 | |
| 0.33 | 22.94 | 1.1261 | -0.3832 |
13F dan Pemfailan Dana
Borang ini telah difailkan pada 2025-07-18 untuk tempoh pelaporan 2025-06-30. Klik ikon pautan untuk melihat sejarah transaksi penuh.
Tingkatkan untuk membuka data premium dan eksport ke Excel ![]() .
.
| Sekuriti | Jenis | Purata Harga Saham | Saham (MM) |
ΔSaham (%) |
ΔSaham (%) |
Nilai ($MM) |
Portfolio (%) |
ΔPortfolio (%) |
|
|---|---|---|---|---|---|---|---|---|---|
| V / Visa Inc. | 0.43 | 40.35 | 153.96 | 42.19 | 7.5569 | 0.2681 | |||
| MSFT / Microsoft Corporation | 0.28 | 49.15 | 136.92 | 97.64 | 6.7203 | 2.0569 | |||
| PM / Philip Morris International Inc. | 0.69 | 13.46 | 126.31 | 30.19 | 6.1995 | -0.3312 | |||
| BKNG / Booking Holdings Inc. | 0.02 | 42.91 | 91.06 | 79.59 | 4.4694 | 1.0563 | |||
| ADSK / Autodesk, Inc. | 0.29 | 32.12 | 90.62 | 56.23 | 4.4478 | 0.5432 | |||
| INTU / Intuit Inc. | 0.11 | 47.16 | 84.20 | 88.78 | 4.1328 | 1.1304 | |||
| MA / Mastercard Incorporated | 0.13 | -0.90 | 73.53 | 1.60 | 3.6088 | -1.2626 | |||
| TSM / Taiwan Semiconductor Manufacturing Company Limited - Depositary Receipt (Common Stock) | 0.31 | -5.32 | 70.76 | 29.18 | 3.4729 | -0.2141 | |||
| GOOGL / Alphabet Inc. | 0.37 | 47.16 | 65.88 | 67.70 | 3.2338 | 0.5892 | |||
| NTES / NetEase, Inc. - Depositary Receipt (Common Stock) | 0.48 | 52.45 | 65.10 | 99.35 | 3.1954 | 0.9970 | |||
| ICLR / ICON Public Limited Company | 0.43 | 20.50 | 62.38 | 0.16 | 3.0616 | -1.1308 | |||
| VRSN / VeriSign, Inc. | 0.21 | 0.28 | 60.39 | 14.07 | 2.9639 | -0.5995 | |||
| SE / Sea Limited - Depositary Receipt (Common Stock) | 0.33 | -7.24 | 53.36 | 13.69 | 2.6190 | -0.5402 | |||
| EA / Electronic Arts Inc. | 0.32 | 42.73 | 51.58 | 57.73 | 2.5319 | 0.3304 | |||
| ADP / Automatic Data Processing, Inc. | 0.17 | 35.30 | 50.97 | 36.58 | 2.5019 | -0.0105 | |||
| BAP / Credicorp Ltd. | 0.21 | -1.28 | 46.23 | 18.53 | 2.2693 | -0.3565 | |||
| CHKP / Check Point Software Technologies Ltd. | 0.20 | 45.86 | 44.26 | 41.59 | 2.1723 | 0.0682 | |||
| AON / Aon plc | 0.11 | 1,433.94 | 40.95 | 1,271.40 | 2.0100 | 1.8089 | |||
| FDS / FactSet Research Systems Inc. | 0.08 | 42.71 | 37.88 | 40.40 | 1.8592 | 0.0431 | |||
| EW / Edwards Lifesciences Corporation | 0.48 | 46.59 | 37.57 | 58.18 | 1.8441 | 0.2452 | |||
| JNJ / Johnson & Johnson | 0.24 | 42.28 | 36.78 | 31.05 | 1.8051 | -0.0840 | |||
| SPGI / S&P Global Inc. | 0.07 | 41.91 | 36.13 | 47.27 | 1.7731 | 0.1218 | |||
| ACN / Accenture plc | 0.11 | -1.21 | 33.52 | -5.38 | 1.6451 | -0.7393 | |||
| INDA / iShares Trust - iShares MSCI India ETF | 0.60 | 2.50 | 33.20 | 10.86 | 1.6293 | -0.3863 | |||
| CPNG / Coupang, Inc. | 1.10 | 34.82 | 32.96 | 84.19 | 1.6179 | 0.4132 | |||
| MNST / Monster Beverage Corporation | 0.52 | 43.03 | 32.74 | 53.10 | 1.6071 | 0.1674 | |||
| MCO / Moody's Corporation | 0.06 | 41.66 | 32.39 | 52.59 | 1.5900 | 0.1609 | |||
| TX / Ternium S.A. - Depositary Receipt (Common Stock) | 1.02 | 23.43 | 30.79 | 19.23 | 1.5114 | -0.2271 | |||
| ALGN / Align Technology, Inc. | 0.14 | 46.46 | 26.34 | 74.55 | 1.2929 | 0.2771 | |||
| VIST / Vista Energy, S.A.B. de C.V. - Depositary Receipt (Common Stock) | 0.55 | 35.37 | 26.21 | 39.01 | 1.2864 | 0.0172 | |||
| VALE / Vale S.A. - Depositary Receipt (Common Stock) | 2.49 | -7.32 | 24.19 | -9.83 | 1.1874 | -0.6185 | |||
| NEE / NextEra Energy, Inc. | 0.33 | 4.49 | 22.94 | 2.33 | 1.1261 | -0.3832 | |||
| FMX / Fomento Económico Mexicano, S.A.B. de C.V. - Depositary Receipt (Common Stock) | 0.22 | -7.64 | 22.87 | -2.53 | 1.1223 | -0.4568 | |||
| MMC / Marsh & McLennan Companies, Inc. | 0.10 | 47.04 | 21.44 | 31.74 | 1.0522 | -0.0431 | |||
| MMYT / MakeMyTrip Limited | 0.20 | 6.10 | 19.89 | 6.14 | 0.9761 | -0.2852 | |||
| MSI / Motorola Solutions, Inc. | 0.04 | 42.86 | 18.88 | 37.20 | 0.9269 | 0.0004 | |||
| TEL / TE Connectivity plc | 0.10 | 2.65 | 17.50 | 22.52 | 0.8591 | -0.1026 | |||
| CP / Canadian Pacific Kansas City Limited | 0.21 | 135.70 | 16.39 | 166.31 | 0.8047 | 0.3903 | |||
| MELI / MercadoLibre, Inc. | 0.01 | 21.54 | 15.93 | 62.84 | 0.7818 | 0.1233 | |||
| ACM / AECOM | 0.13 | 5.36 | 14.84 | 28.23 | 0.7284 | -0.0506 | |||
| TTEK / Tetra Tech, Inc. | 0.38 | 5.21 | 13.84 | 29.35 | 0.6792 | -0.0409 | |||
| WM / Waste Management, Inc. | 0.04 | -40.22 | 9.36 | -40.92 | 0.4593 | -0.6069 | |||
| IBN / ICICI Bank Limited - Depositary Receipt (Common Stock) | 0.27 | -1.23 | 9.15 | 5.41 | 0.4492 | -0.1352 | |||
| HDB / HDFC Bank Limited - Depositary Receipt (Common Stock) | 0.11 | 64.57 | 8.68 | 89.93 | 0.4258 | 0.1183 | |||
| STNE / StoneCo Ltd. | 0.47 | 7.58 | 0.3719 | 0.3719 | |||||
| PG / The Procter & Gamble Company | 0.04 | -15.35 | 5.72 | -20.87 | 0.2807 | -0.2058 | |||
| ERJ / Embraer S.A. - Depositary Receipt (Common Stock) | 0.09 | 4.94 | 5.04 | 29.27 | 0.2476 | -0.0151 | |||
| FTI / TechnipFMC plc | 0.11 | -2.99 | 3.64 | 5.45 | 0.1786 | -0.0537 | |||
| ASX / ASE Technology Holding Co., Ltd. - Depositary Receipt (Common Stock) | 0.27 | -6.49 | 2.82 | 10.31 | 0.1382 | -0.0337 | |||
| ICE / Intercontinental Exchange, Inc. | 0.01 | -15.35 | 1.57 | -9.95 | 0.0773 | -0.0404 | |||
| ABT / Abbott Laboratories | 0.01 | -15.34 | 1.21 | -13.17 | 0.0592 | -0.0343 | |||
| AJG / Arthur J. Gallagher & Co. | 0.00 | -15.34 | 1.07 | -21.52 | 0.0523 | -0.0391 | |||
| KO / The Coca-Cola Company | 0.01 | -15.35 | 1.02 | -16.41 | 0.0500 | -0.0320 | |||
| CME / CME Group Inc. | 0.00 | -15.34 | 0.85 | -12.05 | 0.0416 | -0.0233 | |||
| ROP / Roper Technologies, Inc. | 0.00 | -15.34 | 0.81 | -18.59 | 0.0398 | -0.0272 | |||
| BDX / Becton, Dickinson and Company | 0.00 | -15.34 | 0.74 | -36.38 | 0.0363 | -0.0419 | |||
| UNH / UnitedHealth Group Incorporated | 0.00 | -15.36 | 0.69 | -49.60 | 0.0337 | -0.0581 | |||
| EFX / Equifax Inc. | 0.00 | -15.34 | 0.68 | -9.87 | 0.0332 | -0.0173 | |||
| SRLN / SSGA Active Trust - SPDR Blackstone Senior Loan ETF | 0.02 | 0.00 | 0.66 | 1.22 | 0.0326 | -0.0116 | |||
| OTIS / Otis Worldwide Corporation | 0.01 | -15.35 | 0.54 | -18.68 | 0.0267 | -0.0184 | |||
| BR / Broadridge Financial Solutions, Inc. | 0.00 | -15.37 | 0.52 | -15.12 | 0.0256 | -0.0158 | |||
| BKLN / Invesco Exchange-Traded Fund Trust II - Invesco Senior Loan ETF | 0.02 | 0.00 | 0.42 | 0.97 | 0.0205 | -0.0073 | |||
| STE / STERIS plc | 0.00 | -15.35 | 0.42 | -10.32 | 0.0205 | -0.0108 | |||
| ZTS / Zoetis Inc. | 0.00 | -15.34 | 0.37 | -19.78 | 0.0183 | -0.0130 | |||
| JKHY / Jack Henry & Associates, Inc. | 0.00 | -15.36 | 0.16 | -16.49 | 0.0077 | -0.0050 | |||
| TMO / Thermo Fisher Scientific Inc. | 0.00 | -100.00 | 0.00 | 0.0000 | |||||
| BN / Brookfield Corporation | 0.00 | -100.00 | 0.00 | 0.0000 | |||||
| KT / KT Corporation - Depositary Receipt (Common Stock) | 0.00 | -100.00 | 0.00 | 0.0000 | |||||
| ANSS / ANSYS, Inc. | 0.00 | -100.00 | 0.00 | 0.0000 |