Statistik Asas
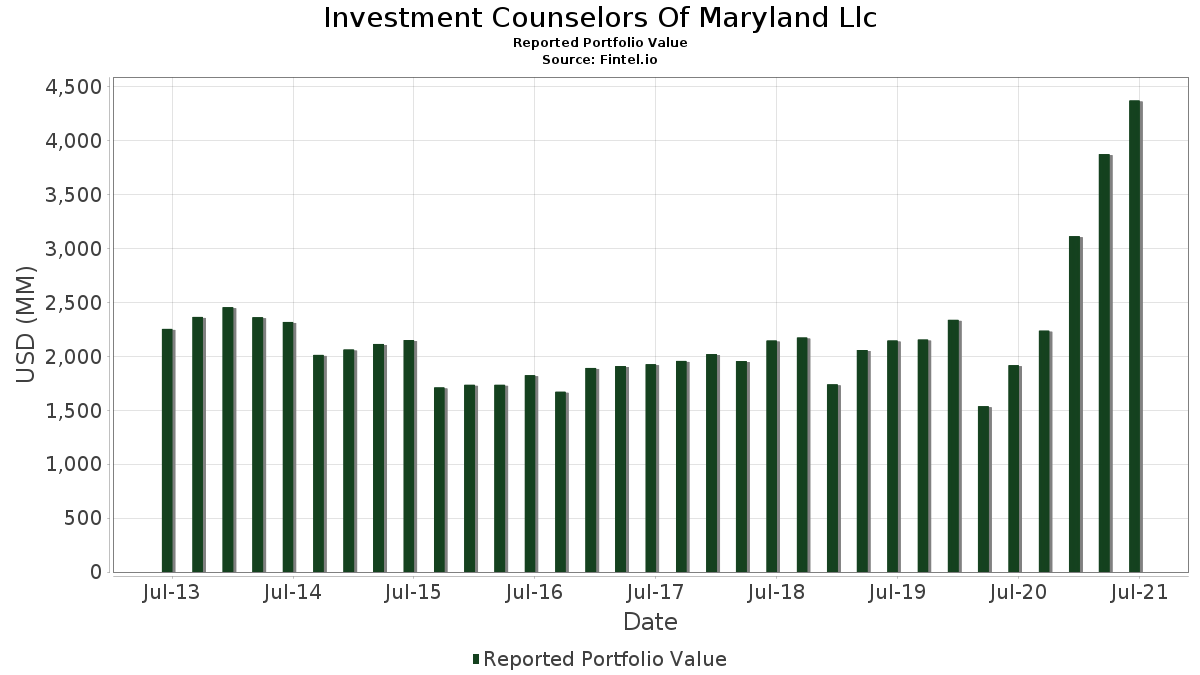
| Nilai Portfolio | $ 4,373,098,000 |
| Kedudukan Semasa | 161 |
Pegangan Terkini, Prestasi, AUM (dari 13F, 13D)
Investment Counselors Of Maryland Llc telah mendedahkan 161 jumlah pegangan dalam pemfailan SEC terkini mereka. Nilai portfolio terkini dikira sebagai $ 4,373,098,000 USD. Aset Sebenar Di Bawah Pengurusan (AUM) ialah nilai ini ditambah dengan tunai (yang tidak didedahkan). Pegangan teratas Investment Counselors Of Maryland Llc ialah Matador Resources Company (US:MTDR) , Lantheus Holdings, Inc. (US:LNTH) , Kulicke and Soffa Industries, Inc. (US:KLIC) , Oxford Industries, Inc. (US:OXM) , and Tri Pointe Homes, Inc. (US:TPH) . Kedudukan baharu Investment Counselors Of Maryland Llc termasuk Herman Miller Inc. (US:MLHR) , Taylor Morrison Home Corporation (US:TMHC) , Telephone and Data Systems, Inc. (US:TDS) , PJT Partners Inc. (US:PJT) , and AudioCodes Ltd. (US:AUDC) .
Kenaikan Teratas Suku Tahun Ini
Kami menggunakan perubahan dalam peruntukan portfolio kerana ini adalah metrik yang paling bermakna. Perubahan boleh disebabkan oleh perdagangan atau perubahan dalam harga saham.
| Sekuriti | Saham (MM) |
Nilai (MM$) |
Portfolio % | ΔPortfolio % |
|---|---|---|---|---|
| 1.04 | 48.88 | 1.1177 | 1.1177 | |
| 1.71 | 45.31 | 1.0361 | 1.0361 | |
| 1.81 | 41.04 | 0.9385 | 0.9385 | |
| 2.01 | 33.18 | 0.7588 | 0.7588 | |
| 0.41 | 29.04 | 0.6639 | 0.6639 | |
| 0.42 | 27.09 | 0.6194 | 0.6194 | |
| 2.24 | 80.51 | 1.8410 | 0.5921 | |
| 0.72 | 23.91 | 0.5468 | 0.5468 | |
| 1.21 | 33.03 | 0.7554 | 0.5260 | |
| 0.73 | 18.43 | 0.4215 | 0.4215 |
Penurunan Teratas Suku Tahun Ini
Kami menggunakan perubahan dalam peruntukan portfolio kerana ini adalah metrik yang paling bermakna. Perubahan boleh disebabkan oleh perdagangan atau perubahan dalam harga saham.
| Sekuriti | Saham (MM) |
Nilai (MM$) |
Portfolio % | ΔPortfolio % |
|---|---|---|---|---|
| 0.00 | 0.00 | -1.1616 | ||
| 0.00 | 0.00 | -1.0737 | ||
| 0.00 | 0.00 | -0.9933 | ||
| 0.00 | 0.00 | -0.9735 | ||
| 0.00 | 0.00 | -0.9452 | ||
| 0.00 | 0.00 | -0.8619 | ||
| 0.00 | 0.00 | -0.8446 | ||
| 1.43 | 35.46 | 0.8108 | -0.5281 | |
| 0.46 | 40.19 | 0.9191 | -0.5259 | |
| 0.00 | 0.15 | 0.0033 | -0.4973 |
13F dan Pemfailan Dana
Borang ini telah difailkan pada 2021-07-16 untuk tempoh pelaporan 2021-06-30. Klik ikon pautan untuk melihat sejarah transaksi penuh.
Tingkatkan untuk membuka data premium dan eksport ke Excel ![]() .
.
| Sekuriti | Jenis | Purata Harga Saham | Saham (MM) |
ΔSaham (%) |
ΔSaham (%) |
Nilai ($MM) |
Portfolio (%) |
ΔPortfolio (%) |
|
|---|---|---|---|---|---|---|---|---|---|
| MTDR / Matador Resources Company | 2.24 | 8.31 | 80.51 | 66.33 | 1.8410 | 0.5921 | |||
| LNTH / Lantheus Holdings, Inc. | 2.78 | 9.11 | 76.82 | 41.13 | 1.7566 | 0.3522 | |||
| KLIC / Kulicke and Soffa Industries, Inc. | 1.17 | 9.80 | 71.56 | 36.83 | 1.6363 | 0.2870 | |||
| OXM / Oxford Industries, Inc. | 0.68 | 8.68 | 67.53 | 22.87 | 1.5443 | 0.1262 | |||
| TPH / Tri Pointe Homes, Inc. | 3.00 | 8.23 | 64.39 | 13.92 | 1.4723 | 0.0140 | |||
| DBI / Designer Brands Inc. | 3.80 | -5.04 | 62.96 | -9.68 | 1.4397 | -0.3589 | |||
| US7587501039 / Regal-Beloit Corp. | 0.45 | 9.09 | 59.73 | 2.07 | 1.3658 | -0.1439 | |||
| GPI / Group 1 Automotive, Inc. | 0.38 | 8.58 | 59.06 | 6.27 | 1.3504 | -0.0835 | |||
| MEI / Methode Electronics, Inc. | 1.20 | 9.69 | 58.95 | 28.58 | 1.3481 | 0.1651 | |||
| JW.A / John Wiley & Sons Inc. - Class A | 0.97 | 8.69 | 58.44 | 20.68 | 1.3364 | 0.0869 | |||
| KRG / Kite Realty Group Trust | 2.61 | 8.36 | 57.41 | 23.64 | 1.3129 | 0.1148 | |||
| BDC / Belden Inc. | 1.13 | 8.90 | 57.22 | 24.12 | 1.3084 | 0.1190 | |||
| URBN / Urban Outfitters, Inc. | 1.33 | 8.15 | 54.75 | 19.87 | 1.2520 | 0.0735 | |||
| DLX / Deluxe Corporation | 1.15 | 9.24 | 54.71 | 24.37 | 1.2510 | 0.1160 | |||
| CNDT / Conduent Incorporated | 7.18 | 9.16 | 53.81 | 22.93 | 1.2305 | 0.1011 | |||
| TCBI / Texas Capital Bancshares, Inc. | 0.85 | 26.80 | 53.66 | 13.51 | 1.2272 | 0.0073 | |||
| TSEM / Tower Semiconductor Ltd. | 1.78 | 42.20 | 52.37 | 49.25 | 1.1976 | 0.2922 | |||
| CNOB / ConnectOne Bancorp, Inc. | 1.96 | 9.20 | 51.27 | 12.73 | 1.1725 | -0.0010 | |||
| ARGO / Argo Group International Holdings, Inc. | 0.97 | 9.24 | 50.41 | 12.52 | 1.1528 | -0.0032 | |||
| PRAA / PRA Group, Inc. | 1.31 | 9.15 | 50.23 | 13.27 | 1.1486 | 0.0045 | |||
| PRGS / Progress Software Corporation | 1.08 | 8.98 | 49.91 | 14.40 | 1.1413 | 0.0156 | |||
| MODV / ModivCare Inc. | 0.29 | 9.26 | 49.67 | 25.44 | 1.1359 | 0.1142 | |||
| GEF.B / Greif, Inc. | 0.81 | 8.85 | 49.25 | 15.63 | 1.1262 | 0.0273 | |||
| KAR / OPENLANE, Inc. | 2.80 | 9.28 | 49.17 | 27.86 | 1.1243 | 0.1321 | |||
| OEC / Orion S.A. | 2.59 | 17.39 | 49.14 | 13.05 | 1.1238 | 0.0021 | |||
| SMP / Standard Motor Products, Inc. | 1.13 | 17.14 | 48.92 | 22.13 | 1.1187 | 0.0852 | |||
| MLHR / Herman Miller Inc. | 1.04 | 48.88 | 1.1177 | 1.1177 | |||||
| CBZ / CBIZ, Inc. | 1.48 | 8.14 | 48.53 | 8.50 | 1.1097 | -0.0443 | |||
| SFNC / Simmons First National Corporation | 1.64 | 8.56 | 48.18 | 7.36 | 1.1018 | -0.0562 | |||
| PPBI / Pacific Premier Bancorp, Inc. | 1.13 | 8.98 | 47.84 | 6.10 | 1.0940 | -0.0695 | |||
| GLDD / Great Lakes Dredge & Dock Corporation | 3.26 | 74.94 | 47.63 | 75.30 | 1.0892 | 0.3881 | |||
| MTX / Minerals Technologies Inc. | 0.60 | 8.75 | 47.59 | 13.58 | 1.0882 | 0.0072 | |||
| VBTX / Veritex Holdings, Inc. | 1.34 | 9.12 | 47.36 | 18.09 | 1.0829 | 0.0482 | |||
| EPC / Edgewell Personal Care Company | 1.05 | 9.02 | 46.29 | 20.86 | 1.0586 | 0.0703 | |||
| NTGR / NETGEAR, Inc. | 1.20 | 32.96 | 45.88 | 23.96 | 1.0493 | 0.0942 | |||
| TMHC / Taylor Morrison Home Corporation | 1.71 | 45.31 | 1.0361 | 1.0361 | |||||
| MTRN / Materion Corporation | 0.60 | 8.97 | 45.27 | 23.95 | 1.0351 | 0.0929 | |||
| WGO / Winnebago Industries, Inc. | 0.66 | 21.74 | 45.01 | 7.86 | 1.0292 | -0.0475 | |||
| ABCB / Ameris Bancorp | 0.88 | 9.30 | 44.74 | 5.39 | 1.0231 | -0.0723 | |||
| THS / TreeHouse Foods, Inc. | 1.00 | 9.23 | 44.44 | -6.92 | 1.0163 | -0.2156 | |||
| PNFP / Pinnacle Financial Partners, Inc. | 0.50 | -16.48 | 44.24 | -16.83 | 1.0117 | -0.3608 | |||
| VRNT / Verint Systems Inc. | 0.97 | 9.20 | 43.73 | 8.19 | 1.0000 | -0.0429 | |||
| CBRL / Cracker Barrel Old Country Store, Inc. | 0.29 | 103.76 | 43.44 | 74.98 | 0.9934 | 0.3528 | |||
| SBCF / Seacoast Banking Corporation of Florida | 1.26 | 9.06 | 43.12 | 2.77 | 0.9860 | -0.0966 | |||
| HUBG / Hub Group, Inc. | 0.65 | 9.13 | 43.11 | 7.02 | 0.9859 | -0.0535 | |||
| NTCT / NetScout Systems, Inc. | 1.50 | 9.01 | 42.82 | 10.48 | 0.9792 | -0.0208 | |||
| BANC / Banc of California, Inc. | 2.43 | 9.22 | 42.56 | 5.96 | 0.9732 | -0.0631 | |||
| GVA / Granite Construction Incorporated | 1.02 | 9.31 | 42.48 | 12.79 | 0.9713 | -0.0004 | |||
| UMH / UMH Properties, Inc. | 1.94 | 8.91 | 42.34 | 23.96 | 0.9681 | 0.0869 | |||
| ICFI / ICF International, Inc. | 0.48 | 9.15 | 42.26 | 9.72 | 0.9662 | -0.0274 | |||
| MTG / MGIC Investment Corporation | 3.10 | 9.07 | 42.10 | 7.10 | 0.9627 | -0.0515 | |||
| EAF / GrafTech International Ltd. | 3.58 | 24.43 | 41.55 | 18.22 | 0.9502 | 0.0433 | |||
| KAMN / Kaman Corporation | 0.82 | 9.31 | 41.49 | 7.41 | 0.9487 | -0.0479 | |||
| CSGS / CSG Systems International, Inc. | 0.88 | 8.96 | 41.36 | 14.52 | 0.9458 | 0.0139 | |||
| TDS / Telephone and Data Systems, Inc. | 1.81 | 41.04 | 0.9385 | 0.9385 | |||||
| CALM / Cal-Maine Foods, Inc. | 1.13 | 58.76 | 41.04 | 49.62 | 0.9385 | 0.2308 | |||
| WERN / Werner Enterprises, Inc. | 0.91 | 8.79 | 40.73 | 2.68 | 0.9314 | -0.0921 | |||
| HSC / Enviri Corp | 1.98 | 9.14 | 40.51 | 29.95 | 0.9264 | 0.1220 | |||
| AIN / Albany International Corp. | 0.45 | 8.87 | 40.48 | 16.42 | 0.9258 | 0.0285 | |||
| ENSG / The Ensign Group, Inc. | 0.46 | -22.30 | 40.19 | -28.23 | 0.9191 | -0.5259 | |||
| CENTA / Central Garden & Pet Company | 0.83 | 8.96 | 40.18 | 1.42 | 0.9187 | -0.1034 | |||
| KN / Knowles Corporation | 2.03 | 9.22 | 40.08 | 3.06 | 0.9164 | -0.0869 | |||
| NWE / NorthWestern Energy Group, Inc. | 0.66 | 27.13 | 39.72 | 17.42 | 0.9082 | 0.0355 | |||
| CODI / Compass Diversified | 1.52 | 8.13 | 38.73 | 19.11 | 0.8857 | 0.0467 | |||
| FBMS / The First Bancshares, Inc. | 1.02 | 9.24 | 38.07 | 11.68 | 0.8705 | -0.0089 | |||
| NUVA / Nuvasive Inc | 0.54 | 9.23 | 36.82 | 12.93 | 0.8420 | 0.0007 | |||
| SASR / Sandy Spring Bancorp, Inc. | 0.83 | 9.14 | 36.62 | 10.90 | 0.8374 | -0.0146 | |||
| SR / Spire Inc. | 0.51 | 9.07 | 36.53 | 6.68 | 0.8352 | -0.0482 | |||
| DRQ / Dril-Quip, Inc. | 1.06 | 47.29 | 35.99 | 49.94 | 0.8231 | 0.2037 | |||
| SXI / Standex International Corporation | 0.38 | 8.86 | 35.97 | 8.10 | 0.8226 | -0.0360 | |||
| STL / Sterling Bancorp. | 1.43 | -36.55 | 35.46 | -31.67 | 0.8108 | -0.5281 | |||
| FRME / First Merchants Corporation | 0.85 | 32.17 | 35.43 | 18.44 | 0.8101 | 0.0383 | |||
| FBNC / First Bancorp | 0.86 | 8.64 | 35.15 | 2.17 | 0.8039 | -0.0839 | |||
| EFSC / Enterprise Financial Services Corp | 0.75 | 9.14 | 34.99 | 2.41 | 0.8001 | -0.0814 | |||
| ABM / ABM Industries Incorporated | 0.78 | 9.21 | 34.63 | -5.05 | 0.7920 | -0.1491 | |||
| UEIC / Universal Electronics Inc. | 0.71 | 8.63 | 34.42 | -4.16 | 0.7870 | -0.1395 | |||
| FCPT / Four Corners Property Trust, Inc. | 1.23 | 36.35 | 34.09 | 37.40 | 0.7795 | 0.1394 | |||
| DOC / Healthpeak Properties, Inc. | 1.82 | 9.30 | 33.69 | 14.25 | 0.7704 | 0.0095 | |||
| MRTN / Marten Transport, Ltd. | 2.01 | 33.18 | 0.7588 | 0.7588 | |||||
| BHLB / Berkshire Hills Bancorp, Inc. | 1.21 | 475.39 | 33.03 | 509.39 | 0.7554 | 0.5260 | |||
| AUB / Atlantic Union Bankshares Corporation | 0.90 | 9.08 | 32.52 | 2.99 | 0.7437 | -0.0711 | |||
| ESRT / Empire State Realty Trust, Inc. | 2.70 | 9.13 | 32.46 | 17.66 | 0.7422 | 0.0305 | |||
| ASTE / Astec Industries, Inc. | 0.51 | 45.88 | 32.17 | 21.74 | 0.7357 | 0.0538 | |||
| SP / SP Plus Corporation | 1.03 | 7.34 | 31.56 | 0.14 | 0.7217 | -0.0915 | |||
| CTT / CatchMark Timber Trust Inc - Class A | 2.69 | 9.10 | 31.48 | 25.39 | 0.7198 | 0.0721 | |||
| LOCO / El Pollo Loco Holdings, Inc. | 1.71 | 8.81 | 31.26 | 23.47 | 0.7149 | 0.0616 | |||
| BHE / Benchmark Electronics, Inc. | 1.09 | 9.29 | 30.98 | 0.59 | 0.7083 | -0.0862 | |||
| EPAC / Enerpac Tool Group Corp. | 1.15 | 8.86 | 30.70 | 10.95 | 0.7020 | -0.0119 | |||
| BDN / Brandywine Realty Trust | 2.16 | 8.66 | 29.60 | 15.40 | 0.6768 | 0.0150 | |||
| PJT / PJT Partners Inc. | 0.41 | 29.04 | 0.6639 | 0.6639 | |||||
| MATX / Matson, Inc. | 0.42 | 27.09 | 0.6194 | 0.6194 | |||||
| MWA / Mueller Water Products, Inc. | 1.81 | 9.22 | 26.11 | 13.39 | 0.5972 | 0.0029 | |||
| PEB / Pebblebrook Hotel Trust | 1.04 | 14.24 | 24.43 | 10.76 | 0.5586 | -0.0105 | |||
| AUDC / AudioCodes Ltd. | 0.72 | 23.91 | 0.5468 | 0.5468 | |||||
| DY / Dycom Industries, Inc. | 0.32 | 9.25 | 23.81 | -12.31 | 0.5445 | -0.1561 | |||
| CGNT / Cognyte Software Ltd. | 0.97 | 9.33 | 23.80 | -3.69 | 0.5441 | -0.0933 | |||
| SHO / Sunstone Hotel Investors, Inc. | 1.74 | 9.28 | 21.62 | 8.93 | 0.4945 | -0.0177 | |||
| FI / Fiserv, Inc. | 7.10 | 11.16 | 21.51 | -5.12 | 0.4919 | -0.0931 | |||
| ITGR / Integer Holdings Corporation | 0.22 | 9.47 | 21.18 | 11.97 | 0.4842 | -0.0037 | |||
| ESTE / Earthstone Energy Inc - Class A | 1.79 | 8.91 | 19.85 | 68.63 | 0.4540 | 0.1502 | |||
| HNGR / Hanger Inc | 0.73 | 18.43 | 0.4215 | 0.4215 | |||||
| MYE / Myers Industries, Inc. | 0.84 | 17.64 | 0.4035 | 0.4035 | |||||
| ROIC / Retail Opportunity Investments Corp. | 0.89 | 6.09 | 15.79 | 18.05 | 0.3610 | 0.0160 | |||
| KALU / Kaiser Aluminum Corporation | 0.12 | 9.13 | 15.24 | 21.96 | 0.3484 | 0.0261 | |||
| LNDC / Landec Corp. | 1.24 | 8.57 | 13.92 | 15.23 | 0.3184 | 0.0066 | |||
| ANIP / ANI Pharmaceuticals, Inc. | 0.38 | 9.00 | 13.45 | 5.71 | 0.3075 | -0.0207 | |||
| / DIME COMMUNITY BANCSHARES IN 0.00000000 | 0.16 | 9.71 | 5.49 | 22.37 | 0.1255 | 0.0098 | |||
| FUL / H.B. Fuller Company | 0.07 | 9.75 | 4.64 | 10.98 | 0.1061 | -0.0018 | |||
| AEIS / Advanced Energy Industries, Inc. | 0.03 | -85.00 | 3.18 | -84.52 | 0.0727 | -0.4569 | |||
| NXGN / NextGen Healthcare Inc | 0.04 | -80.69 | 0.60 | -82.29 | 0.0138 | -0.0743 | |||
| JBL / Jabil Inc. | 0.01 | 0.00 | 0.40 | 11.55 | 0.0091 | -0.0001 | |||
| SLM / SLM Corporation | 0.02 | -13.54 | 0.37 | 0.81 | 0.0085 | -0.0010 | |||
| LH / Labcorp Holdings Inc. | 0.00 | 0.00 | 0.35 | 8.10 | 0.0079 | -0.0003 | |||
| ON / ON Semiconductor Corporation | 0.01 | 0.00 | 0.34 | -8.02 | 0.0079 | -0.0018 | |||
| DVN / Devon Energy Corporation | 0.01 | 0.00 | 0.31 | 33.91 | 0.0070 | 0.0011 | |||
| LKQ / LKQ Corporation | 0.01 | 0.00 | 0.29 | 16.33 | 0.0067 | 0.0002 | |||
| CRI / Carter's, Inc. | 0.00 | 0.00 | 0.29 | 16.13 | 0.0066 | 0.0002 | |||
| FLEX / Flex Ltd. | 0.02 | 0.00 | 0.28 | -2.41 | 0.0065 | -0.0010 | |||
| FFIV / F5, Inc. | 0.00 | 8.24 | 0.28 | -3.17 | 0.0063 | -0.0010 | |||
| SNV / Synovus Financial Corp. | 0.01 | 0.00 | 0.28 | -4.18 | 0.0063 | -0.0011 | |||
| CNC / Centene Corporation | 0.00 | 0.00 | 0.27 | 14.23 | 0.0062 | 0.0001 | |||
| RL / Ralph Lauren Corporation | 0.00 | 0.00 | 0.27 | -4.21 | 0.0062 | -0.0011 | |||
| KNX / Knight-Swift Transportation Holdings Inc. | 0.01 | 4.92 | 0.27 | -1.09 | 0.0062 | -0.0009 | |||
| ACGL / Arch Capital Group Ltd. | 0.01 | 11.28 | 0.27 | 12.97 | 0.0062 | 0.0000 | |||
| EHC / Encompass Health Corporation | 0.00 | 0.00 | 0.27 | -4.59 | 0.0062 | -0.0011 | |||
| CMA / Comerica Incorporated | 0.00 | 0.00 | 0.27 | -0.37 | 0.0061 | -0.0008 | |||
| ABC / Amerisource Bergen Corp. | 0.00 | 0.00 | 0.27 | -2.93 | 0.0061 | -0.0010 | |||
| HUN / Huntsman Corporation | 0.01 | 0.00 | 0.26 | -8.01 | 0.0060 | -0.0014 | |||
| PINC / Premier, Inc. | 0.01 | 61.56 | 0.26 | 66.46 | 0.0060 | 0.0019 | |||
| SNA / Snap-on Incorporated | 0.00 | 0.00 | 0.25 | -3.12 | 0.0057 | -0.0009 | |||
| BRX / Brixmor Property Group Inc. | 0.01 | 0.00 | 0.24 | 13.43 | 0.0056 | 0.0000 | |||
| AXTA / Axalta Coating Systems Ltd. | 0.01 | 0.00 | 0.24 | 3.03 | 0.0054 | -0.0005 | |||
| AYI / Acuity Inc. | 0.00 | 0.00 | 0.24 | 13.33 | 0.0054 | 0.0000 | |||
| CPT / Camden Property Trust | 0.00 | 15.60 | 0.24 | 39.41 | 0.0054 | 0.0010 | |||
| HIG / The Hartford Insurance Group, Inc. | 0.00 | 0.00 | 0.23 | -7.11 | 0.0054 | -0.0012 | |||
| FLS / Flowserve Corporation | 0.01 | 7.39 | 0.23 | 11.90 | 0.0054 | -0.0000 | |||
| DISCA / Discovery Inc - Class A | 0.01 | 0.23 | 0.0054 | 0.0054 | |||||
| MSM / MSC Industrial Direct Co., Inc. | 0.00 | 0.00 | 0.23 | -0.85 | 0.0053 | -0.0007 | |||
| WHR / Whirlpool Corporation | 0.00 | -22.08 | 0.23 | -22.74 | 0.0053 | -0.0024 | |||
| TSN / Tyson Foods, Inc. | 0.00 | 9.13 | 0.22 | 8.37 | 0.0050 | -0.0002 | |||
| IVZ / Invesco Ltd. | 0.01 | 0.00 | 0.22 | 5.80 | 0.0050 | -0.0003 | |||
| TROW / T. Rowe Price Group, Inc. | 0.00 | 0.00 | 0.21 | 15.56 | 0.0048 | 0.0001 | |||
| INGR / Ingredion Incorporated | 0.00 | 0.00 | 0.21 | 0.97 | 0.0048 | -0.0006 | |||
| NVST / Envista Holdings Corporation | 0.00 | 0.00 | 0.21 | 6.15 | 0.0047 | -0.0003 | |||
| DRE / Duke Realty Corporation - Preferred Security | 0.00 | 0.00 | 0.19 | 12.73 | 0.0043 | -0.0000 | |||
| SEE / Sealed Air Corporation | 0.00 | 0.00 | 0.18 | 29.29 | 0.0041 | 0.0005 | |||
| HBAN / Huntington Bancshares Incorporated | 0.01 | 0.18 | 0.0040 | 0.0040 | |||||
| CONE / CyrusOne Inc | 0.00 | 0.00 | 0.17 | 5.49 | 0.0040 | -0.0003 | |||
| EVRG / Evergy, Inc. | 0.00 | 0.00 | 0.17 | 1.20 | 0.0039 | -0.0004 | |||
| HOLX / Hologic, Inc. | 0.00 | 46.40 | 0.17 | 31.25 | 0.0038 | 0.0005 | |||
| WTW / Willis Towers Watson Public Limited Company | 0.00 | 0.00 | 0.17 | 0.60 | 0.0038 | -0.0005 | |||
| DOX / Amdocs Limited | 0.00 | 0.00 | 0.17 | 10.60 | 0.0038 | -0.0001 | |||
| FANG / Diamondback Energy, Inc. | 0.00 | 14.94 | 0.16 | 47.22 | 0.0036 | 0.0008 | |||
| PWR / Quanta Services, Inc. | 0.00 | -39.89 | 0.16 | -38.04 | 0.0036 | -0.0030 | |||
| IDA / IDACORP, Inc. | 0.00 | -99.23 | 0.15 | -99.25 | 0.0033 | -0.4973 | |||
| EWBC / East West Bancorp, Inc. | 0.00 | 0.00 | 0.13 | -3.05 | 0.0029 | -0.0005 | |||
| HST / Host Hotels & Resorts, Inc. | 0.01 | 0.00 | 0.12 | 1.64 | 0.0028 | -0.0003 | |||
| UNVR / Univar Solutions Inc | 0.00 | 0.10 | 0.0023 | 0.0023 | |||||
| HRC / Hill-Rom Holdings Inc | 0.00 | 0.00 | 0.09 | 2.38 | 0.0020 | -0.0002 | |||
| ALB / Albemarle Corporation | 0.00 | -46.21 | 0.08 | -37.98 | 0.0018 | -0.0015 | |||
| SABR / Sabre Corporation | 0.00 | 0.00 | 0.04 | -15.09 | 0.0010 | -0.0003 | |||
| 872307903 / TCF Financial Corporation | 0.00 | -100.00 | 0.00 | -100.00 | -0.0049 | ||||
| US7153471005 / Perspecta Inc | 0.00 | -100.00 | 0.00 | -100.00 | -0.2626 | ||||
| QTS / Qts Realty Trust Inc - Class A | 0.00 | -100.00 | 0.00 | -100.00 | -0.9735 | ||||
| TCBK / TriCo Bancshares | 0.00 | -100.00 | 0.00 | -100.00 | -0.8446 | ||||
| TOL / Toll Brothers, Inc. | 0.00 | -100.00 | 0.00 | -100.00 | -0.0083 | ||||
| US4989042001 / Knoll Inc | 0.00 | -100.00 | 0.00 | -100.00 | -0.8619 | ||||
| ONTO / Onto Innovation Inc. | 0.00 | -100.00 | 0.00 | -100.00 | -1.0737 | ||||
| MDC / M.D.C. Holdings, Inc. | 0.00 | -100.00 | 0.00 | -100.00 | -1.1616 | ||||
| J / Jacobs Solutions Inc. | 0.00 | -100.00 | 0.00 | -100.00 | -0.0043 | ||||
| RUSHA / Rush Enterprises, Inc. | 0.00 | -100.00 | 0.00 | -100.00 | -0.9452 | ||||
| US30224P2002 / Extended Stay America Inc | 0.00 | -100.00 | 0.00 | -100.00 | -0.9933 |