Statistik Asas
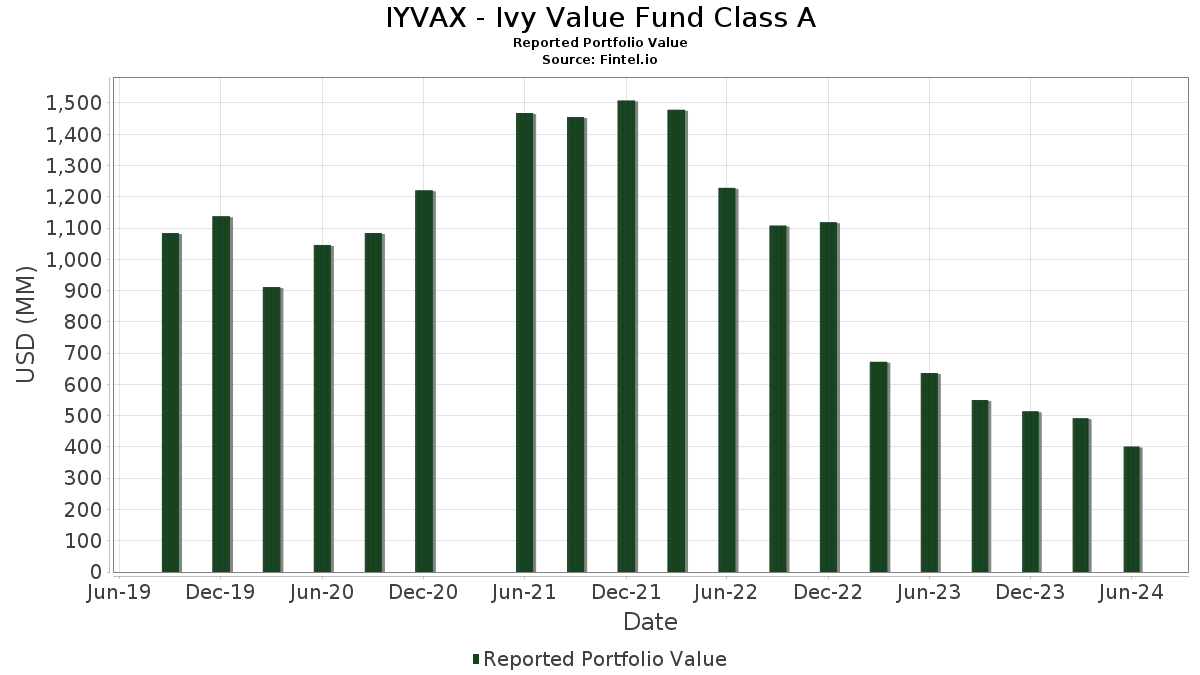
| Nilai Portfolio | $ 400,916,821 |
| Kedudukan Semasa | 38 |
Pegangan Terkini, Prestasi, AUM (dari 13F, 13D)
IYVAX - Ivy Value Fund Class A telah mendedahkan 38 jumlah pegangan dalam pemfailan SEC terkini mereka. Nilai portfolio terkini dikira sebagai $ 400,916,821 USD. Aset Sebenar Di Bawah Pengurusan (AUM) ialah nilai ini ditambah dengan tunai (yang tidak didedahkan). Pegangan teratas IYVAX - Ivy Value Fund Class A ialah Truist Financial Corporation (US:TFC) , Oracle Corporation (US:ORCL) , Exxon Mobil Corporation (US:XOM) , U.S. Bancorp (US:USB) , and Equity Residential (US:EQR) . Kedudukan baharu IYVAX - Ivy Value Fund Class A termasuk Chevron Corporation (US:CVX) , The Hershey Company (US:HSY) , Jacobs Solutions Inc. (US:J) , .
Kenaikan Teratas Suku Tahun Ini
Kami menggunakan perubahan dalam peruntukan portfolio kerana ini adalah metrik yang paling bermakna. Perubahan boleh disebabkan oleh perdagangan atau perubahan dalam harga saham.
| Sekuriti | Saham (MM) |
Nilai (MM$) |
Portfolio % | ΔPortfolio % |
|---|---|---|---|---|
| 0.08 | 12.65 | 3.1549 | 3.1549 | |
| 0.07 | 12.24 | 3.0515 | 3.0515 | |
| 0.09 | 12.10 | 3.0172 | 3.0172 | |
| 0.34 | 13.39 | 3.3371 | 0.4719 | |
| 0.19 | 12.65 | 3.1528 | 0.3879 | |
| 0.09 | 12.94 | 3.2273 | 0.2007 | |
| 0.07 | 12.71 | 3.1676 | 0.1264 | |
| 0.12 | 12.72 | 3.1716 | 0.0784 | |
| 0.18 | 12.73 | 3.1739 | 0.0757 | |
| 0.32 | 12.87 | 3.2077 | 0.0568 |
Penurunan Teratas Suku Tahun Ini
Kami menggunakan perubahan dalam peruntukan portfolio kerana ini adalah metrik yang paling bermakna. Perubahan boleh disebabkan oleh perdagangan atau perubahan dalam harga saham.
| Sekuriti | Saham (MM) |
Nilai (MM$) |
Portfolio % | ΔPortfolio % |
|---|---|---|---|---|
| 0.01 | 1.10 | 0.2744 | -2.7836 | |
| 0.69 | 0.69 | 0.1730 | -0.4529 | |
| 0.69 | 0.69 | 0.1730 | -0.4529 | |
| 0.69 | 0.69 | 0.1730 | -0.4529 | |
| 0.69 | 0.69 | 0.1730 | -0.4529 | |
| 0.07 | 10.33 | 2.5752 | -0.4403 | |
| 0.31 | 10.40 | 2.5932 | -0.3985 | |
| 0.14 | 10.67 | 2.6614 | -0.3920 | |
| 0.03 | 11.29 | 2.8150 | -0.3311 | |
| 0.19 | 11.31 | 2.8209 | -0.3226 |
13F dan Pemfailan Dana
Borang ini telah difailkan pada 2024-08-27 untuk tempoh pelaporan 2024-06-28. Klik ikon pautan untuk melihat sejarah transaksi penuh.
Tingkatkan untuk membuka data premium dan eksport ke Excel ![]() .
.
| Sekuriti | Jenis | Purata Harga Saham | Saham (MM) |
ΔSaham (%) |
ΔSaham (%) |
Nilai ($MM) |
Portfolio (%) |
ΔPortfolio (%) |
|
|---|---|---|---|---|---|---|---|---|---|
| TFC / Truist Financial Corporation | 0.34 | -4.91 | 13.39 | -5.23 | 3.3371 | 0.4719 | |||
| ORCL / Oracle Corporation | 0.09 | -22.82 | 12.94 | -13.24 | 3.2273 | 0.2007 | |||
| XOM / Exxon Mobil Corporation | 0.11 | -20.27 | 12.90 | -21.04 | 3.2173 | -0.0980 | |||
| USB / U.S. Bancorp | 0.32 | -6.73 | 12.87 | -17.16 | 3.2077 | 0.0568 | |||
| EQR / Equity Residential | 0.18 | -24.13 | 12.73 | -16.64 | 3.1739 | 0.0757 | |||
| TJX / The TJX Companies, Inc. | 0.12 | -23.15 | 12.72 | -16.57 | 3.1716 | 0.0784 | |||
| DOV / Dover Corporation | 0.07 | -16.78 | 12.71 | -15.25 | 3.1676 | 0.1264 | |||
| CVX / Chevron Corporation | 0.08 | 12.65 | 3.1549 | 3.1549 | |||||
| DD / DuPont de Nemours, Inc. | 0.16 | -22.15 | 12.65 | -18.27 | 3.1533 | 0.0141 | |||
| CTSH / Cognizant Technology Solutions Corporation | 0.19 | 0.00 | 12.65 | -7.21 | 3.1528 | 0.3879 | |||
| MSI / Motorola Solutions, Inc. | 0.03 | -24.69 | 12.60 | -18.09 | 3.1421 | 0.0207 | |||
| VZ / Verizon Communications Inc. | 0.30 | -15.68 | 12.53 | -17.12 | 3.1239 | 0.0568 | |||
| FIS / Fidelity National Information Services, Inc. | 0.17 | -18.87 | 12.51 | -17.58 | 3.1189 | 0.0400 | |||
| HON / Honeywell International Inc. | 0.06 | -20.47 | 12.45 | -17.25 | 3.1027 | 0.0516 | |||
| CI / The Cigna Group | 0.04 | -9.21 | 12.39 | -17.36 | 3.0887 | 0.0475 | |||
| ALL / The Allstate Corporation | 0.08 | -10.22 | 12.34 | -17.15 | 3.0770 | 0.0551 | |||
| TRV / The Travelers Companies, Inc. | 0.06 | -10.28 | 12.24 | -20.73 | 3.0523 | -0.0808 | |||
| HSY / The Hershey Company | 0.07 | 12.24 | 3.0515 | 3.0515 | |||||
| LOW / Lowe's Companies, Inc. | 0.06 | -5.65 | 12.14 | -18.34 | 3.0266 | 0.0106 | |||
| DIS / The Walt Disney Company | 0.12 | -4.01 | 12.13 | -22.10 | 3.0251 | -0.1349 | |||
| J / Jacobs Solutions Inc. | 0.09 | 12.10 | 3.0172 | 3.0172 | |||||
| DUK / Duke Energy Corporation | 0.12 | -23.68 | 11.99 | -20.90 | 2.9886 | -0.0856 | |||
| MRK / Merck & Co., Inc. | 0.10 | -15.53 | 11.85 | -20.74 | 2.9549 | -0.0788 | |||
| GPC / Genuine Parts Company | 0.08 | -13.37 | 11.65 | -22.66 | 2.9040 | -0.1512 | |||
| TDY / Teledyne Technologies Incorporated | 0.03 | -12.37 | 11.55 | -20.81 | 2.8783 | -0.0790 | |||
| CSCO / Cisco Systems, Inc. | 0.24 | -20.83 | 11.45 | -24.64 | 2.8548 | -0.2273 | |||
| CVS / CVS Health Corporation | 0.19 | -1.39 | 11.31 | -26.98 | 2.8209 | -0.3226 | |||
| NOC / Northrop Grumman Corporation | 0.03 | -20.06 | 11.29 | -27.19 | 2.8150 | -0.3311 | |||
| HOLX / Hologic, Inc. | 0.14 | -25.53 | 10.67 | -29.08 | 2.6614 | -0.3920 | |||
| CAG / Conagra Brands, Inc. | 0.37 | -18.74 | 10.46 | -22.09 | 2.6087 | -0.1155 | |||
| BAX / Baxter International Inc. | 0.31 | -9.88 | 10.40 | -29.47 | 2.5932 | -0.3985 | |||
| JNJ / Johnson & Johnson | 0.07 | -24.79 | 10.33 | -30.51 | 2.5752 | -0.4403 | |||
| DLTR / Dollar Tree, Inc. | 0.10 | -4.60 | 10.19 | -23.50 | 2.5417 | -0.1616 | |||
| AIG / American International Group, Inc. | 0.01 | -92.31 | 1.10 | -92.70 | 0.2744 | -2.7836 | |||
| US38141W2733 / Goldman Sachs Financial Square Funds - Government Fund | 0.69 | -77.51 | 0.69 | -77.50 | 0.1730 | -0.4529 | |||
| FIGXX / Fidelity Colchester Street Trust - Fidelity Institutional Money Market Funds Government Portfolio Class I | 0.69 | -77.51 | 0.69 | -77.50 | 0.1730 | -0.4529 | |||
| TFDXX / Blackrock Liquidity Funds - BlackRock Liquidity Funds FedFund Portfolio Institutional Class | 0.69 | -77.51 | 0.69 | -77.50 | 0.1730 | -0.4529 | |||
| US61747C7074 / Morgan Stanley Institutional Liquidity Funds Government Portfolio, Institutional Class | 0.69 | -77.51 | 0.69 | -77.50 | 0.1730 | -0.4529 |