Statistik Asas
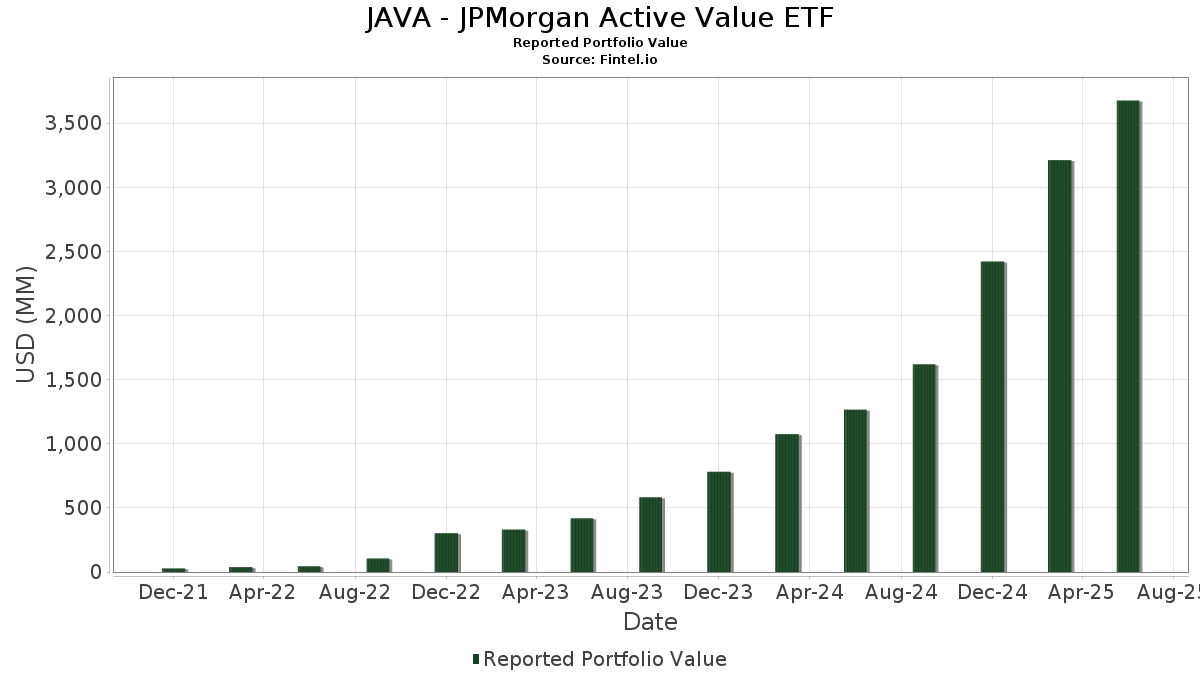
| Nilai Portfolio | $ 3,675,825,421 |
| Kedudukan Semasa | 158 |
Pegangan Terkini, Prestasi, AUM (dari 13F, 13D)
JAVA - JPMorgan Active Value ETF telah mendedahkan 158 jumlah pegangan dalam pemfailan SEC terkini mereka. Nilai portfolio terkini dikira sebagai $ 3,675,825,421 USD. Aset Sebenar Di Bawah Pengurusan (AUM) ialah nilai ini ditambah dengan tunai (yang tidak didedahkan). Pegangan teratas JAVA - JPMorgan Active Value ETF ialah JPMorgan Trust II - JPMorgan U.S. Government Money Market Fund IM (US:MGMXX) , Wells Fargo & Company (US:WFC) , Bank of America Corporation (US:BAC) , Philip Morris International Inc. (US:PM) , and Western Digital Corporation (US:WDC) . Kedudukan baharu JAVA - JPMorgan Active Value ETF termasuk Expand Energy Corporation (US:EXE) , Quest Diagnostics Incorporated (US:DGX) , Omnicom Group Inc. (US:OMC) , Saia, Inc. (US:SAIA) , and Jabil Inc. (US:JBL) .
Kenaikan Teratas Suku Tahun Ini
Kami menggunakan perubahan dalam peruntukan portfolio kerana ini adalah metrik yang paling bermakna. Perubahan boleh disebabkan oleh perdagangan atau perubahan dalam harga saham.
| Sekuriti | Saham (MM) |
Nilai (MM$) |
Portfolio % | ΔPortfolio % |
|---|---|---|---|---|
| 0.25 | 55.53 | 1.5095 | 1.5095 | |
| 0.18 | 56.32 | 1.5310 | 0.8596 | |
| 0.95 | 61.10 | 1.6608 | 0.7776 | |
| 0.21 | 44.97 | 1.2225 | 0.7686 | |
| 0.35 | 53.46 | 1.4532 | 0.7669 | |
| 0.35 | 32.23 | 0.8760 | 0.6163 | |
| 0.31 | 41.79 | 1.1359 | 0.5959 | |
| 0.59 | 40.87 | 1.1109 | 0.5767 | |
| 0.19 | 29.42 | 0.7998 | 0.5548 | |
| 0.35 | 43.60 | 1.1851 | 0.5421 |
Penurunan Teratas Suku Tahun Ini
Kami menggunakan perubahan dalam peruntukan portfolio kerana ini adalah metrik yang paling bermakna. Perubahan boleh disebabkan oleh perdagangan atau perubahan dalam harga saham.
| Sekuriti | Saham (MM) |
Nilai (MM$) |
Portfolio % | ΔPortfolio % |
|---|---|---|---|---|
| 0.09 | 42.56 | 1.1571 | -1.1475 | |
| 0.17 | 53.74 | 1.4609 | -0.8718 | |
| 0.02 | 8.70 | 0.2365 | -0.8105 | |
| 0.25 | 46.70 | 1.2696 | -0.7725 | |
| 0.78 | 36.06 | 0.9801 | -0.7109 | |
| 0.09 | 15.83 | 0.4304 | -0.7058 | |
| 0.12 | 9.08 | 0.2469 | -0.5513 | |
| 0.20 | 19.19 | 0.5218 | -0.5365 | |
| 0.06 | 16.82 | 0.4572 | -0.5332 | |
| 0.18 | 12.16 | 0.3307 | -0.5116 |
13F dan Pemfailan Dana
Borang ini telah difailkan pada 2025-08-26 untuk tempoh pelaporan 2025-06-30. Klik ikon pautan untuk melihat sejarah transaksi penuh.
Tingkatkan untuk membuka data premium dan eksport ke Excel ![]() .
.
| Sekuriti | Jenis | Purata Harga Saham | Saham (MM) |
ΔSaham (%) |
ΔSaham (%) |
Nilai ($MM) |
Portfolio (%) |
ΔPortfolio (%) |
|
|---|---|---|---|---|---|---|---|---|---|
| MGMXX / JPMorgan Trust II - JPMorgan U.S. Government Money Market Fund IM | 128.51 | 19.84 | 128.51 | 19.84 | 3.4932 | 0.1568 | |||
| WFC / Wells Fargo & Company | 1.53 | 11.09 | 122.60 | 23.98 | 3.3327 | 0.2559 | |||
| BAC / Bank of America Corporation | 2.16 | 0.05 | 102.16 | 13.46 | 2.7771 | -0.0246 | |||
| PM / Philip Morris International Inc. | 0.55 | 13.53 | 99.44 | 30.27 | 2.7030 | 0.3280 | |||
| WDC / Western Digital Corporation | 0.95 | 35.99 | 61.10 | 115.24 | 1.6608 | 0.7776 | |||
| RTX / RTX Corporation | 0.42 | 7.81 | 60.93 | 18.85 | 1.6562 | 0.0611 | |||
| CARR / Carrier Global Corporation | 0.82 | 0.97 | 60.34 | 16.56 | 1.6402 | 0.0295 | |||
| CI / The Cigna Group | 0.18 | 12.89 | 58.75 | 13.43 | 1.5972 | -0.0144 | |||
| AXP / American Express Company | 0.18 | 120.16 | 56.32 | 161.02 | 1.5310 | 0.8596 | |||
| AMZN / Amazon.com, Inc. | 0.25 | 55.53 | 1.5095 | 1.5095 | |||||
| UNH / UnitedHealth Group Incorporated | 0.17 | 20.35 | 53.74 | -28.32 | 1.4609 | -0.8718 | |||
| JNJ / Johnson & Johnson | 0.35 | 163.13 | 53.46 | 142.37 | 1.4532 | 0.7669 | |||
| FCNCA / First Citizens BancShares, Inc. | 0.03 | 17.58 | 50.75 | 24.07 | 1.3795 | 0.1068 | |||
| CMCSA / Comcast Corporation | 1.35 | 56.67 | 48.14 | 51.53 | 1.3086 | 0.3201 | |||
| ABBV / AbbVie Inc. | 0.25 | -19.68 | 46.70 | -28.84 | 1.2696 | -0.7725 | |||
| VNX / NXP Semiconductors N.V. | 0.21 | 168.16 | 44.97 | 208.28 | 1.2225 | 0.7686 | |||
| DIS / The Walt Disney Company | 0.35 | 67.90 | 43.60 | 110.96 | 1.1851 | 0.5421 | |||
| BRK.B / Berkshire Hathaway Inc. | 0.09 | -37.00 | 42.56 | -42.53 | 1.1571 | -1.1475 | |||
| EMR / Emerson Electric Co. | 0.31 | 98.00 | 41.79 | 140.78 | 1.1359 | 0.5959 | |||
| NEE / NextEra Energy, Inc. | 0.59 | 143.04 | 40.87 | 138.00 | 1.1109 | 0.5767 | |||
| SCHW / The Charles Schwab Corporation | 0.44 | 10.71 | 39.93 | 29.04 | 1.0854 | 0.1226 | |||
| AMT / American Tower Corporation | 0.17 | 116.51 | 38.43 | 119.93 | 1.0447 | 0.5010 | |||
| BMY / Bristol-Myers Squibb Company | 0.78 | -12.59 | 36.06 | -33.66 | 0.9801 | -0.7109 | |||
| STX / Seagate Technology Holdings plc | 0.25 | 28.70 | 35.80 | 118.68 | 0.9731 | 0.4638 | |||
| XOM / Exxon Mobil Corporation | 0.33 | -16.84 | 35.80 | -24.62 | 0.9731 | -0.5045 | |||
| 3EC / Eaton Corporation plc | 0.10 | 10.79 | 35.58 | 45.51 | 0.9671 | 0.2063 | |||
| BALL / Ball Corporation | 0.63 | 52.86 | 35.40 | 64.66 | 0.9623 | 0.2934 | |||
| MSFT / Microsoft Corporation | 0.07 | 14.34 | 33.70 | 51.50 | 0.9160 | 0.2240 | |||
| VZ / Verizon Communications Inc. | 0.76 | -15.26 | 33.07 | -19.17 | 0.8989 | -0.3739 | |||
| ADI / Analog Devices, Inc. | 0.14 | 10.75 | 32.92 | 30.71 | 0.8949 | 0.1112 | |||
| SO / The Southern Company | 0.35 | 286.62 | 32.23 | 286.11 | 0.8760 | 0.6163 | |||
| MDT / Medtronic plc | 0.37 | 19.35 | 32.17 | 15.78 | 0.8744 | 0.0099 | |||
| COP / ConocoPhillips | 0.35 | -14.34 | 31.85 | -26.81 | 0.8658 | -0.4881 | |||
| HUM / Humana Inc. | 0.13 | 34.03 | 31.47 | 23.84 | 0.8553 | 0.0648 | |||
| EOG / EOG Resources, Inc. | 0.26 | 53.34 | 31.35 | 43.02 | 0.8523 | 0.1702 | |||
| COF / Capital One Financial Corporation | 0.14 | 14.96 | 30.71 | 36.42 | 0.8347 | 0.1344 | |||
| APD / Air Products and Chemicals, Inc. | 0.11 | 17.68 | 29.92 | 12.55 | 0.8134 | -0.0138 | |||
| CVX / Chevron Corporation | 0.21 | -5.41 | 29.86 | -19.03 | 0.8118 | -0.3358 | |||
| TXN / Texas Instruments Incorporated | 0.14 | 10.78 | 29.45 | 27.99 | 0.8007 | 0.0846 | |||
| MMM / 3M Company | 0.19 | 260.49 | 29.42 | 273.72 | 0.7998 | 0.5548 | |||
| R1D / AerCap Holdings N.V. | 0.25 | 11.53 | 29.19 | 27.72 | 0.7934 | 0.0824 | |||
| GD / General Dynamics Corporation | 0.10 | 22.40 | 29.01 | 30.98 | 0.7886 | 0.0994 | |||
| EQT / EQT Corporation | 0.48 | 245.18 | 27.97 | 336.61 | 0.7602 | 0.4958 | |||
| MS / Morgan Stanley | 0.20 | 7.17 | 27.70 | 29.40 | 0.7529 | 0.0869 | |||
| FI / Fiserv, Inc. | 0.16 | 12.76 | 27.69 | -11.97 | 0.7526 | -0.2259 | |||
| LOW / Lowe's Companies, Inc. | 0.12 | 10.77 | 27.41 | 5.37 | 0.7451 | -0.0642 | |||
| LUV / Southwest Airlines Co. | 0.83 | 0.23 | 26.99 | -3.17 | 0.7337 | -0.1336 | |||
| FIS / Fidelity National Information Services, Inc. | 0.33 | 217.08 | 26.97 | 245.67 | 0.7332 | 0.4904 | |||
| CSX / CSX Corporation | 0.83 | -8.24 | 26.96 | 1.73 | 0.7328 | -0.0917 | |||
| DOV / Dover Corporation | 0.14 | 10.76 | 25.47 | 15.52 | 0.6923 | 0.0064 | |||
| MCD / McDonald's Corporation | 0.09 | -3.00 | 25.37 | -9.27 | 0.6895 | -0.1804 | |||
| AGCO / AGCO Corporation | 0.24 | 224.64 | 24.99 | 261.78 | 0.6793 | 0.4644 | |||
| FMC / FMC Corporation | 0.59 | 277.95 | 24.76 | 274.00 | 0.6731 | 0.4671 | |||
| HD / The Home Depot, Inc. | 0.07 | 10.79 | 24.03 | 10.83 | 0.6533 | -0.0214 | |||
| TJX / The TJX Companies, Inc. | 0.19 | 3.09 | 24.00 | 4.53 | 0.6523 | -0.0620 | |||
| GS / The Goldman Sachs Group, Inc. | 0.03 | 10.79 | 23.98 | 43.53 | 0.6518 | 0.1320 | |||
| TSM / Taiwan Semiconductor Manufacturing Company Limited - Depositary Receipt (Common Stock) | 0.10 | 64.82 | 23.51 | 114.78 | 0.6391 | -0.2256 | |||
| D / Dominion Energy, Inc. | 0.41 | 138.03 | 23.45 | 139.94 | 0.6374 | 0.3334 | |||
| VMC / Vulcan Materials Company | 0.09 | 10.78 | 22.27 | 23.84 | 0.6053 | 0.0459 | |||
| PFGC / Performance Food Group Company | 0.24 | -34.34 | 21.23 | -26.96 | 0.5772 | -0.3273 | |||
| AXTA / Axalta Coating Systems Ltd. | 0.71 | -1.18 | 21.10 | -11.55 | 0.5735 | -0.1686 | |||
| DE / Deere & Company | 0.04 | 10.79 | 20.70 | 20.03 | 0.5627 | 0.0261 | |||
| AMP / Ameriprise Financial, Inc. | 0.04 | 108.72 | 20.58 | 130.12 | 0.5594 | 0.2811 | |||
| ELV / Elevance Health, Inc. | 0.05 | 49.83 | 20.53 | 33.98 | 0.5582 | 0.0813 | |||
| PG / The Procter & Gamble Company | 0.13 | 10.78 | 20.09 | 3.56 | 0.5461 | -0.0575 | |||
| CRM / Salesforce, Inc. | 0.07 | 123.01 | 19.74 | 81.89 | 0.5366 | 0.0886 | |||
| UNP / Union Pacific Corporation | 0.08 | 10.80 | 19.32 | 7.91 | 0.5251 | -0.0319 | |||
| WMT / Walmart Inc. | 0.20 | -49.33 | 19.19 | -43.57 | 0.5218 | -0.5365 | |||
| 1JL / Gates Industrial Corporation plc | 0.82 | 37.20 | 18.80 | 71.62 | 0.5110 | 0.1702 | |||
| MTB / M&T Bank Corporation | 0.10 | 11.82 | 18.54 | 21.36 | 0.5041 | 0.0287 | |||
| PH / Parker-Hannifin Corporation | 0.03 | 10.69 | 18.44 | 27.19 | 0.5014 | 0.0502 | |||
| FCX / Freeport-McMoRan Inc. | 0.42 | 53.00 | 18.35 | 74.18 | 0.4988 | 0.0639 | |||
| TMO / Thermo Fisher Scientific Inc. | 0.04 | 87.94 | 18.23 | 53.14 | 0.4957 | 0.1252 | |||
| EXE / Expand Energy Corporation | 0.15 | 18.06 | 0.4910 | 0.4910 | |||||
| PGR / The Progressive Corporation | 0.07 | 29.67 | 17.50 | 22.27 | 0.4756 | 0.0304 | |||
| LH / Labcorp Holdings Inc. | 0.07 | 53.20 | 17.47 | 72.81 | 0.4748 | 0.1603 | |||
| CPAY / Corpay, Inc. | 0.05 | -41.76 | 17.40 | -44.58 | 0.4730 | -0.5039 | |||
| AJG / Arthur J. Gallagher & Co. | 0.05 | -37.30 | 17.32 | -41.86 | 0.4707 | -0.4559 | |||
| KTB / Kontoor Brands, Inc. | 0.26 | 108.50 | 17.17 | 114.49 | 0.4666 | 0.2176 | |||
| CMS / CMS Energy Corporation | 0.25 | 11.27 | 17.07 | 2.63 | 0.4639 | -0.0535 | |||
| CB / Chubb Limited | 0.06 | -44.92 | 16.82 | -47.16 | 0.4572 | -0.5332 | |||
| ARES / Ares Management Corporation | 0.10 | 11.80 | 16.79 | 32.08 | 0.4565 | 0.0609 | |||
| DGX / Quest Diagnostics Incorporated | 0.09 | 16.17 | 0.4395 | 0.4395 | |||||
| SNX / TD SYNNEX Corporation | 0.12 | 90.69 | 16.01 | 148.91 | 0.4351 | 0.2350 | |||
| BX / Blackstone Inc. | 0.11 | -1.49 | 15.84 | 5.42 | 0.4306 | -0.0369 | |||
| CAH / Cardinal Health, Inc. | 0.09 | -64.44 | 15.83 | -56.64 | 0.4304 | -0.7058 | |||
| FITB / Fifth Third Bancorp | 0.37 | 6.55 | 15.39 | 11.80 | 0.4183 | -0.0100 | |||
| AZO / AutoZone, Inc. | 0.00 | -9.86 | 15.38 | -12.23 | 0.4180 | -0.1271 | |||
| BSX / Boston Scientific Corporation | 0.14 | 4.41 | 15.22 | 11.17 | 0.4138 | -0.0123 | |||
| EQIX / Equinix, Inc. | 0.02 | 27.94 | 14.97 | 7.94 | 0.4070 | -0.1656 | |||
| ELS / Equity LifeStyle Properties, Inc. | 0.24 | -8.97 | 14.91 | -15.83 | 0.4053 | -0.1459 | |||
| FHN / First Horizon Corporation | 0.69 | 57.06 | 14.71 | 71.46 | 0.3998 | 0.1329 | |||
| MHK / Mohawk Industries, Inc. | 0.14 | -15.24 | 14.53 | -22.17 | 0.3949 | -0.1859 | |||
| META / Meta Platforms, Inc. | 0.02 | 19.69 | 14.49 | 53.28 | 0.3938 | 0.0997 | |||
| BLK / BlackRock, Inc. | 0.01 | -7.73 | 14.48 | 2.29 | 0.3937 | -0.0468 | |||
| MRK / Merck & Co., Inc. | 0.18 | 95.40 | 14.31 | 72.33 | 0.3889 | 0.1306 | |||
| CVS / CVS Health Corporation | 0.20 | -20.00 | 14.11 | -18.55 | 0.3837 | -0.1555 | |||
| AMH / American Homes 4 Rent | 0.39 | -1.74 | 13.96 | -6.25 | 0.3793 | -0.0838 | |||
| OMC / Omnicom Group Inc. | 0.19 | 13.87 | 0.3769 | 0.3769 | |||||
| BA / The Boeing Company | 0.07 | 2.65 | 13.68 | 26.12 | 0.3717 | 0.0344 | |||
| MDLZ / Mondelez International, Inc. | 0.20 | 10.78 | 13.51 | 10.11 | 0.3674 | -0.0145 | |||
| PEG / Public Service Enterprise Group Incorporated | 0.16 | -22.11 | 13.35 | -20.33 | 0.3629 | -0.1584 | |||
| SAIA / Saia, Inc. | 0.05 | 13.32 | 0.3621 | 0.3621 | |||||
| PEP / PepsiCo, Inc. | 0.10 | 44.02 | 13.27 | 26.83 | 0.3606 | 0.0352 | |||
| IBM / International Business Machines Corporation | 0.04 | 2.40 | 12.91 | 21.40 | 0.3509 | 0.0200 | |||
| PNC / The PNC Financial Services Group, Inc. | 0.07 | -23.50 | 12.42 | -18.87 | 0.3376 | -0.1387 | |||
| OSCR / Oscar Health, Inc. | 0.58 | -38.35 | 12.38 | 0.82 | 0.3365 | -0.0455 | |||
| XEL / Xcel Energy Inc. | 0.18 | -53.29 | 12.16 | -55.07 | 0.3307 | -0.5116 | |||
| CCL / Carnival Corporation & plc | 0.43 | -31.62 | 12.05 | -1.54 | 0.3276 | -0.0532 | |||
| UPS / United Parcel Service, Inc. | 0.12 | -11.42 | 11.96 | -18.71 | 0.3252 | -0.1327 | |||
| VTR / Ventas, Inc. | 0.19 | 10.77 | 11.92 | 1.73 | 0.3241 | -0.0405 | |||
| MTG / MGIC Investment Corporation | 0.42 | 180.85 | 11.78 | 205.47 | 0.3203 | 0.0822 | |||
| NOC / Northrop Grumman Corporation | 0.02 | 10.93 | 11.77 | 8.33 | 0.3199 | -0.0181 | |||
| RSK / Arch Capital Group Ltd. | 0.13 | -14.40 | 11.64 | -18.97 | 0.3165 | -0.1305 | |||
| VRTX / Vertex Pharmaceuticals Incorporated | 0.03 | 10.91 | 11.46 | 1.84 | 0.3115 | -0.0386 | |||
| ORLY / O'Reilly Automotive, Inc. | 0.13 | 1,346.27 | 11.44 | -9.01 | 0.3110 | -0.0802 | |||
| WCC / WESCO International, Inc. | 0.06 | 108.25 | 11.22 | 148.35 | 0.3050 | 0.1644 | |||
| MU / Micron Technology, Inc. | 0.09 | 10.80 | 11.18 | 57.17 | 0.3040 | 0.0826 | |||
| TXT / Textron Inc. | 0.14 | -40.77 | 10.86 | -34.17 | 0.2951 | -0.2181 | |||
| AMD / Advanced Micro Devices, Inc. | 0.08 | 1.25 | 10.73 | 39.83 | 0.2916 | 0.0529 | |||
| BDX / Becton, Dickinson and Company | 0.06 | 27.68 | 10.67 | -3.99 | 0.2901 | -0.0557 | |||
| BKNG / Booking Holdings Inc. | 0.00 | 21.54 | 10.62 | 52.74 | 0.2886 | 0.0723 | |||
| SNDK / Sandisk Corporation | 0.22 | 285.03 | 10.19 | 266.85 | 0.2770 | 0.1906 | |||
| HST / Host Hotels & Resorts, Inc. | 0.66 | 71.23 | 10.18 | 85.09 | 0.2768 | 0.1056 | |||
| JBL / Jabil Inc. | 0.05 | 10.07 | 0.2739 | 0.2739 | |||||
| BJ / BJ's Wholesale Club Holdings, Inc. | 0.09 | -23.99 | 9.92 | -28.17 | 0.2697 | -0.1600 | |||
| LLY / Eli Lilly and Company | 0.01 | 34.56 | 9.87 | 27.00 | 0.2682 | 0.0265 | |||
| CFG / Citizens Financial Group, Inc. | 0.22 | 9.82 | 0.2668 | 0.2668 | |||||
| SLGN / Silgan Holdings Inc. | 0.18 | -18.29 | 9.82 | -13.40 | 0.2668 | -0.0858 | |||
| WEX / WEX Inc. | 0.07 | -12.74 | 9.70 | -18.36 | 0.2636 | -0.1060 | |||
| ETR / Entergy Corporation | 0.11 | 34.56 | 9.50 | 30.84 | 0.2581 | 0.0323 | |||
| ALGN / Align Technology, Inc. | 0.05 | 9.48 | 0.2576 | 0.2576 | |||||
| AA / Alcoa Corporation | 0.31 | 6.65 | 9.28 | 3.19 | 0.2524 | -0.0276 | |||
| CTSH / Cognizant Technology Solutions Corporation | 0.12 | -53.71 | 9.08 | -53.03 | 0.2469 | -0.5513 | |||
| HSY / The Hershey Company | 0.05 | 8.92 | 0.2425 | 0.2425 | |||||
| ALLY / Ally Financial Inc. | 0.22 | 8.76 | 0.2382 | 0.2382 | |||||
| REGN / Regeneron Pharmaceuticals, Inc. | 0.02 | -68.76 | 8.70 | -74.14 | 0.2365 | -0.8105 | |||
| GOOG / Alphabet Inc. | 0.05 | 10.72 | 8.62 | 25.72 | 0.2344 | 0.0210 | |||
| Amrize Ltd. / EC (CH1430134226) | 0.17 | 8.61 | 0.2340 | 0.2340 | |||||
| ON / ON Semiconductor Corporation | 0.16 | 1,153.16 | 8.49 | 606.74 | 0.2308 | 0.0246 | |||
| CMA / Comerica Incorporated | 0.14 | 11.33 | 8.43 | 12.44 | 0.2293 | -0.0041 | |||
| LRCX / Lam Research Corporation | 0.08 | 8.19 | 0.2227 | 0.2227 | |||||
| RSG / Republic Services, Inc. | 0.03 | 10.72 | 8.14 | 12.75 | 0.2214 | -0.0034 | |||
| HWM / Howmet Aerospace Inc. | 0.04 | 19.09 | 7.75 | 224.00 | 0.2107 | -0.0116 | |||
| RRC / Range Resources Corporation | 0.19 | 7.71 | 0.2096 | 0.2096 | |||||
| GLW / Corning Incorporated | 0.14 | 125,988.60 | 7.56 | 151,080.00 | 0.2055 | 0.2053 | |||
| MIDD / The Middleby Corporation | 0.05 | 36.75 | 7.43 | 45.39 | 0.2019 | -0.0090 | |||
| HES / Hess Corporation | 0.05 | -10.22 | 7.36 | -22.14 | 0.2001 | -0.0941 | |||
| EIX / Edison International | 0.14 | 27.01 | 7.17 | 11.21 | 0.1950 | -0.0057 | |||
| TRV / The Travelers Companies, Inc. | 0.02 | -32.32 | 6.30 | -31.54 | 0.1712 | -0.1150 | |||
| PLD / Prologis, Inc. | 0.06 | 10.82 | 5.99 | 4.21 | 0.1627 | -0.0160 | |||
| CC / The Chemours Company | 0.52 | -43.37 | 5.90 | -52.08 | 0.1603 | -0.2226 | |||
| Z / Zillow Group, Inc. | 0.08 | -7.99 | 5.52 | -6.00 | 0.1500 | -0.0326 | |||
| AVB / AvalonBay Communities, Inc. | 0.03 | 10.69 | 5.38 | 4.96 | 0.1462 | -0.0132 | |||
| DOW / Dow Inc. | 0.19 | 5.03 | 0.1368 | 0.1368 | |||||
| IQV / IQVIA Holdings Inc. | 0.03 | 4.96 | 0.1348 | 0.1348 | |||||
| GM / General Motors Company | 0.09 | 277.55 | 4.52 | 464.09 | 0.1230 | -0.0148 | |||
| IP / International Paper Company | 0.07 | 3.50 | 0.0951 | 0.0951 |