Statistik Asas
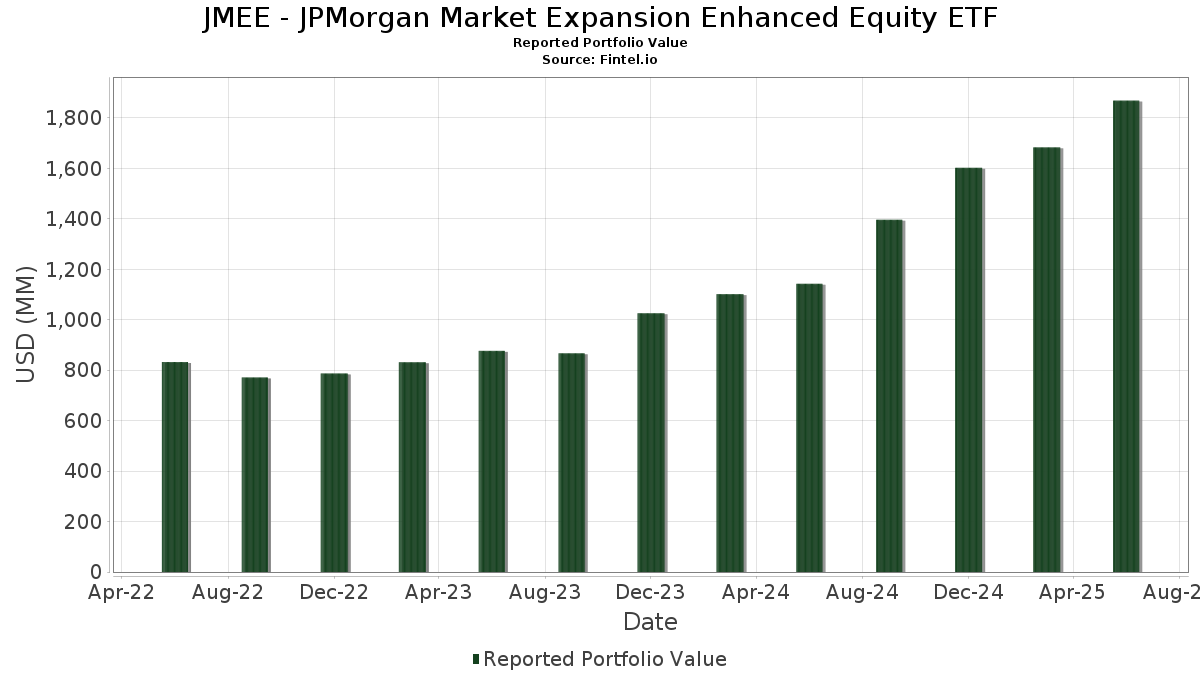
| Nilai Portfolio | $ 1,868,833,688 |
| Kedudukan Semasa | 610 |
Pegangan Terkini, Prestasi, AUM (dari 13F, 13D)
JMEE - JPMorgan Market Expansion Enhanced Equity ETF telah mendedahkan 610 jumlah pegangan dalam pemfailan SEC terkini mereka. Nilai portfolio terkini dikira sebagai $ 1,868,833,688 USD. Aset Sebenar Di Bawah Pengurusan (AUM) ialah nilai ini ditambah dengan tunai (yang tidak didedahkan). Pegangan teratas JMEE - JPMorgan Market Expansion Enhanced Equity ETF ialah JPMorgan Trust II - JPMorgan U.S. Government Money Market Fund IM (US:MGMXX) , JPMorgan Securities Lending Money Market Fund, Class Agency SL Shares (US:46645V642) , Exelixis, Inc. (US:EXEL) , Coherent Corp. (US:COHR) , and AECOM (US:ACM) . Kedudukan baharu JMEE - JPMorgan Market Expansion Enhanced Equity ETF termasuk Sandisk Corporation (US:SNDK) , Impinj, Inc. (US:PI) , CAVA Group, Inc. (US:CAVA) , Safety Insurance Group, Inc. (US:SAFT) , and MACOM Technology Solutions Holdings, Inc. (US:MTSI) .
Kenaikan Teratas Suku Tahun Ini
Kami menggunakan perubahan dalam peruntukan portfolio kerana ini adalah metrik yang paling bermakna. Perubahan boleh disebabkan oleh perdagangan atau perubahan dalam harga saham.
| Sekuriti | Saham (MM) |
Nilai (MM$) |
Portfolio % | ΔPortfolio % |
|---|---|---|---|---|
| 29.42 | 29.42 | 1.5995 | 0.8713 | |
| 0.02 | 7.60 | 0.4133 | 0.3624 | |
| 0.16 | 6.33 | 0.3443 | 0.3074 | |
| 0.02 | 9.67 | 0.5257 | 0.3054 | |
| 0.11 | 5.07 | 0.2755 | 0.2755 | |
| 0.04 | 4.82 | 0.2620 | 0.2620 | |
| 0.03 | 6.64 | 0.3608 | 0.2518 | |
| 0.10 | 9.75 | 0.5301 | 0.2407 | |
| 0.04 | 9.67 | 0.5256 | 0.2404 | |
| 0.05 | 7.90 | 0.4295 | 0.2360 |
Penurunan Teratas Suku Tahun Ini
Kami menggunakan perubahan dalam peruntukan portfolio kerana ini adalah metrik yang paling bermakna. Perubahan boleh disebabkan oleh perdagangan atau perubahan dalam harga saham.
| Sekuriti | Saham (MM) |
Nilai (MM$) |
Portfolio % | ΔPortfolio % |
|---|---|---|---|---|
| 53.19 | 53.19 | 2.8913 | -1.5621 | |
| 0.01 | 2.78 | 0.1514 | -0.3419 | |
| 0.02 | 2.59 | 0.1407 | -0.2778 | |
| 0.08 | 6.50 | 0.3535 | -0.2352 | |
| 0.02 | 5.77 | 0.3137 | -0.2188 | |
| 0.01 | 1.87 | 0.1019 | -0.2127 | |
| 0.01 | 1.00 | 0.0544 | -0.2087 | |
| 0.07 | 2.07 | 0.1124 | -0.2002 | |
| 0.09 | 4.30 | 0.2336 | -0.1849 | |
| 0.03 | 2.06 | 0.1123 | -0.1844 |
13F dan Pemfailan Dana
Borang ini telah difailkan pada 2025-08-26 untuk tempoh pelaporan 2025-06-30. Klik ikon pautan untuk melihat sejarah transaksi penuh.
Tingkatkan untuk membuka data premium dan eksport ke Excel ![]() .
.
| Sekuriti | Jenis | Purata Harga Saham | Saham (MM) |
ΔSaham (%) |
ΔSaham (%) |
Nilai ($MM) |
Portfolio (%) |
ΔPortfolio (%) |
|
|---|---|---|---|---|---|---|---|---|---|
| MGMXX / JPMorgan Trust II - JPMorgan U.S. Government Money Market Fund IM | 53.19 | -28.85 | 53.19 | -28.85 | 2.8913 | -1.5621 | |||
| 46645V642 / JPMorgan Securities Lending Money Market Fund, Class Agency SL Shares | 29.42 | 140.69 | 29.42 | 140.70 | 1.5995 | 0.8713 | |||
| EXEL / Exelixis, Inc. | 0.28 | 3.41 | 12.39 | 23.45 | 0.6735 | 0.0756 | |||
| COHR / Coherent Corp. | 0.13 | 3.40 | 12.01 | 42.04 | 0.6531 | 0.1492 | |||
| ACM / AECOM | 0.10 | 3.42 | 11.33 | 25.88 | 0.6159 | 0.0797 | |||
| RS / Reliance, Inc. | 0.03 | -1.53 | 10.44 | 7.05 | 0.5675 | -0.0135 | |||
| UTHR / United Therapeutics Corporation | 0.04 | 3.38 | 10.08 | -3.64 | 0.5482 | -0.0752 | |||
| IBKR / Interactive Brokers Group, Inc. | 0.18 | 352.77 | 10.02 | 51.51 | 0.5446 | 0.1507 | |||
| WWD / Woodward, Inc. | 0.04 | 3.37 | 9.86 | 38.83 | 0.5360 | 0.1129 | |||
| FOUR / Shift4 Payments, Inc. | 0.10 | 65.46 | 9.75 | 100.70 | 0.5301 | 0.2407 | |||
| GGG / Graco Inc. | 0.11 | 3.43 | 9.68 | 6.47 | 0.5263 | -0.0154 | |||
| FIX / Comfort Systems USA, Inc. | 0.02 | 57.19 | 9.67 | 161.52 | 0.5257 | 0.3054 | |||
| GWRE / Guidewire Software, Inc. | 0.04 | 60.70 | 9.67 | 101.96 | 0.5256 | 0.2404 | |||
| FN / Fabrinet | 0.03 | 3.46 | 9.40 | 54.37 | 0.5112 | 0.1483 | |||
| CACI / CACI International Inc | 0.02 | 33.35 | 9.00 | 73.25 | 0.4895 | 0.1799 | |||
| JLL / Jones Lang LaSalle Incorporated | 0.03 | 16.16 | 8.93 | 19.86 | 0.4852 | 0.0415 | |||
| EHC / Encompass Health Corporation | 0.07 | 3.39 | 8.89 | 25.19 | 0.4832 | 0.0602 | |||
| CASY / Casey's General Stores, Inc. | 0.02 | 14.85 | 8.84 | 35.03 | 0.4808 | 0.0906 | |||
| USFD / US Foods Holding Corp. | 0.11 | 3.40 | 8.64 | 21.64 | 0.4697 | 0.0466 | |||
| NVT / nVent Electric plc | 0.11 | 3.43 | 8.33 | 44.54 | 0.4529 | 0.1095 | |||
| OGE / OGE Energy Corp. | 0.18 | 3.42 | 8.19 | -0.13 | 0.4453 | -0.0433 | |||
| OC / Owens Corning | 0.06 | 19.21 | 8.15 | 14.79 | 0.4431 | 0.0201 | |||
| MLI / Mueller Industries, Inc. | 0.10 | 3.40 | 8.13 | 7.93 | 0.4417 | -0.0068 | |||
| MASI / Masimo Corporation | 0.05 | 3.45 | 8.06 | 4.46 | 0.4382 | -0.0215 | |||
| CUBE / CubeSmart | 0.19 | 3.41 | 7.94 | 2.89 | 0.4314 | -0.0280 | |||
| MTZ / MasTec, Inc. | 0.05 | 66.56 | 7.90 | 143.23 | 0.4295 | 0.2360 | |||
| PSTG / Pure Storage, Inc. | 0.13 | 3.42 | 7.70 | 34.53 | 0.4188 | 0.0776 | |||
| PFGC / Performance Food Group Company | 0.09 | 3.40 | 7.63 | 15.02 | 0.4145 | 0.0196 | |||
| CW / Curtiss-Wright Corporation | 0.02 | 477.91 | 7.60 | 790.28 | 0.4133 | 0.3624 | |||
| CLH / Clean Harbors, Inc. | 0.03 | 3.38 | 7.53 | 21.27 | 0.4095 | 0.0394 | |||
| WBS / Webster Financial Corporation | 0.14 | 3.41 | 7.52 | 9.52 | 0.4091 | -0.0002 | |||
| BURL / Burlington Stores, Inc. | 0.03 | 29.02 | 7.47 | 25.94 | 0.4062 | 0.0527 | |||
| DCI / Donaldson Company, Inc. | 0.11 | 3.43 | 7.37 | 6.96 | 0.4009 | -0.0098 | |||
| WTS / Watts Water Technologies, Inc. | 0.03 | 3.44 | 7.27 | 24.74 | 0.3950 | 0.0480 | |||
| EQH / Equitable Holdings, Inc. | 0.13 | 3.42 | 7.23 | 11.39 | 0.3928 | 0.0063 | |||
| UNM / Unum Group | 0.09 | -7.34 | 7.18 | -8.15 | 0.3905 | -0.0754 | |||
| TMDX / TransMedics Group, Inc. | 0.05 | 3.44 | 7.10 | 106.06 | 0.3861 | 0.1808 | |||
| RGA / Reinsurance Group of America, Incorporated | 0.04 | -18.59 | 7.09 | -17.98 | 0.3854 | -0.1296 | |||
| WEX / WEX Inc. | 0.05 | 3.44 | 7.06 | -3.23 | 0.3838 | -0.0508 | |||
| HALO / Halozyme Therapeutics, Inc. | 0.13 | 3.43 | 6.89 | -15.68 | 0.3743 | -0.1122 | |||
| EGP / EastGroup Properties, Inc. | 0.04 | -5.87 | 6.88 | -10.70 | 0.3739 | -0.0849 | |||
| DBX / Dropbox, Inc. | 0.24 | 3.40 | 6.87 | 10.73 | 0.3737 | 0.0038 | |||
| EME / EMCOR Group, Inc. | 0.01 | 3.34 | 6.79 | 49.56 | 0.3693 | 0.0987 | |||
| SFM / Sprouts Farmers Market, Inc. | 0.04 | 20.79 | 6.79 | 30.29 | 0.3693 | 0.0587 | |||
| RRC / Range Resources Corporation | 0.17 | 3.41 | 6.72 | 5.33 | 0.3654 | -0.0148 | |||
| JEF / Jefferies Financial Group Inc. | 0.12 | 36.56 | 6.71 | 39.41 | 0.3646 | 0.0780 | |||
| BRX / Brixmor Property Group Inc. | 0.26 | -7.86 | 6.70 | -9.63 | 0.3644 | -0.0775 | |||
| EWBC / East West Bancorp, Inc. | 0.07 | -21.21 | 6.65 | -11.36 | 0.3614 | -0.0854 | |||
| DY / Dycom Industries, Inc. | 0.03 | 126.14 | 6.64 | 262.82 | 0.3608 | 0.2518 | |||
| PCTY / Paylocity Holding Corporation | 0.04 | 3.36 | 6.63 | -0.03 | 0.3603 | -0.0347 | |||
| PTGX / Protagonist Therapeutics, Inc. | 0.12 | 3.40 | 6.62 | 18.18 | 0.3598 | 0.0261 | |||
| MANH / Manhattan Associates, Inc. | 0.03 | 3.44 | 6.57 | 18.04 | 0.3571 | 0.0256 | |||
| FHN / First Horizon Corporation | 0.31 | -11.29 | 6.56 | -3.16 | 0.3567 | -0.0469 | |||
| DOCU / DocuSign, Inc. | 0.08 | -31.23 | 6.50 | -34.19 | 0.3535 | -0.2352 | |||
| TTMI / TTM Technologies, Inc. | 0.16 | 529.16 | 6.33 | 1,956.17 | 0.3443 | 0.3074 | |||
| THC / Tenet Healthcare Corporation | 0.04 | 3.43 | 6.31 | 35.35 | 0.3429 | 0.0653 | |||
| BJ / BJ's Wholesale Club Holdings, Inc. | 0.06 | -9.06 | 6.28 | -14.05 | 0.3416 | -0.0940 | |||
| ALLY / Ally Financial Inc. | 0.16 | 46.45 | 6.25 | 56.43 | 0.3398 | 0.1017 | |||
| UGI / UGI Corporation | 0.17 | 3.42 | 6.24 | 13.88 | 0.3390 | 0.0128 | |||
| GMED / Globus Medical, Inc. | 0.10 | 3.42 | 6.15 | -16.62 | 0.3346 | -0.1052 | |||
| ARW / Arrow Electronics, Inc. | 0.05 | 3.37 | 6.09 | 26.85 | 0.3313 | 0.0451 | |||
| FNF / Fidelity National Financial, Inc. | 0.11 | 11.02 | 6.08 | -4.37 | 0.3307 | -0.0483 | |||
| ITT / ITT Inc. | 0.04 | 3.39 | 6.08 | 25.54 | 0.3303 | 0.0420 | |||
| SNX / TD SYNNEX Corporation | 0.04 | 3.36 | 5.98 | 34.94 | 0.3252 | 0.0611 | |||
| DT / Dynatrace, Inc. | 0.11 | 3.42 | 5.81 | 21.10 | 0.3161 | 0.0301 | |||
| CSL / Carlisle Companies Incorporated | 0.02 | -41.13 | 5.77 | -35.44 | 0.3137 | -0.2188 | |||
| MARA / MARA Holdings, Inc. | 0.37 | 212.11 | 5.76 | 325.65 | 0.3131 | 0.2325 | |||
| SLM / SLM Corporation | 0.17 | 24.26 | 5.65 | 38.71 | 0.3070 | 0.0645 | |||
| KBR / KBR, Inc. | 0.12 | 3.42 | 5.64 | -0.48 | 0.3067 | -0.0310 | |||
| TOL / Toll Brothers, Inc. | 0.05 | -8.90 | 5.63 | -1.52 | 0.3061 | -0.0345 | |||
| RBA / RB Global, Inc. | 0.05 | 3.35 | 5.61 | 9.42 | 0.3049 | -0.0005 | |||
| EPRT / Essential Properties Realty Trust, Inc. | 0.18 | -2.18 | 5.60 | -4.36 | 0.3042 | -0.0444 | |||
| BWXT / BWX Technologies, Inc. | 0.04 | 3.42 | 5.54 | 51.01 | 0.3013 | 0.0827 | |||
| AEIS / Advanced Energy Industries, Inc. | 0.04 | 103.66 | 5.51 | 183.19 | 0.2994 | 0.1835 | |||
| RMBS / Rambus Inc. | 0.09 | 54.30 | 5.50 | 90.84 | 0.2989 | 0.1272 | |||
| BRC / Brady Corporation | 0.08 | 3.41 | 5.49 | -0.49 | 0.2985 | -0.0303 | |||
| AMH / American Homes 4 Rent | 0.15 | -4.41 | 5.48 | -8.81 | 0.2981 | -0.0601 | |||
| SWX / Southwest Gas Holdings, Inc. | 0.07 | 193.44 | 5.45 | 204.13 | 0.2962 | 0.1894 | |||
| MTDR / Matador Resources Company | 0.11 | -13.94 | 5.40 | -19.62 | 0.2937 | -0.1067 | |||
| GVA / Granite Construction Incorporated | 0.06 | 64.18 | 5.36 | 103.61 | 0.2914 | 0.1346 | |||
| LOPE / Grand Canyon Education, Inc. | 0.03 | 3.47 | 5.32 | 13.01 | 0.2890 | 0.0088 | |||
| NBIX / Neurocrine Biosciences, Inc. | 0.04 | 3.41 | 5.31 | 17.54 | 0.2885 | 0.0195 | |||
| RBC / RBC Bearings Incorporated | 0.01 | 3.40 | 5.27 | 23.67 | 0.2866 | 0.0326 | |||
| FND / Floor & Decor Holdings, Inc. | 0.07 | 225.40 | 5.24 | 207.21 | 0.2849 | 0.1833 | |||
| AMG / Affiliated Managers Group, Inc. | 0.03 | -14.86 | 5.22 | -0.31 | 0.2836 | -0.0281 | |||
| RPM / RPM International Inc. | 0.05 | 3.42 | 5.18 | -1.80 | 0.2816 | -0.0327 | |||
| OVV / Ovintiv Inc. | 0.14 | 3.41 | 5.16 | -8.07 | 0.2806 | -0.0539 | |||
| INGR / Ingredion Incorporated | 0.04 | 3.46 | 5.15 | 3.79 | 0.2801 | -0.0157 | |||
| IRDM / Iridium Communications Inc. | 0.17 | 3.42 | 5.12 | 14.20 | 0.2786 | 0.0113 | |||
| SNDK / Sandisk Corporation | 0.11 | 5.07 | 0.2755 | 0.2755 | |||||
| ONB / Old National Bancorp | 0.24 | 3.41 | 5.04 | 4.13 | 0.2742 | -0.0143 | |||
| CCK / Crown Holdings, Inc. | 0.05 | -3.31 | 5.03 | 11.57 | 0.2732 | 0.0048 | |||
| UFPI / UFP Industries, Inc. | 0.05 | -6.18 | 4.97 | -12.91 | 0.2703 | -0.0698 | |||
| SNV / Synovus Financial Corp. | 0.10 | 22.43 | 4.95 | 35.54 | 0.2691 | 0.0516 | |||
| LITE / Lumentum Holdings Inc. | 0.05 | 3.42 | 4.95 | 57.72 | 0.2689 | 0.0820 | |||
| FUL / H.B. Fuller Company | 0.08 | 64.42 | 4.92 | 76.25 | 0.2675 | 0.1012 | |||
| SITM / SiTime Corporation | 0.02 | 212.14 | 4.90 | 335.05 | 0.2666 | 0.1994 | |||
| LRN / Stride, Inc. | 0.03 | 152.90 | 4.87 | 190.23 | 0.2649 | 0.1649 | |||
| MSA / MSA Safety Incorporated | 0.03 | 3.38 | 4.83 | 18.08 | 0.2627 | 0.0189 | |||
| SCI / Service Corporation International | 0.06 | 3.43 | 4.83 | 4.98 | 0.2624 | -0.0115 | |||
| PI / Impinj, Inc. | 0.04 | 4.82 | 0.2620 | 0.2620 | |||||
| MKSI / MKS Inc. | 0.05 | 80.10 | 4.74 | 123.23 | 0.2576 | 0.1311 | |||
| PEN / Penumbra, Inc. | 0.02 | 3.46 | 4.72 | -0.72 | 0.2565 | -0.0266 | |||
| NYT / The New York Times Company | 0.08 | 3.40 | 4.68 | 16.69 | 0.2543 | 0.0155 | |||
| ARMK / Aramark | 0.11 | -22.79 | 4.67 | -6.35 | 0.2541 | -0.0433 | |||
| POST / Post Holdings, Inc. | 0.04 | 3.41 | 4.61 | -3.11 | 0.2505 | -0.0328 | |||
| VOYA / Voya Financial, Inc. | 0.06 | 33.76 | 4.57 | 40.15 | 0.2484 | 0.0542 | |||
| PGNY / Progyny, Inc. | 0.21 | 3.42 | 4.56 | 1.83 | 0.2479 | -0.0188 | |||
| SF / Stifel Financial Corp. | 0.04 | 3.39 | 4.55 | 13.85 | 0.2471 | 0.0092 | |||
| BL / BlackLine, Inc. | 0.08 | 3.39 | 4.54 | 20.90 | 0.2466 | 0.0231 | |||
| CHDN / Churchill Downs Incorporated | 0.04 | 3.40 | 4.53 | -5.99 | 0.2465 | -0.0408 | |||
| XPO / XPO, Inc. | 0.04 | 3.43 | 4.52 | 21.42 | 0.2459 | 0.0240 | |||
| JAZZ / Jazz Pharmaceuticals plc | 0.04 | 3.40 | 4.50 | -11.61 | 0.2446 | -0.0587 | |||
| BWA / BorgWarner Inc. | 0.13 | 69.31 | 4.48 | 97.88 | 0.2438 | 0.1088 | |||
| NMIH / NMI Holdings, Inc. | 0.11 | 3.43 | 4.48 | 21.03 | 0.2438 | 0.0231 | |||
| CART / Maplebear Inc. | 0.10 | 39.76 | 4.46 | 58.51 | 0.2426 | 0.0749 | |||
| LECO / Lincoln Electric Holdings, Inc. | 0.02 | 3.37 | 4.44 | 13.30 | 0.2413 | 0.0079 | |||
| WD / Walker & Dunlop, Inc. | 0.06 | 94.74 | 4.44 | 60.82 | 0.2412 | 0.0768 | |||
| LNW / Light & Wonder, Inc. | 0.05 | 3.41 | 4.43 | 14.93 | 0.2410 | 0.0112 | |||
| TPH / Tri Pointe Homes, Inc. | 0.14 | 139.77 | 4.42 | 140.05 | 0.2401 | 0.1305 | |||
| BLD / TopBuild Corp. | 0.01 | -6.75 | 4.39 | -1.02 | 0.2384 | -0.0255 | |||
| SON / Sonoco Products Company | 0.10 | 3.42 | 4.38 | -4.64 | 0.2380 | -0.0355 | |||
| BCC / Boise Cascade Company | 0.05 | 56.52 | 4.37 | 38.52 | 0.2375 | 0.0496 | |||
| CR / Crane Company | 0.02 | 3.35 | 4.32 | 28.12 | 0.2348 | 0.0340 | |||
| KMPR / Kemper Corporation | 0.07 | 3.43 | 4.31 | -0.14 | 0.2340 | -0.0228 | |||
| FR / First Industrial Realty Trust, Inc. | 0.09 | -31.41 | 4.30 | -38.83 | 0.2336 | -0.1849 | |||
| LAMR / Lamar Advertising Company | 0.04 | 3.35 | 4.30 | 10.24 | 0.2335 | 0.0014 | |||
| ILMN / Illumina, Inc. | 0.04 | 3.39 | 4.29 | 24.35 | 0.2332 | 0.0277 | |||
| HAE / Haemonetics Corporation | 0.06 | 3.41 | 4.27 | 21.44 | 0.2319 | 0.0226 | |||
| CHRD / Chord Energy Corporation | 0.04 | 3.38 | 4.24 | -11.18 | 0.2308 | -0.0539 | |||
| OPCH / Option Care Health, Inc. | 0.13 | 3.41 | 4.24 | -3.88 | 0.2302 | -0.0323 | |||
| CFR / Cullen/Frost Bankers, Inc. | 0.03 | -22.96 | 4.23 | -20.90 | 0.2299 | -0.0886 | |||
| RRX / Regal Rexnord Corporation | 0.03 | 3.36 | 4.21 | 31.61 | 0.2288 | 0.0383 | |||
| MEDP / Medpace Holdings, Inc. | 0.01 | 3.48 | 4.20 | 6.62 | 0.2285 | -0.0064 | |||
| LAD / Lithia Motors, Inc. | 0.01 | 3.41 | 4.20 | 19.01 | 0.2284 | 0.0181 | |||
| ATI / ATI Inc. | 0.05 | -11.36 | 4.19 | 47.12 | 0.2276 | 0.0580 | |||
| LUMN / Lumen Technologies, Inc. | 0.95 | 233.16 | 4.18 | 272.40 | 0.2274 | 0.1604 | |||
| CHWY / Chewy, Inc. | 0.10 | 13.19 | 4.17 | 48.38 | 0.2268 | 0.0593 | |||
| TTEK / Tetra Tech, Inc. | 0.12 | 3.41 | 4.16 | 27.15 | 0.2261 | 0.0312 | |||
| CARG / CarGurus, Inc. | 0.12 | 3.43 | 4.14 | 18.84 | 0.2250 | 0.0175 | |||
| DKS / DICK'S Sporting Goods, Inc. | 0.02 | 9.88 | 4.12 | 7.82 | 0.2241 | -0.0036 | |||
| ATR / AptarGroup, Inc. | 0.03 | 3.38 | 4.12 | 8.99 | 0.2240 | -0.0012 | |||
| AMED / Amedisys, Inc. | 0.04 | 3.45 | 4.11 | 9.89 | 0.2234 | 0.0006 | |||
| RRJ / RenaissanceRe Holdings Ltd. | 0.02 | 28.02 | 4.09 | 29.57 | 0.2223 | 0.0343 | |||
| GKOS / Glaukos Corporation | 0.04 | 3.43 | 4.08 | 8.54 | 0.2218 | -0.0021 | |||
| CHE / Chemed Corporation | 0.01 | 3.55 | 4.08 | -18.07 | 0.2217 | -0.0748 | |||
| CAVA / CAVA Group, Inc. | 0.05 | 4.08 | 0.2216 | 0.2216 | |||||
| HIMS / Hims & Hers Health, Inc. | 0.08 | 3.42 | 4.08 | 74.52 | 0.2215 | 0.0824 | |||
| ENVA / Enova International, Inc. | 0.04 | 92.24 | 4.07 | 122.01 | 0.2210 | 0.1119 | |||
| KLIC / Kulicke and Soffa Industries, Inc. | 0.12 | 3.40 | 4.06 | 8.48 | 0.2206 | -0.0023 | |||
| FNB / F.N.B. Corporation | 0.28 | 3.42 | 4.05 | 12.10 | 0.2202 | 0.0050 | |||
| KD / Kyndryl Holdings, Inc. | 0.10 | 3.43 | 4.05 | 38.24 | 0.2201 | 0.0456 | |||
| WING / Wingstop Inc. | 0.01 | 112.44 | 4.05 | 217.16 | 0.2200 | 0.1440 | |||
| DOCS / Doximity, Inc. | 0.07 | 3.41 | 4.04 | 9.32 | 0.2194 | -0.0006 | |||
| GME / GameStop Corp. | 0.17 | 53.69 | 4.04 | 67.99 | 0.2194 | 0.0762 | |||
| CMC / Commercial Metals Company | 0.08 | 3.41 | 4.02 | 9.91 | 0.2183 | 0.0007 | |||
| BKU / BankUnited, Inc. | 0.11 | 88.03 | 3.92 | 94.30 | 0.2132 | 0.0930 | |||
| WTRG / Essential Utilities, Inc. | 0.11 | 3.42 | 3.92 | -2.85 | 0.2129 | -0.0272 | |||
| HTH / Hilltop Holdings Inc. | 0.13 | -11.43 | 3.92 | -11.72 | 0.2129 | -0.0514 | |||
| IOSP / Innospec Inc. | 0.05 | 342.18 | 3.91 | 292.56 | 0.2124 | 0.1531 | |||
| RLI / RLI Corp. | 0.05 | -3.93 | 3.89 | -13.63 | 0.2116 | -0.0569 | |||
| ONTO / Onto Innovation Inc. | 0.04 | 90.43 | 3.89 | 58.39 | 0.2113 | 0.0651 | |||
| BRBR / BellRing Brands, Inc. | 0.07 | 6.76 | 3.88 | -16.95 | 0.2110 | -0.0674 | |||
| EXLS / ExlService Holdings, Inc. | 0.09 | 3.40 | 3.87 | -4.11 | 0.2106 | -0.0300 | |||
| AFG / American Financial Group, Inc. | 0.03 | -8.64 | 3.87 | -15.79 | 0.2105 | -0.0772 | |||
| WCC / WESCO International, Inc. | 0.02 | 3.45 | 3.87 | 23.38 | 0.2103 | 0.0235 | |||
| COOP / Mr. Cooper Group Inc. | 0.03 | -38.33 | 3.85 | -23.07 | 0.2094 | -0.0889 | |||
| SKX / Skechers U.S.A., Inc. | 0.06 | 5.55 | 3.84 | 17.30 | 0.2090 | 0.0137 | |||
| SKYW / SkyWest, Inc. | 0.04 | 235.65 | 3.84 | 295.57 | 0.2088 | 0.1510 | |||
| REZI / Resideo Technologies, Inc. | 0.17 | 128.83 | 3.82 | 185.14 | 0.2076 | 0.1278 | |||
| ELS / Equity LifeStyle Properties, Inc. | 0.06 | 3.43 | 3.81 | -4.37 | 0.2073 | -0.0303 | |||
| PLNT / Planet Fitness, Inc. | 0.03 | 3.40 | 3.81 | 16.69 | 0.2072 | 0.0126 | |||
| AYI / Acuity Inc. | 0.01 | 13.62 | 3.81 | 28.72 | 0.2068 | 0.0307 | |||
| SAFT / Safety Insurance Group, Inc. | 0.05 | 3.80 | 0.2065 | 0.2065 | |||||
| UMBF / UMB Financial Corporation | 0.04 | 282.21 | 3.78 | 297.58 | 0.2056 | 0.1489 | |||
| FLR / Fluor Corporation | 0.07 | 3.39 | 3.78 | 47.98 | 0.2054 | 0.0533 | |||
| CELH / Celsius Holdings, Inc. | 0.08 | -14.45 | 3.77 | 11.45 | 0.2048 | 0.0034 | |||
| FYBR / Frontier Communications Parent, Inc. | 0.10 | 3.40 | 3.72 | 4.96 | 0.2025 | -0.0089 | |||
| MTSI / MACOM Technology Solutions Holdings, Inc. | 0.03 | 3.72 | 0.2025 | 0.2025 | |||||
| WAL / Western Alliance Bancorporation | 0.05 | 3.43 | 3.67 | 4.95 | 0.1993 | -0.0088 | |||
| SMTC / Semtech Corporation | 0.08 | 142.20 | 3.66 | 217.98 | 0.1990 | 0.1304 | |||
| RAMP / LiveRamp Holdings, Inc. | 0.11 | 3.41 | 3.66 | 30.69 | 0.1989 | 0.0321 | |||
| EG0 / Essent Group Ltd. | 0.06 | 3.39 | 3.65 | 8.77 | 0.1984 | -0.0015 | |||
| FMC / FMC Corporation | 0.09 | 3.65 | 0.1983 | 0.1983 | |||||
| ABCB / Ameris Bancorp | 0.06 | 3.38 | 3.65 | 16.19 | 0.1982 | 0.0113 | |||
| PR / Permian Resources Corporation | 0.27 | -9.63 | 3.64 | -11.12 | 0.1981 | -0.0462 | |||
| LNTH / Lantheus Holdings, Inc. | 0.04 | 3.43 | 3.64 | -13.25 | 0.1980 | -0.0521 | |||
| IDCC / InterDigital, Inc. | 0.02 | 3.39 | 3.64 | 12.14 | 0.1979 | 0.0045 | |||
| JHG / Janus Henderson Group plc | 0.09 | 3.40 | 3.64 | 11.09 | 0.1976 | 0.0027 | |||
| PB / Prosperity Bancshares, Inc. | 0.05 | 3.45 | 3.63 | 1.83 | 0.1971 | -0.0151 | |||
| SHAK / Shake Shack Inc. | 0.03 | -4.44 | 3.61 | 52.41 | 0.1964 | 0.0552 | |||
| ACI / Albertsons Companies, Inc. | 0.17 | 3.60 | 0.1959 | 0.1959 | |||||
| NLY / Annaly Capital Management, Inc. | 0.19 | 3.41 | 3.60 | -4.18 | 0.1958 | -0.0281 | |||
| JXN / Jackson Financial Inc. | 0.04 | 39.36 | 3.57 | 47.72 | 0.1940 | 0.0501 | |||
| ENS / EnerSys | 0.04 | 3.37 | 3.56 | -3.18 | 0.1938 | -0.0256 | |||
| MCRI / Monarch Casino & Resort, Inc. | 0.04 | -9.91 | 3.55 | 0.17 | 0.1930 | -0.0182 | |||
| SPXC / SPX Technologies, Inc. | 0.02 | 3.42 | 3.54 | 34.68 | 0.1923 | 0.0358 | |||
| LSCC / Lattice Semiconductor Corporation | 0.07 | 3.42 | 3.52 | -3.43 | 0.1916 | -0.0258 | |||
| TKR / The Timken Company | 0.05 | 3.41 | 3.52 | 4.39 | 0.1912 | -0.0095 | |||
| FBP / First BanCorp. | 0.17 | 3.42 | 3.51 | 12.37 | 0.1907 | 0.0047 | |||
| HRB / H&R Block, Inc. | 0.06 | 3.38 | 3.51 | 3.36 | 0.1907 | -0.0115 | |||
| WTFC / Wintrust Financial Corporation | 0.03 | 3.46 | 3.49 | 14.04 | 0.1899 | 0.0074 | |||
| OSK / Oshkosh Corporation | 0.03 | 3.45 | 3.48 | 24.83 | 0.1894 | 0.0232 | |||
| FLS / Flowserve Corporation | 0.07 | 3.38 | 3.48 | 10.83 | 0.1891 | 0.0021 | |||
| MYRG / MYR Group Inc. | 0.02 | 74.79 | 3.48 | 180.63 | 0.1890 | 0.1152 | |||
| KEX / Kirby Corporation | 0.03 | 3.46 | 3.48 | 16.14 | 0.1890 | 0.0107 | |||
| AN / AutoNation, Inc. | 0.02 | -10.75 | 3.47 | 9.50 | 0.1886 | -0.0002 | |||
| OFG / OFG Bancorp | 0.08 | 3.42 | 3.45 | 10.61 | 0.1876 | 0.0017 | |||
| HWC / Hancock Whitney Corporation | 0.06 | 3.39 | 3.44 | 13.15 | 0.1871 | 0.0059 | |||
| DXPE / DXP Enterprises, Inc. | 0.04 | 539.45 | 3.44 | 581.39 | 0.1871 | 0.1570 | |||
| NNN / NNN REIT, Inc. | 0.08 | 3.41 | 3.43 | 4.70 | 0.1866 | -0.0087 | |||
| DINO / HF Sinclair Corporation | 0.08 | 3.42 | 3.41 | 29.25 | 0.1854 | 0.0282 | |||
| SLG / SL Green Realty Corp. | 0.05 | 101.19 | 3.39 | 115.92 | 0.1843 | 0.0907 | |||
| EAT / Brinker International, Inc. | 0.02 | 41.08 | 3.38 | 70.69 | 0.1839 | 0.0658 | |||
| CURB / Curbline Properties Corp. | 0.15 | 3.41 | 3.38 | -2.42 | 0.1838 | -0.0226 | |||
| CASH / Pathward Financial, Inc. | 0.04 | -32.87 | 3.36 | -27.20 | 0.1829 | -0.0924 | |||
| GEF / Greif, Inc. | 0.05 | 119.14 | 3.34 | 159.02 | 0.1818 | 0.1049 | |||
| ALEX / Alexander & Baldwin, Inc. | 0.19 | 3.41 | 3.30 | 7.03 | 0.1796 | -0.0043 | |||
| XHR / Xenia Hotels & Resorts, Inc. | 0.26 | 160.70 | 3.29 | 178.71 | 0.1786 | 0.1084 | |||
| CUZ / Cousins Properties Incorporated | 0.11 | 3.42 | 3.28 | 5.30 | 0.1783 | -0.0073 | |||
| LXP / LXP Industrial Trust | 0.40 | 66.70 | 3.27 | 59.15 | 0.1778 | 0.0554 | |||
| OHI / Omega Healthcare Investors, Inc. | 0.09 | 3.43 | 3.26 | -0.46 | 0.1774 | -0.0179 | |||
| FHI / Federated Hermes, Inc. | 0.07 | -19.48 | 3.23 | -12.48 | 0.1758 | -0.0443 | |||
| ANF / Abercrombie & Fitch Co. | 0.04 | 132.26 | 3.23 | 151.91 | 0.1757 | 0.0993 | |||
| CTRE / CareTrust REIT, Inc. | 0.10 | 31.17 | 3.20 | 40.44 | 0.1737 | 0.0382 | |||
| PLXS / Plexus Corp. | 0.02 | 3.44 | 3.17 | 9.23 | 0.1724 | -0.0006 | |||
| HLI / Houlihan Lokey, Inc. | 0.02 | 150.81 | 3.16 | 179.51 | 0.1720 | 0.1046 | |||
| TNDM / Tandem Diabetes Care, Inc. | 0.17 | 3.42 | 3.16 | 0.64 | 0.1720 | -0.0153 | |||
| AVAV / AeroVironment, Inc. | 0.01 | 3.47 | 3.13 | 147.47 | 0.1703 | 0.0949 | |||
| GATX / GATX Corporation | 0.02 | 129.23 | 3.11 | 126.77 | 0.1690 | 0.0873 | |||
| AIT / Applied Industrial Technologies, Inc. | 0.01 | 3.52 | 3.09 | 6.78 | 0.1677 | -0.0044 | |||
| CPF / Central Pacific Financial Corp. | 0.11 | 3.40 | 3.08 | 7.17 | 0.1674 | -0.0038 | |||
| URBN / Urban Outfitters, Inc. | 0.04 | 49.04 | 3.06 | 106.33 | 0.1665 | 0.0781 | |||
| R / Ryder System, Inc. | 0.02 | 3.30 | 3.06 | 14.18 | 0.1664 | 0.0067 | |||
| DTM / DT Midstream, Inc. | 0.03 | 3.37 | 3.04 | 17.75 | 0.1652 | 0.0115 | |||
| TNL / Travel + Leisure Co. | 0.06 | 3.39 | 3.04 | 15.26 | 0.1651 | 0.0081 | |||
| BMI / Badger Meter, Inc. | 0.01 | 3.42 | 3.04 | 33.16 | 0.1651 | 0.0292 | |||
| FCFS / FirstCash Holdings, Inc. | 0.02 | 46.77 | 3.03 | 64.89 | 0.1650 | 0.0553 | |||
| DUOL / Duolingo, Inc. | 0.01 | -56.28 | 3.02 | -42.28 | 0.1642 | -0.1475 | |||
| CHX / ChampionX Corporation | 0.12 | 3.42 | 3.02 | -13.80 | 0.1641 | -0.0445 | |||
| MUSA / Murphy USA Inc. | 0.01 | 3.43 | 3.01 | -10.43 | 0.1638 | -0.0366 | |||
| UTL / Unitil Corporation | 0.06 | 3.38 | 3.01 | -6.53 | 0.1634 | -0.0282 | |||
| MATX / Matson, Inc. | 0.03 | 3.46 | 3.00 | -10.12 | 0.1632 | -0.0358 | |||
| OLLI / Ollie's Bargain Outlet Holdings, Inc. | 0.02 | 3.35 | 3.00 | 17.06 | 0.1630 | 0.0104 | |||
| KTOS / Kratos Defense & Security Solutions, Inc. | 0.06 | 2.97 | 0.1617 | 0.1617 | |||||
| CDP / COPT Defense Properties | 0.11 | -28.51 | 2.97 | -27.70 | 0.1613 | -0.0832 | |||
| ELF / e.l.f. Beauty, Inc. | 0.02 | -27.11 | 2.96 | -27.75 | 0.1609 | -0.0954 | |||
| MAT / Mattel, Inc. | 0.15 | 3.41 | 2.94 | 4.96 | 0.1599 | -0.0071 | |||
| CORT / Corcept Therapeutics Incorporated | 0.04 | 3.39 | 2.94 | -33.57 | 0.1598 | -0.1038 | |||
| PAG / Penske Automotive Group, Inc. | 0.02 | -12.48 | 2.92 | 4.43 | 0.1588 | -0.0078 | |||
| CRS / Carpenter Technology Corporation | 0.01 | 177.40 | 2.92 | 323.19 | 0.1587 | 0.1176 | |||
| EVR / Evercore Inc. | 0.01 | 3.55 | 2.91 | 40.01 | 0.1581 | 0.0343 | |||
| GLPI / Gaming and Leisure Properties, Inc. | 0.06 | -44.91 | 2.90 | -49.49 | 0.1576 | -0.1842 | |||
| SGI / Somnigroup International Inc. | 0.04 | -21.06 | 2.90 | -10.28 | 0.1575 | -0.0349 | |||
| GTLS / Chart Industries, Inc. | 0.02 | 3.39 | 2.88 | 17.94 | 0.1565 | 0.0111 | |||
| PCH / PotlatchDeltic Corporation | 0.07 | -30.50 | 2.86 | -40.91 | 0.1557 | -0.1330 | |||
| ALV / Autoliv, Inc. | 0.03 | 3.49 | 2.86 | 30.91 | 0.1555 | 0.0253 | |||
| STRL / Sterling Infrastructure, Inc. | 0.01 | 2.85 | 0.1548 | 0.1548 | |||||
| KAR / OPENLANE, Inc. | 0.12 | 168.48 | 2.85 | 240.55 | 0.1548 | 0.1050 | |||
| ATGE / Adtalem Global Education Inc. | 0.02 | 92.78 | 2.84 | 143.83 | 0.1546 | 0.0851 | |||
| OI / O-I Glass, Inc. | 0.19 | 247.99 | 2.84 | 290.92 | 0.1545 | 0.1022 | |||
| HAFC / Hanmi Financial Corporation | 0.11 | -26.16 | 2.82 | -19.57 | 0.1535 | -0.0557 | |||
| YOU / Clear Secure, Inc. | 0.10 | 3.40 | 2.81 | 10.78 | 0.1525 | 0.0016 | |||
| BHF / Brighthouse Financial, Inc. | 0.05 | 3.42 | 2.80 | -4.11 | 0.1523 | -0.0217 | |||
| STWD / Starwood Property Trust, Inc. | 0.14 | 3.40 | 2.80 | 4.99 | 0.1522 | -0.0067 | |||
| WSO / Watsco, Inc. | 0.01 | -61.29 | 2.78 | -66.37 | 0.1514 | -0.3419 | |||
| VMI / Valmont Industries, Inc. | 0.01 | 3.51 | 2.76 | 18.47 | 0.1503 | 0.0112 | |||
| HASI / HA Sustainable Infrastructure Capital, Inc. | 0.10 | 42.50 | 2.76 | 30.92 | 0.1501 | 0.0244 | |||
| HR / Healthcare Realty Trust Incorporated | 0.17 | 3.42 | 2.76 | -2.96 | 0.1499 | -0.0194 | |||
| SSD / Simpson Manufacturing Co., Inc. | 0.02 | 3.36 | 2.74 | 2.20 | 0.1491 | -0.0108 | |||
| EXP / Eagle Materials Inc. | 0.01 | 3.44 | 2.74 | -5.78 | 0.1490 | -0.0243 | |||
| ALG / Alamo Group Inc. | 0.01 | 3.39 | 2.73 | 26.72 | 0.1485 | 0.0201 | |||
| AXTA / Axalta Coating Systems Ltd. | 0.09 | 120.48 | 2.73 | 97.32 | 0.1483 | 0.0659 | |||
| EVTC / EVERTEC, Inc. | 0.08 | 49.66 | 2.73 | 46.72 | 0.1482 | 0.0375 | |||
| ABG / Asbury Automotive Group, Inc. | 0.01 | 44.40 | 2.72 | 55.99 | 0.1480 | 0.0440 | |||
| DNOW / DNOW Inc. | 0.18 | 3.42 | 2.70 | -10.21 | 0.1468 | -0.0324 | |||
| KNSL / Kinsale Capital Group, Inc. | 0.01 | 3.03 | 2.70 | 2.43 | 0.1467 | -0.0102 | |||
| AGCO / AGCO Corporation | 0.03 | 3.40 | 2.70 | 15.26 | 0.1466 | 0.0072 | |||
| AM / Antero Midstream Corporation | 0.14 | 3.40 | 2.69 | 8.87 | 0.1462 | -0.0010 | |||
| BBWI / Bath & Body Works, Inc. | 0.09 | -38.43 | 2.67 | -39.15 | 0.1453 | -0.1164 | |||
| PNFP / Pinnacle Financial Partners, Inc. | 0.02 | 3.36 | 2.64 | 7.61 | 0.1438 | -0.0026 | |||
| FCPT / Four Corners Property Trust, Inc. | 0.10 | 3.41 | 2.64 | -3.04 | 0.1438 | -0.0187 | |||
| PVH / PVH Corp. | 0.04 | 3.42 | 2.64 | 9.75 | 0.1433 | 0.0002 | |||
| SNEX / StoneX Group Inc. | 0.03 | 3.37 | 2.63 | 23.34 | 0.1431 | 0.0160 | |||
| TMHC / Taylor Morrison Home Corporation | 0.04 | 19.92 | 2.62 | 22.67 | 0.1427 | 0.0152 | |||
| ESAB / ESAB Corporation | 0.02 | 3.31 | 2.62 | 6.94 | 0.1424 | -0.0036 | |||
| CHEF / The Chefs' Warehouse, Inc. | 0.04 | 108.34 | 2.61 | 144.15 | 0.1419 | 0.0782 | |||
| CMA / Comerica Incorporated | 0.04 | 3.39 | 2.61 | 4.40 | 0.1419 | -0.0070 | |||
| CHCO / City Holding Company | 0.02 | 2.61 | 0.1416 | 0.1416 | |||||
| IDA / IDACORP, Inc. | 0.02 | -62.90 | 2.59 | -63.16 | 0.1407 | -0.2778 | |||
| CUBI / Customers Bancorp, Inc. | 0.04 | 228.15 | 2.58 | 283.95 | 0.1405 | 0.1004 | |||
| CWEN / Clearway Energy, Inc. | 0.08 | 67.75 | 2.58 | 77.34 | 0.1404 | 0.0536 | |||
| CADE / Cadence Bank | 0.08 | 3.41 | 2.58 | 8.91 | 0.1403 | -0.0008 | |||
| VNO / Vornado Realty Trust | 0.07 | 2.56 | 0.1391 | 0.1391 | |||||
| CBT / Cabot Corporation | 0.03 | -32.52 | 2.55 | -39.15 | 0.1388 | -0.1111 | |||
| KRG / Kite Realty Group Trust | 0.11 | 3.43 | 2.55 | 4.72 | 0.1387 | -0.0064 | |||
| BDC / Belden Inc. | 0.02 | 3.47 | 2.55 | 19.51 | 0.1385 | 0.0115 | |||
| DAR / Darling Ingredients Inc. | 0.07 | 25.89 | 2.55 | 52.88 | 0.1385 | 0.0392 | |||
| KRC / Kilroy Realty Corporation | 0.07 | 3.43 | 2.54 | 8.31 | 0.1382 | -0.0016 | |||
| KNX / Knight-Swift Transportation Holdings Inc. | 0.06 | 3.40 | 2.54 | 5.18 | 0.1381 | -0.0058 | |||
| AVNT / Avient Corporation | 0.08 | 3.40 | 2.54 | -10.10 | 0.1380 | -0.0302 | |||
| FRPT / Freshpet, Inc. | 0.04 | 2.54 | 0.1378 | 0.1378 | |||||
| CPK / Chesapeake Utilities Corporation | 0.02 | -37.00 | 2.51 | -41.05 | 0.1366 | -0.1173 | |||
| PHIN / PHINIA Inc. | 0.06 | 3.42 | 2.48 | 8.43 | 0.1350 | -0.0014 | |||
| NOV / NOV Inc. | 0.20 | 3.42 | 2.48 | -15.55 | 0.1349 | -0.0401 | |||
| BANC / Banc of California, Inc. | 0.18 | 57.16 | 2.48 | 55.65 | 0.1347 | 0.0398 | |||
| BCPC / Balchem Corporation | 0.02 | 3.29 | 2.46 | -0.93 | 0.1335 | -0.0142 | |||
| AAL / American Airlines Group Inc. | 0.22 | -39.29 | 2.44 | -35.42 | 0.1328 | -0.0926 | |||
| CG / The Carlyle Group Inc. | 0.05 | -46.47 | 2.44 | -36.90 | 0.1328 | -0.0978 | |||
| VBTX / Veritex Holdings, Inc. | 0.09 | 53.23 | 2.44 | 60.18 | 0.1326 | 0.0419 | |||
| STRA / Strategic Education, Inc. | 0.03 | 173.66 | 2.44 | 177.56 | 0.1325 | 0.0802 | |||
| FIVE / Five Below, Inc. | 0.02 | 66.00 | 2.43 | 190.68 | 0.1323 | 0.0824 | |||
| BYD / Boyd Gaming Corporation | 0.03 | 3.42 | 2.42 | 22.92 | 0.1318 | 0.0143 | |||
| AA / Alcoa Corporation | 0.08 | 3.42 | 2.42 | 0.08 | 0.1315 | -0.0125 | |||
| APPF / AppFolio, Inc. | 0.01 | 3.24 | 2.41 | 8.13 | 0.1309 | -0.0018 | |||
| WMS / Advanced Drainage Systems, Inc. | 0.02 | -27.88 | 2.40 | -23.75 | 0.1306 | -0.0571 | |||
| VNT / Vontier Corporation | 0.07 | 3.39 | 2.40 | 16.16 | 0.1305 | 0.0074 | |||
| FCN / FTI Consulting, Inc. | 0.01 | 3.44 | 2.39 | 1.83 | 0.1298 | -0.0099 | |||
| MMSI / Merit Medical Systems, Inc. | 0.03 | 3.36 | 2.36 | -8.59 | 0.1284 | -0.0255 | |||
| CROX / Crocs, Inc. | 0.02 | -31.67 | 2.35 | -34.83 | 0.1278 | -0.0871 | |||
| AR / Antero Resources Corporation | 0.06 | 3.42 | 2.35 | 3.03 | 0.1277 | -0.0082 | |||
| QLYS / Qualys, Inc. | 0.02 | 3.35 | 2.35 | 17.29 | 0.1276 | 0.0083 | |||
| DRH / DiamondRock Hospitality Company | 0.31 | 3.41 | 2.34 | 2.63 | 0.1274 | -0.0087 | |||
| BCO / The Brink's Company | 0.03 | 3.40 | 2.34 | 7.15 | 0.1271 | -0.0029 | |||
| ACA / Arcosa, Inc. | 0.03 | 3.47 | 2.33 | 16.38 | 0.1267 | 0.0074 | |||
| WPC / W. P. Carey Inc. | 0.04 | 3.41 | 2.33 | 2.20 | 0.1264 | -0.0091 | |||
| BJRI / BJ's Restaurants, Inc. | 0.05 | 3.42 | 2.32 | 34.65 | 0.1261 | 0.0235 | |||
| OII / Oceaneering International, Inc. | 0.11 | 3.41 | 2.29 | -1.76 | 0.1245 | -0.0144 | |||
| APOG / Apogee Enterprises, Inc. | 0.06 | 3.38 | 2.29 | -9.42 | 0.1244 | -0.0261 | |||
| CNXC / Concentrix Corporation | 0.04 | 3.44 | 2.28 | -1.72 | 0.1240 | -0.0143 | |||
| COKE / Coca-Cola Consolidated, Inc. | 0.02 | 940.98 | 2.28 | -13.90 | 0.1240 | -0.0338 | |||
| CBSH / Commerce Bancshares, Inc. | 0.04 | -33.91 | 2.26 | -33.99 | 0.1230 | -0.0812 | |||
| HXL / Hexcel Corporation | 0.04 | 3.40 | 2.26 | 6.67 | 0.1226 | -0.0034 | |||
| LPX / Louisiana-Pacific Corporation | 0.03 | -33.91 | 2.25 | -38.22 | 0.1225 | -0.0947 | |||
| GTY / Getty Realty Corp. | 0.08 | 3.39 | 2.25 | -8.36 | 0.1222 | -0.0239 | |||
| SIGI / Selective Insurance Group, Inc. | 0.03 | 3.44 | 2.25 | -2.09 | 0.1221 | -0.0146 | |||
| SAIC / Science Applications International Corporation | 0.02 | -22.52 | 2.24 | -22.31 | 0.1216 | -0.0499 | |||
| WWW / Wolverine World Wide, Inc. | 0.12 | 3.40 | 2.23 | 34.38 | 0.1212 | 0.0224 | |||
| NAVI / Navient Corporation | 0.16 | -26.12 | 2.21 | -17.51 | 0.1202 | -0.0395 | |||
| CIEN / Ciena Corporation | 0.03 | 3.44 | 2.21 | 39.16 | 0.1200 | 0.0255 | |||
| FLEX / Flex Ltd. | 0.04 | 3.38 | 2.19 | 56.06 | 0.1190 | 0.0354 | |||
| GXO / GXO Logistics, Inc. | 0.04 | 3.40 | 2.19 | 28.89 | 0.1188 | 0.0178 | |||
| PENG / Penguin Solutions, Inc. | 0.11 | 3.41 | 2.17 | 17.93 | 0.1180 | 0.0083 | |||
| BHE / Benchmark Electronics, Inc. | 0.06 | 3.42 | 2.16 | 5.56 | 0.1176 | -0.0044 | |||
| ABM / ABM Industries Incorporated | 0.05 | 3.42 | 2.16 | 3.10 | 0.1176 | -0.0074 | |||
| MXL / MaxLinear, Inc. | 0.15 | 3.41 | 2.14 | 35.34 | 0.1162 | 0.0221 | |||
| MOGA / Moog, Inc. - Class A | 0.01 | 3.23 | 2.13 | 7.78 | 0.1160 | -0.0020 | |||
| SLGN / Silgan Holdings Inc. | 0.04 | 3.49 | 2.12 | 9.71 | 0.1155 | 0.0001 | |||
| RDN / Radian Group Inc. | 0.06 | 3.39 | 2.11 | 12.63 | 0.1149 | 0.0031 | |||
| BRKR / Bruker Corporation | 0.05 | 3.37 | 2.07 | 2.02 | 0.1126 | -0.0083 | |||
| AGO / Assured Guaranty Ltd. | 0.02 | 3.39 | 2.07 | 2.22 | 0.1125 | -0.0081 | |||
| MTG / MGIC Investment Corporation | 0.07 | -64.93 | 2.07 | -60.61 | 0.1124 | -0.2002 | |||
| ADC / Agree Realty Corporation | 0.03 | -56.19 | 2.06 | -58.55 | 0.1123 | -0.1844 | |||
| BRKL / Brookline Bancorp, Inc. | 0.20 | 3.40 | 2.06 | 0.05 | 0.1122 | -0.0107 | |||
| VVV / Valvoline Inc. | 0.05 | 3.43 | 2.06 | 12.51 | 0.1120 | 0.0029 | |||
| SMPL / The Simply Good Foods Company | 0.06 | 3.40 | 2.05 | -5.28 | 0.1112 | -0.0175 | |||
| H / Hyatt Hotels Corporation | 0.01 | 2.62 | 2.04 | 17.00 | 0.1108 | 0.0070 | |||
| AAON / AAON, Inc. | 0.03 | -12.15 | 2.03 | -17.06 | 0.1102 | -0.0354 | |||
| EIG / Employers Holdings, Inc. | 0.04 | 327.83 | 2.03 | 298.82 | 0.1102 | 0.0799 | |||
| GAP / The Gap, Inc. | 0.09 | -17.49 | 2.02 | -12.68 | 0.1097 | -0.0280 | |||
| QRVO / Qorvo, Inc. | 0.02 | 3.39 | 2.02 | 21.27 | 0.1097 | 0.0105 | |||
| ARCB / ArcBest Corporation | 0.03 | 3.41 | 2.01 | 12.81 | 0.1092 | 0.0031 | |||
| MSM / MSC Industrial Direct Co., Inc. | 0.02 | 3.41 | 2.01 | 13.20 | 0.1091 | 0.0035 | |||
| BOOT / Boot Barn Holdings, Inc. | 0.01 | 3.54 | 2.00 | 46.53 | 0.1089 | 0.0274 | |||
| ITGR / Integer Holdings Corporation | 0.02 | 3.42 | 1.98 | 7.78 | 0.1078 | -0.0018 | |||
| HCC / Warrior Met Coal, Inc. | 0.04 | 3.36 | 1.97 | -0.71 | 0.1068 | -0.0111 | |||
| SBCF / Seacoast Banking Corporation of Florida | 0.07 | 91.91 | 1.95 | 106.12 | 0.1063 | 0.0497 | |||
| IRT / Independence Realty Trust, Inc. | 0.11 | 3.40 | 1.94 | -13.86 | 0.1054 | -0.0287 | |||
| HQY / HealthEquity, Inc. | 0.02 | 3.51 | 1.90 | 22.72 | 0.1034 | 0.0111 | |||
| AX / Axos Financial, Inc. | 0.02 | 3.40 | 1.89 | 21.88 | 0.1030 | 0.0104 | |||
| ORI / Old Republic International Corporation | 0.05 | -44.59 | 1.89 | -45.69 | 0.1025 | -0.1043 | |||
| TXRH / Texas Roadhouse, Inc. | 0.01 | -68.44 | 1.87 | -64.51 | 0.1019 | -0.2127 | |||
| PIPR / Piper Sandler Companies | 0.01 | 1.86 | 0.1012 | 0.1012 | |||||
| PECO / Phillips Edison & Company, Inc. | 0.05 | 3.37 | 1.85 | -0.75 | 0.1005 | -0.0105 | |||
| LBRT / Liberty Energy Inc. | 0.16 | 3.41 | 1.84 | -25.00 | 0.1001 | -0.0462 | |||
| GFF / Griffon Corporation | 0.03 | 3.37 | 1.82 | 4.59 | 0.0991 | -0.0047 | |||
| YELP / Yelp Inc. | 0.05 | 3.43 | 1.82 | -4.31 | 0.0991 | -0.0144 | |||
| VIR / Vir Biotechnology, Inc. | 0.36 | 3.42 | 1.81 | -19.59 | 0.0982 | -0.0356 | |||
| AUB / Atlantic Union Bankshares Corporation | 0.06 | 1.81 | 0.0982 | 0.0982 | |||||
| TTC / The Toro Company | 0.03 | -40.86 | 1.79 | -42.56 | 0.0972 | -0.0882 | |||
| PRDO / Perdoceo Education Corporation | 0.05 | 34.94 | 1.79 | 75.17 | 0.0971 | 0.0363 | |||
| MORN / Morningstar, Inc. | 0.01 | 3.74 | 1.78 | 8.65 | 0.0970 | -0.0009 | |||
| SBRA / Sabra Health Care REIT, Inc. | 0.10 | 3.43 | 1.78 | 9.21 | 0.0967 | -0.0004 | |||
| MDU / MDU Resources Group, Inc. | 0.11 | 3.41 | 1.76 | 1.97 | 0.0959 | -0.0072 | |||
| SM / SM Energy Company | 0.07 | -47.95 | 1.75 | -57.05 | 0.0952 | -0.1478 | |||
| MKO / Capri Holdings Limited | 0.10 | -50.82 | 1.75 | -55.89 | 0.0951 | -0.1412 | |||
| TTGT / TechTarget, Inc. | 0.22 | 3.41 | 1.74 | -45.77 | 0.0945 | -0.0964 | |||
| ASGN / ASGN Incorporated | 0.03 | 3.45 | 1.72 | -18.03 | 0.0934 | -0.0315 | |||
| MTX / Minerals Technologies Inc. | 0.03 | 119.98 | 1.72 | 90.77 | 0.0932 | 0.0396 | |||
| CIVI / Civitas Resources, Inc. | 0.06 | 3.40 | 1.71 | -18.42 | 0.0932 | -0.0320 | |||
| CALM / Cal-Maine Foods, Inc. | 0.02 | -49.35 | 1.71 | -44.51 | 0.0931 | -0.0907 | |||
| EMBC / Embecta Corp. | 0.18 | 3.42 | 1.71 | -21.42 | 0.0928 | -0.0366 | |||
| GOGO / Gogo Inc. | 0.12 | 3.43 | 1.69 | 76.20 | 0.0918 | 0.0347 | |||
| TEX / Terex Corporation | 0.04 | 3.42 | 1.68 | 27.76 | 0.0914 | 0.0130 | |||
| GT / The Goodyear Tire & Rubber Company | 0.16 | 3.42 | 1.67 | 16.05 | 0.0908 | 0.0051 | |||
| CAR / Avis Budget Group, Inc. | 0.01 | 3.44 | 1.67 | 130.39 | 0.0907 | 0.0476 | |||
| GRBK / Green Brick Partners, Inc. | 0.03 | 3.36 | 1.67 | 11.45 | 0.0905 | 0.0015 | |||
| BGC / BGC Group, Inc. | 0.16 | 3.42 | 1.65 | 15.34 | 0.0896 | 0.0045 | |||
| WLY / John Wiley & Sons, Inc. | 0.04 | 3.36 | 1.63 | 3.49 | 0.0888 | -0.0052 | |||
| CRC / California Resources Corporation | 0.04 | 3.45 | 1.63 | 7.45 | 0.0886 | -0.0018 | |||
| MUR / Murphy Oil Corporation | 0.07 | 3.40 | 1.63 | -18.06 | 0.0886 | -0.0299 | |||
| VFC / V.F. Corporation | 0.14 | -19.61 | 1.63 | -39.13 | 0.0885 | -0.0708 | |||
| NWBI / Northwest Bancshares, Inc. | 0.13 | 135.74 | 1.62 | 150.93 | 0.0881 | 0.0496 | |||
| FTDR / Frontdoor, Inc. | 0.03 | 53.13 | 1.62 | 135.12 | 0.0881 | 0.0470 | |||
| WSFS / WSFS Financial Corporation | 0.03 | 3.47 | 1.61 | 9.73 | 0.0877 | 0.0001 | |||
| FAF / First American Financial Corporation | 0.03 | -52.77 | 1.61 | -55.81 | 0.0874 | -0.1294 | |||
| KFY / Korn Ferry | 0.02 | -34.34 | 1.61 | -29.03 | 0.0873 | -0.0475 | |||
| KBH / KB Home | 0.03 | -14.09 | 1.59 | -21.71 | 0.0863 | -0.0345 | |||
| CNO / CNO Financial Group, Inc. | 0.04 | -52.79 | 1.55 | -56.26 | 0.0843 | -0.1270 | |||
| CNK / Cinemark Holdings, Inc. | 0.05 | 3.40 | 1.54 | 25.43 | 0.0840 | 0.0106 | |||
| MTRN / Materion Corporation | 0.02 | 3.50 | 1.54 | 0.72 | 0.0837 | -0.0074 | |||
| NSIT / Insight Enterprises, Inc. | 0.01 | 3.45 | 1.53 | -4.79 | 0.0832 | -0.0125 | |||
| VSCO / Victoria's Secret & Co. | 0.08 | 74.05 | 1.53 | 73.52 | 0.0830 | 0.0306 | |||
| CNX / CNX Resources Corporation | 0.05 | 3.37 | 1.53 | 10.59 | 0.0829 | 0.0008 | |||
| AHH / Armada Hoffler Properties, Inc. | 0.22 | 3.40 | 1.52 | -5.41 | 0.0828 | -0.0131 | |||
| GNW / Genworth Financial, Inc. | 0.20 | 3.40 | 1.52 | 13.51 | 0.0827 | 0.0028 | |||
| GPI / Group 1 Automotive, Inc. | 0.00 | -32.75 | 1.52 | -23.10 | 0.0827 | -0.0352 | |||
| RGLD / Royal Gold, Inc. | 0.01 | 3.47 | 1.52 | 12.59 | 0.0826 | 0.0022 | |||
| FORM / FormFactor, Inc. | 0.04 | 3.37 | 1.51 | 25.77 | 0.0823 | 0.0106 | |||
| TDS / Telephone and Data Systems, Inc. | 0.04 | 3.40 | 1.51 | -5.03 | 0.0820 | -0.0126 | |||
| MHO / M/I Homes, Inc. | 0.01 | 3.47 | 1.51 | 1.62 | 0.0820 | -0.0064 | |||
| HIW / Highwoods Properties, Inc. | 0.05 | 3.42 | 1.50 | 8.52 | 0.0817 | -0.0008 | |||
| LEA / Lear Corporation | 0.02 | 3.47 | 1.50 | -30.43 | 0.0816 | -0.1440 | |||
| ZION / Zions Bancorporation, National Association | 0.03 | 3.37 | 1.50 | 7.68 | 0.0816 | -0.0014 | |||
| TCBI / Texas Capital Bancshares, Inc. | 0.02 | 3.37 | 1.50 | 9.92 | 0.0813 | 0.0002 | |||
| DFIN / Donnelley Financial Solutions, Inc. | 0.02 | 3.32 | 1.49 | 45.70 | 0.0812 | 0.0201 | |||
| VAC / Marriott Vacations Worldwide Corporation | 0.02 | 3.25 | 1.48 | 16.30 | 0.0807 | 0.0046 | |||
| NATL / NCR Atleos Corporation | 0.05 | 3.43 | 1.48 | 11.86 | 0.0806 | 0.0016 | |||
| VIRT / Virtu Financial, Inc. | 0.03 | -8.08 | 1.48 | 8.04 | 0.0804 | -0.0012 | |||
| HGV / Hilton Grand Vacations Inc. | 0.03 | -41.16 | 1.45 | -34.70 | 0.0786 | -0.0533 | |||
| GNTX / Gentex Corporation | 0.07 | 3.43 | 1.44 | -2.44 | 0.0783 | -0.0096 | |||
| WH / Wyndham Hotels & Resorts, Inc. | 0.02 | 3.35 | 1.44 | -7.29 | 0.0781 | -0.0142 | |||
| THO / THOR Industries, Inc. | 0.02 | 3.41 | 1.43 | 21.22 | 0.0780 | 0.0074 | |||
| UCB / United Community Banks, Inc. | 0.05 | 3.37 | 1.42 | 9.45 | 0.0774 | -0.0001 | |||
| COTY / Coty Inc. | 0.30 | 3.42 | 1.41 | -12.07 | 0.0768 | -0.0189 | |||
| FDP / Fresh Del Monte Produce Inc. | 0.04 | 3.42 | 1.41 | 8.73 | 0.0765 | -0.0006 | |||
| NBHC / National Bank Holdings Corporation | 0.04 | -50.56 | 1.41 | -51.42 | 0.0764 | -0.0959 | |||
| GIII / G-III Apparel Group, Ltd. | 0.06 | -13.19 | 1.40 | -28.92 | 0.0762 | -0.0412 | |||
| ESE / ESCO Technologies Inc. | 0.01 | 1.40 | 0.0761 | 0.0761 | |||||
| AWR / American States Water Company | 0.02 | 3.50 | 1.40 | 0.79 | 0.0759 | -0.0066 | |||
| KTB / Kontoor Brands, Inc. | 0.02 | 281.20 | 1.39 | 292.11 | 0.0757 | 0.0546 | |||
| MRP / Millrose Properties, Inc. | 0.05 | 1.39 | 0.0757 | 0.0757 | |||||
| GMS / GMS Inc. | 0.01 | 3.32 | 1.39 | 53.54 | 0.0755 | 0.0216 | |||
| WFRD / Weatherford International plc | 0.03 | 135.64 | 1.38 | 121.63 | 0.0752 | 0.0380 | |||
| JACK / Jack in the Box Inc. | 0.08 | 1,653.89 | 1.38 | 348.21 | 0.0748 | 0.0460 | |||
| HWKN / Hawkins, Inc. | 0.01 | 3.54 | 1.36 | 39.04 | 0.0742 | 0.0157 | |||
| MZTI / The Marzetti Company | 0.01 | 3.22 | 1.36 | 1.87 | 0.0741 | -0.0056 | |||
| HOPE / Hope Bancorp, Inc. | 0.13 | -37.01 | 1.36 | -35.45 | 0.0739 | -0.0516 | |||
| ALK / Alaska Air Group, Inc. | 0.03 | 3.39 | 1.36 | 3.98 | 0.0739 | -0.0040 | |||
| NXST / Nexstar Media Group, Inc. | 0.01 | 3.28 | 1.34 | -0.37 | 0.0729 | -0.0073 | |||
| VAL / Valaris Limited | 0.03 | 3.47 | 1.34 | 11.04 | 0.0728 | 0.0009 | |||
| CNR / Core Natural Resources, Inc. | 0.02 | 3.32 | 1.33 | -6.58 | 0.0726 | -0.0125 | |||
| SKY / Champion Homes, Inc. | 0.02 | -25.11 | 1.32 | -50.51 | 0.0715 | -0.0868 | |||
| YETI / YETI Holdings, Inc. | 0.04 | 3.36 | 1.31 | -1.58 | 0.0713 | -0.0081 | |||
| SAIA / Saia, Inc. | 0.00 | 3.57 | 1.30 | -18.82 | 0.0709 | -0.0248 | |||
| AAT / American Assets Trust, Inc. | 0.07 | 3.43 | 1.29 | 1.41 | 0.0703 | -0.0057 | |||
| ACIW / ACI Worldwide, Inc. | 0.03 | -41.22 | 1.28 | -50.69 | 0.0697 | -0.0852 | |||
| RYN / Rayonier Inc. | 0.06 | 3.41 | 1.27 | -17.77 | 0.0690 | -0.0229 | |||
| ESI / Element Solutions Inc | 0.06 | 1.27 | 0.0688 | 0.0688 | |||||
| ACLS / Axcelis Technologies, Inc. | 0.02 | 3.50 | 1.27 | 45.24 | 0.0688 | 0.0169 | |||
| S&P MidCap 400 E-Mini Index / DE (N/A) | 1.26 | 0.0682 | 0.0682 | ||||||
| S&P MidCap 400 E-Mini Index / DE (N/A) | 1.26 | 0.0682 | 0.0682 | ||||||
| S&P MidCap 400 E-Mini Index / DE (N/A) | 1.26 | 0.0682 | 0.0682 | ||||||
| S&P MidCap 400 E-Mini Index / DE (N/A) | 1.26 | 0.0682 | 0.0682 | ||||||
| ASH / Ashland Inc. | 0.02 | 3.42 | 1.25 | -12.30 | 0.0679 | -0.0169 | |||
| SBSI / Southside Bancshares, Inc. | 0.04 | 3.40 | 1.25 | 5.14 | 0.0678 | -0.0029 | |||
| ARWR / Arrowhead Pharmaceuticals, Inc. | 0.08 | 3.39 | 1.24 | 28.25 | 0.0676 | 0.0098 | |||
| CRVL / CorVel Corporation | 0.01 | 3.51 | 1.24 | -4.97 | 0.0676 | -0.0104 | |||
| NXT / Nextracker Inc. | 0.02 | 3.39 | 1.23 | 33.44 | 0.0666 | 0.0119 | |||
| NWE / NorthWestern Energy Group, Inc. | 0.02 | 3.38 | 1.22 | -8.33 | 0.0664 | -0.0130 | |||
| CC / The Chemours Company | 0.11 | 3.42 | 1.22 | -12.48 | 0.0664 | -0.0167 | |||
| AZTA / Azenta, Inc. | 0.04 | 3.44 | 1.21 | -8.04 | 0.0659 | -0.0127 | |||
| PTEN / Patterson-UTI Energy, Inc. | 0.20 | 3.41 | 1.21 | -25.42 | 0.0658 | -0.0308 | |||
| UNF / UniFirst Corporation | 0.01 | 3.32 | 1.20 | 11.84 | 0.0652 | 0.0013 | |||
| BFH / Bread Financial Holdings, Inc. | 0.02 | 3.44 | 1.20 | 17.95 | 0.0651 | 0.0046 | |||
| HOG / Harley-Davidson, Inc. | 0.05 | 3.45 | 1.19 | -3.25 | 0.0648 | -0.0086 | |||
| CVBF / CVB Financial Corp. | 0.06 | 3.39 | 1.19 | 10.82 | 0.0646 | 0.0007 | |||
| RGEN / Repligen Corporation | 0.01 | 3.61 | 1.17 | 1.30 | 0.0637 | -0.0052 | |||
| LNN / Lindsay Corporation | 0.01 | 3.13 | 1.17 | 17.52 | 0.0635 | 0.0043 | |||
| AZZ / AZZ Inc. | 0.01 | 3.46 | 1.16 | 16.97 | 0.0630 | 0.0039 | |||
| FUN / Six Flags Entertainment Corporation | 0.04 | 3.38 | 1.15 | -11.79 | 0.0623 | -0.0151 | |||
| AMSF / AMERISAFE, Inc. | 0.03 | 3.41 | 1.14 | -13.95 | 0.0621 | -0.0170 | |||
| PSMT / PriceSmart, Inc. | 0.01 | 3.54 | 1.13 | 23.83 | 0.0616 | 0.0071 | |||
| SAH / Sonic Automotive, Inc. | 0.01 | 3.29 | 1.13 | 45.00 | 0.0615 | 0.0150 | |||
| CSR / Centerspace | 0.02 | 3.39 | 1.13 | -3.83 | 0.0614 | -0.0086 | |||
| TBBK / The Bancorp, Inc. | 0.02 | -47.92 | 1.11 | -43.87 | 0.0606 | -0.0576 | |||
| VC / Visteon Corporation | 0.01 | 3.57 | 1.11 | 24.55 | 0.0604 | 0.0072 | |||
| CWT / California Water Service Group | 0.02 | 3.35 | 1.09 | -3.02 | 0.0594 | -0.0077 | |||
| QNST / QuinStreet, Inc. | 0.07 | 3.39 | 1.09 | -6.71 | 0.0590 | -0.0103 | |||
| TGNA / TEGNA Inc. | 0.06 | 3.42 | 1.08 | -4.84 | 0.0588 | -0.0089 | |||
| DIOD / Diodes Incorporated | 0.02 | 3.33 | 1.08 | 26.59 | 0.0585 | 0.0079 | |||
| HLNE / Hamilton Lane Incorporated | 0.01 | 1.06 | 0.0578 | 0.0578 | |||||
| RUSHA / Rush Enterprises, Inc. | 0.02 | 3.36 | 1.04 | -0.29 | 0.0565 | -0.0056 | |||
| PENN / PENN Entertainment, Inc. | 0.06 | 3.39 | 1.03 | 13.34 | 0.0559 | 0.0018 | |||
| DAN / Dana Incorporated | 0.06 | -50.42 | 1.03 | -36.19 | 0.0558 | -0.0401 | |||
| WAFD / WaFd, Inc | 0.03 | -37.76 | 1.02 | -36.24 | 0.0556 | -0.0399 | |||
| CVCO / Cavco Industries, Inc. | 0.00 | -44.42 | 1.02 | -53.52 | 0.0553 | -0.0751 | |||
| 2IY / Cushman & Wakefield plc | 0.09 | 3.39 | 1.01 | 11.99 | 0.0549 | 0.0012 | |||
| ACHC / Acadia Healthcare Company, Inc. | 0.04 | 3.45 | 1.01 | -22.57 | 0.0547 | -0.0227 | |||
| HUBG / Hub Group, Inc. | 0.03 | 3.40 | 1.00 | -7.06 | 0.0544 | -0.0097 | |||
| EEFT / Euronet Worldwide, Inc. | 0.01 | -76.13 | 1.00 | -77.36 | 0.0544 | -0.2087 | |||
| M / Macy's, Inc. | 0.09 | 3.42 | 1.00 | -4.05 | 0.0542 | -0.0077 | |||
| MTH / Meritage Homes Corporation | 0.01 | 3.42 | 1.00 | -2.26 | 0.0541 | -0.0066 | |||
| SR / Spire Inc. | 0.01 | 3.46 | 0.98 | -3.53 | 0.0535 | -0.0073 | |||
| AIR / AAR Corp. | 0.01 | 3.27 | 0.98 | 26.85 | 0.0532 | 0.0073 | |||
| AKR / Acadia Realty Trust | 0.05 | 0.98 | 0.0531 | 0.0531 | |||||
| RNST / Renasant Corporation | 0.03 | 3.44 | 0.98 | 9.55 | 0.0530 | -0.0000 | |||
| UE / Urban Edge Properties | 0.05 | 3.40 | 0.93 | 1.53 | 0.0505 | -0.0040 | |||
| TRMK / Trustmark Corporation | 0.03 | 3.35 | 0.92 | 9.24 | 0.0502 | -0.0002 | |||
| CENTA / Central Garden & Pet Company | 0.03 | -30.57 | 0.92 | -33.65 | 0.0500 | -0.0326 | |||
| PBF / PBF Energy Inc. | 0.04 | 3.42 | 0.91 | 17.48 | 0.0497 | 0.0033 | |||
| SIG / Signet Jewelers Limited | 0.01 | 26.52 | 0.91 | 24.73 | 0.0494 | 0.0038 | |||
| ECG / Everus Construction Group, Inc. | 0.01 | 3.29 | 0.90 | 76.97 | 0.0489 | 0.0186 | |||
| WEN / The Wendy's Company | 0.08 | 3.40 | 0.90 | -19.26 | 0.0488 | -0.0174 | |||
| ROCK / Gibraltar Industries, Inc. | 0.02 | 3.35 | 0.90 | 3.94 | 0.0487 | -0.0026 | |||
| AIN / Albany International Corp. | 0.01 | 0.89 | 0.0483 | 0.0483 | |||||
| GOLF / Acushnet Holdings Corp. | 0.01 | 3.49 | 0.89 | 9.79 | 0.0482 | 0.0001 | |||
| WKC / World Kinect Corporation | 0.03 | 3.40 | 0.88 | 3.27 | 0.0481 | -0.0029 | |||
| TRN / Trinity Industries, Inc. | 0.03 | 0.88 | 0.0477 | 0.0477 | |||||
| AEO / American Eagle Outfitters, Inc. | 0.09 | -22.68 | 0.88 | -36.04 | 0.0476 | -0.0339 | |||
| BILL / BILL Holdings, Inc. | 0.02 | 0.87 | 0.0470 | 0.0470 | |||||
| HMN / Horace Mann Educators Corporation | 0.02 | 3.37 | 0.86 | 3.97 | 0.0470 | -0.0025 | |||
| POWI / Power Integrations, Inc. | 0.02 | 3.29 | 0.86 | 14.30 | 0.0469 | 0.0019 | |||
| ADUS / Addus HomeCare Corporation | 0.01 | 3.40 | 0.86 | 20.45 | 0.0468 | 0.0042 | |||
| MCW / Mister Car Wash, Inc. | 0.14 | 3.42 | 0.85 | -21.24 | 0.0462 | -0.0181 | |||
| AOSL / Alpha and Omega Semiconductor Limited | 0.03 | 0.84 | 0.0457 | 0.0457 | |||||
| DV / DoubleVerify Holdings, Inc. | 0.06 | 3.37 | 0.83 | 15.83 | 0.0450 | 0.0024 | |||
| REX / REX American Resources Corporation | 0.02 | 3.28 | 0.82 | 33.88 | 0.0445 | 0.0081 | |||
| MLKN / MillerKnoll, Inc. | 0.04 | 3.42 | 0.82 | 4.88 | 0.0444 | -0.0020 | |||
| MTN / Vail Resorts, Inc. | 0.01 | 3.26 | 0.82 | 1.37 | 0.0443 | -0.0036 | |||
| NSP / Insperity, Inc. | 0.01 | -56.68 | 0.81 | -70.85 | 0.0439 | -0.1210 | |||
| BC / Brunswick Corporation | 0.01 | 3.49 | 0.81 | 6.20 | 0.0438 | -0.0014 | |||
| PLMR / Palomar Holdings, Inc. | 0.01 | -52.29 | 0.80 | -46.32 | 0.0432 | -0.0450 | |||
| BTU / Peabody Energy Corporation | 0.06 | 0.77 | 0.0419 | 0.0419 | |||||
| SUPN / Supernus Pharmaceuticals, Inc. | 0.02 | 3.48 | 0.77 | -0.52 | 0.0417 | -0.0042 | |||
| AAP / Advance Auto Parts, Inc. | 0.02 | 0.76 | 0.0416 | 0.0416 | |||||
| KMT / Kennametal Inc. | 0.03 | 3.45 | 0.76 | 11.55 | 0.0415 | 0.0007 | |||
| UAA / Under Armour, Inc. | 0.11 | -42.00 | 0.76 | -36.67 | 0.0414 | -0.0301 | |||
| SCHL / Scholastic Corporation | 0.04 | 3.42 | 0.75 | 14.96 | 0.0410 | 0.0019 | |||
| CCS / Century Communities, Inc. | 0.01 | 3.49 | 0.75 | -13.16 | 0.0409 | -0.0107 | |||
| ADNT / Adient plc | 0.04 | -74.49 | 0.74 | -61.39 | 0.0402 | -0.0739 | |||
| CLSK / CleanSpark, Inc. | 0.07 | 0.72 | 0.0391 | 0.0391 | |||||
| MCY / Mercury General Corporation | 0.01 | 39.75 | 0.72 | 82.23 | 0.0391 | 0.0022 | |||
| HSII / Heidrick & Struggles International, Inc. | 0.02 | -55.53 | 0.72 | -52.52 | 0.0390 | -0.0509 | |||
| CLF / Cleveland-Cliffs Inc. | 0.09 | -29.88 | 0.72 | -35.14 | 0.0389 | -0.0269 | |||
| GHC / Graham Holdings Company | 0.00 | 5.75 | 0.71 | 4.09 | 0.0388 | -0.0020 | |||
| SRPT / Sarepta Therapeutics, Inc. | 0.04 | 3.37 | 0.71 | -72.33 | 0.0385 | -0.1139 | |||
| SPNT / SiriusPoint Ltd. | 0.03 | 0.70 | 0.0383 | 0.0383 | |||||
| JOE / The St. Joe Company | 0.01 | 3.46 | 0.70 | 5.11 | 0.0381 | -0.0016 | |||
| MAC / The Macerich Company | 0.04 | 3.45 | 0.70 | -2.52 | 0.0379 | -0.0047 | |||
| NGVT / Ingevity Corporation | 0.02 | 3.44 | 0.69 | 12.58 | 0.0375 | 0.0010 | |||
| SHO / Sunstone Hotel Investors, Inc. | 0.08 | 3.41 | 0.68 | -4.63 | 0.0369 | -0.0055 | |||
| FBK / FB Financial Corporation | 0.01 | 3.44 | 0.67 | 1.21 | 0.0365 | -0.0031 | |||
| TNC / Tennant Company | 0.01 | 3.51 | 0.66 | 0.61 | 0.0356 | -0.0032 | |||
| PARR / Par Pacific Holdings, Inc. | 0.02 | 0.64 | 0.0349 | 0.0349 | |||||
| DCOM / Dime Community Bancshares, Inc. | 0.02 | 3.39 | 0.64 | 0.00 | 0.0348 | -0.0034 | |||
| MYGN / Myriad Genetics, Inc. | 0.12 | 3.41 | 0.63 | -38.12 | 0.0344 | -0.0265 | |||
| OMCL / Omnicell, Inc. | 0.02 | 3.45 | 0.62 | -12.89 | 0.0334 | -0.0087 | |||
| AROC / Archrock, Inc. | 0.02 | -64.89 | 0.60 | -66.80 | 0.0328 | -0.0753 | |||
| DGII / Digi International Inc. | 0.02 | 3.51 | 0.59 | 29.67 | 0.0321 | 0.0050 | |||
| PBI / Pitney Bowes Inc. | 0.05 | 3.39 | 0.59 | 24.68 | 0.0319 | 0.0038 | |||
| PBH / Prestige Consumer Healthcare Inc. | 0.01 | 3.55 | 0.57 | -3.86 | 0.0312 | -0.0043 | |||
| SXI / Standex International Corporation | 0.00 | 3.49 | 0.57 | 0.35 | 0.0310 | -0.0029 | |||
| WT / WisdomTree, Inc. | 0.05 | 3.42 | 0.57 | 33.49 | 0.0310 | 0.0055 | |||
| AMR / Alpha Metallurgical Resources, Inc. | 0.01 | 3.35 | 0.57 | -7.19 | 0.0309 | -0.0056 | |||
| FBIN / Fortune Brands Innovations, Inc. | 0.01 | 3.48 | 0.57 | -12.54 | 0.0307 | -0.0078 | |||
| KALU / Kaiser Aluminum Corporation | 0.01 | 0.55 | 0.0299 | 0.0299 | |||||
| VRE / Veris Residential, Inc. | 0.04 | 3.39 | 0.54 | -8.95 | 0.0293 | -0.0060 | |||
| CNM / Core & Main, Inc. | 0.01 | -83.34 | 0.54 | -80.26 | 0.0293 | -0.1413 | |||
| STEP / StepStone Group Inc. | 0.01 | 0.54 | 0.0292 | 0.0292 | |||||
| PMT / PennyMac Mortgage Investment Trust | 0.04 | 3.37 | 0.53 | -9.18 | 0.0290 | -0.0060 | |||
| WABC / Westamerica Bancorporation | 0.01 | 3.47 | 0.53 | -0.93 | 0.0290 | -0.0031 | |||
| ARI / Apollo Commercial Real Estate Finance, Inc. | 0.06 | 0.53 | 0.0290 | 0.0290 | |||||
| LEG / Leggett & Platt, Incorporated | 0.06 | 3.44 | 0.53 | 16.56 | 0.0287 | 0.0017 | |||
| HP / Helmerich & Payne, Inc. | 0.03 | 3.43 | 0.52 | -40.05 | 0.0285 | -0.0236 | |||
| GBX / The Greenbrier Companies, Inc. | 0.01 | 3.36 | 0.52 | -6.95 | 0.0284 | -0.0051 | |||
| EFC / Ellington Financial Inc. | 0.04 | 3.38 | 0.51 | 1.20 | 0.0275 | -0.0023 | |||
| GO / Grocery Outlet Holding Corp. | 0.04 | -73.75 | 0.50 | -76.71 | 0.0271 | -0.1003 | |||
| PZZA / Papa John's International, Inc. | 0.01 | 0.49 | 0.0266 | 0.0266 | |||||
| STAG / STAG Industrial, Inc. | 0.01 | 3.49 | 0.48 | 3.86 | 0.0264 | -0.0014 | |||
| BHLB / Berkshire Hills Bancorp, Inc. | 0.02 | 3.31 | 0.48 | -0.82 | 0.0262 | -0.0028 | |||
| MGY / Magnolia Oil & Gas Corporation | 0.02 | 3.37 | 0.48 | -8.05 | 0.0261 | -0.0050 | |||
| VTOL / Bristow Group Inc. | 0.01 | 3.50 | 0.48 | 8.13 | 0.0261 | -0.0004 | |||
| SPTN / SpartanNash Company | 0.02 | 151.10 | 0.48 | 230.34 | 0.0261 | 0.0124 | |||
| OTTR / Otter Tail Corporation | 0.01 | 0.48 | 0.0260 | 0.0260 | |||||
| VRTS / Virtus Investment Partners, Inc. | 0.00 | -68.86 | 0.47 | -67.25 | 0.0256 | -0.0599 | |||
| ANDE / The Andersons, Inc. | 0.01 | -65.51 | 0.45 | -70.49 | 0.0246 | -0.0668 | |||
| Russell 2000 E-Mini Index / DE (N/A) | 0.45 | 0.0244 | 0.0244 | ||||||
| TREX / Trex Company, Inc. | 0.01 | 3.63 | 0.45 | -3.05 | 0.0242 | -0.0031 | |||
| IART / Integra LifeSciences Holdings Corporation | 0.04 | 3.44 | 0.44 | -42.22 | 0.0238 | -0.0214 | |||
| COHU / Cohu, Inc. | 0.02 | 3.45 | 0.40 | 35.35 | 0.0219 | 0.0042 | |||
| HFWA / Heritage Financial Corporation | 0.02 | 3.31 | 0.40 | 1.28 | 0.0216 | -0.0018 | |||
| AAMI / Acadian Asset Management Inc. | 0.01 | 3.54 | 0.38 | 41.26 | 0.0207 | 0.0046 | |||
| HTZ / Hertz Global Holdings, Inc. | 0.05 | -1.41 | 0.37 | 104.47 | 0.0199 | 0.0070 | |||
| LPG / Dorian LPG Ltd. | 0.01 | 3.26 | 0.35 | 12.62 | 0.0189 | 0.0005 | |||
| RWT / Redwood Trust, Inc. | 0.06 | 0.35 | 0.0188 | 0.0188 | |||||
| SXC / SunCoke Energy, Inc. | 0.04 | 3.37 | 0.33 | -3.47 | 0.0182 | -0.0025 | |||
| CFFN / Capitol Federal Financial, Inc. | 0.05 | 3.43 | 0.33 | 12.59 | 0.0180 | 0.0005 | |||
| ALGT / Allegiant Travel Company | 0.01 | 3.60 | 0.32 | 10.58 | 0.0176 | 0.0001 | |||
| BDN / Brandywine Realty Trust | 0.07 | 3.39 | 0.31 | -0.64 | 0.0169 | -0.0017 | |||
| ASIX / AdvanSix Inc. | 0.01 | 3.44 | 0.29 | 8.55 | 0.0159 | -0.0002 | |||
| NVRI / Enviri Corporation | 0.03 | 3.47 | 0.29 | 34.91 | 0.0156 | 0.0029 | |||
| KREF / KKR Real Estate Finance Trust Inc. | 0.03 | 3.41 | 0.28 | -16.02 | 0.0154 | -0.0047 | |||
| NX / Quanex Building Products Corporation | 0.01 | 3.48 | 0.28 | 5.34 | 0.0150 | -0.0006 | |||
| HBI / Hanesbrands Inc. | 0.05 | 3.42 | 0.24 | -18.18 | 0.0133 | -0.0044 | |||
| PUMP / ProPetro Holding Corp. | 0.04 | 3.37 | 0.23 | -16.04 | 0.0123 | -0.0037 | |||
| BFS / Saul Centers, Inc. | 0.01 | 3.07 | 0.19 | -2.60 | 0.0102 | -0.0013 | |||
| NYMT / New York Mortgage Trust, Inc. | 0.03 | 0.17 | 0.0091 | 0.0091 | |||||
| TALO / Talos Energy Inc. | 0.02 | 3.36 | 0.15 | -10.24 | 0.0081 | -0.0018 | |||
| VECO / Veeco Instruments Inc. | 0.00 | 3.57 | 0.07 | 4.35 | 0.0039 | -0.0002 | |||
| ZD / Ziff Davis, Inc. | 0.00 | -100.00 | 0.00 | -100.00 | -0.0532 |